National Assessment of Coastal Vulnerability to Sea-Level Rise: Preliminary Results for the U.S. Atlantic Coast
Discussion: New York to New Jersey Region
Click on each figure for larger view.
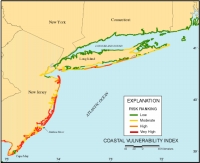
Figure 4. Map of the Coastal Vulnerability Index for the New York to New Jersey region.
|
|
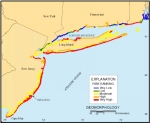
Figure 5. Map of the geomorphology variable for the New York to New Jersey region.
|
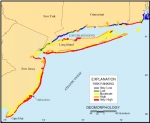
Figure 6. Map of the coastal slope variable for the New York to New Jersey region.
|
| |
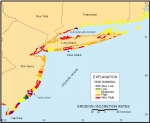
Figure 7. Map of the shoreline erosion/accretion rate variable for the New York to New Jersey region.
|
|
The coastal vulnerability index (CVI) values for this region (Figure 4) correlate best with the
geomorphology (Figure 5) variable.
The open-ocean shoreline, for example, is composed primarily of
high-risk sandy barrier islands, while risk due to geomorphology is
lower for the lagoons and along the bluffs of northern Long Island.
The coastal slope (Figure 6) is
relatively steep (low risk) throughout much of this area, but
becomes lower (relatively higher risk) in southern New Jersey.
The smaller-scale variations in the CVI values are influenced
primarily by changes in shoreline erosion rate (Figure 7). Two ways in which the erosion
rate impacts upon the CVI are evident. First, the lack of data for
lagoon shorelines along southern Long Island and southern New
Jersey causes erosion rates there to default to the values for the
open-ocean shoreline (e.g., Jones Island). This is partially an
artifact of the original CEIS data set, but also the coarse grid
size (0.25 degrees) used by Gornitz and White (1992) from which
these data were obtained for this study. Second, where other
variables are essentially equal (e.g., southern New Jersey), the
erosion rate data dominate the CVI. The combined effect of these
two problems is particularly visible just north of Cape May, where
a short reach of shoreline, extending from the barrier island coast
to the lagoon, has an anomalously low CVI ranking. This is in
contrast to the reach of shoreline just south of the Mullica River
that has a similar physiographic setting. As described above,
updated and higher-accuracy shoreline change data are needed to
rectify such problems.
|