|
| U. S. Geological Survey Open-File Report 01-154 |
SEA-FLOOR PHOTOGRAPHY FROM THE CONTINENTAL MARGIN PROGRAM:
A Pictorial Survey of Benthic Character and Habitats
|
||
|
Introduction
|
INTRODUCTIONIn 1962, Congress authorized the Continental Margin Program, a joint program between the
U.S. Geological Survey
(USGS) and the
Woods Hole Oceanographic Institution
(WHOI) to conduct a geological reconnaissance investigation of the continental shelf and slope off the Atlantic coast of the United
The bottom photographs in this gallery are especially important because they can be used to appraise bottom variability, faunal communities, and sedimentary processes around stations distributed over a wide geographic area. These photographs also document bedrock outcrops, boulder fields, and coarse gravelly areas where statistically meaningful samples could not be collected. It is precisely because of this inability to collect adequate gravel samples that this fraction is often under-represented in many sediment grain size databases (Hastings and others, 2000). Furthermore, many scientific questions and policy issues related to sediments require data of historical, regional and interdisciplinary scope. Acquisition of new data is expensive and may duplicate previous efforts if a full interpretation of existent data has not occurred. Consequently, the body of existing data need to be utilized to its maximum so that it can serve as a foundation, baseline, and starting point for further work. An accessible, documented, and simple-to-use compilation of existing data on sediment properties is essential for environmental managers, policy-makers, scientific researchers, and interested members of the public. To this end, we have converted the bottom photographs from the Continental Margin Program into digital images in order to produce a data set which will be available to a wider variety of current and potential users. Individuals interested in discussions of the sediment distributions and processes completed as part of the Continental Margin Program are directed to Pratt (1968), Stanley (1969), Schlee and Pratt (1970), Schlee (1973), and Hollister (1973). Individuals interested in discussions of the petrology and mineralogy of the sediments completed as part of this program are directed to Ross (1970) and Milliman (1972). Individuals interested in discussions of the geologic background, physiography, and shallow structure completed as part of this program are directed to Emery (1966), Uchupi (1968), and Uchupi (1970), respectively. Individuals interested in discussions of faunal distributions completed as part of this program are directed to Hazel (1970) and Theroux and Wigley (1998). Cruise information, sample identifiers, and raw data from the textural, mineralogical, geochemical, and biological analyses were originally published in Hathaway (1971). METHODSMost
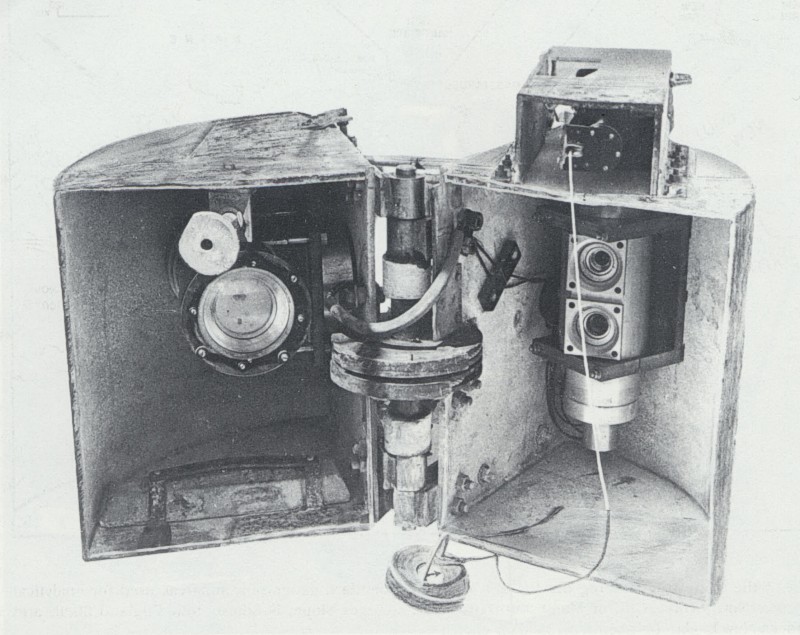
of the bottom photographs presented in this report were collected aboard
the Woods Hole Oceanographic Institution research vessels Gosnold
and Asterias
between April 1963 and August 1964. A few of the bottom photographs were collected aboard the Woods Hole Oceanographic Institution RV Gosnold and DSV ALVIN between May 1966 and May 1968 using an Edgerton camera. This camera, which took pictures automatically in a timed sequence, was lowered on a wire during deployments from the RV Gosnold and was attached to the hull of the submersible. Nine of the photographs contained in this report have navigation, but no documentation describing cruise information or camera systems. No sediments were collected with these photographs. Most of the stations occupied during the Continental Margin Project were numbered sequentially and generally increased from north to south. If more than one photograph was taken at a site, the station numbers are followed by letters. This letter is considered part of the station number and indicates a specific position for the station that differs from one having a different following letter. Those stations beginning with letters were collected by ships of the Bureau of Commercial Fisheries. Station numbers preceded by 529 were not collected on the grid used for the Continental Margin Project, but were used in publications presenting results from this program (Pratt, 1968; Hollister, 1973) and are therefore included in this report. Although samples were collected along the entire U.S. east coast as part of the Continental Margin Program, a gap in the bottom-photograph coverage occurs off the coasts of North and South Carolina. This gap results from the loss of the Campbell Grab and continued sampling prior to the acquisition of a replacement. Most of the bottom photographs were developed and printed at sea soon after collection. For this report, the original prints and negatives were scanned with an Epson Expression flatbed scanner, and enhanced and labeled in Adobe Photoshop (v. 5.0). The images were exported in TIFF format for archival purposes and, in order to reduce space requirements, in JPEG format for release on this CD-ROM and the WWW. See the section entitled "Viewing the Photographs" for a discussion on how to display the photos on-screen. A table listing the station identifiers for each bottom photograph are supplied in two formats: ASCII text (stations.txt) and Microsoft EXCEL (stations.xls). Both files may be found in the table directory located at the top-level of this CD-ROM. Table field attributes include: station, cruise, latitude, longitude, water depth (m), camera device, comments on the lithology, and number of images at that station. Individuals should be careful when assuming precise positional accuracy because of the navigational equipment used to locate the bottom photography stations. Most of the stations were navigated with Loran-A; some near-shore stations were navigated by radar and line of sight. As a general rule of thumb, Loran-A had an average expected accuracy of 1 percent of the distance between the navigator and the onshore Loran stations (U.S. Coast Guard, 1949). Depths annotated on the images are less accurate than the corrected depths provided in the tables. SEA FLOOR GEOLOGYThese images are supplied as representative examples of the common benthic
Benthic environments can be inferred from sediment texture at many of the bottom photography stations.
Gravels, which suggest environments of erosion and
nondeposition, occur within areas characterized by strong bottom currents as well as exposures of Environments of coarse-grained bedload transport (example) occur within areas characterized by coarse to fine sand with little or no mud and ubiquitous bedforms. Bottoms characterized by variable amounts of sand and mud and bedforms that are fainter and of a smaller scale than in environments characterized by coarse-grained sediment transport suggest environments of sediment sorting and reworking. Environments of fine-grained deposition (example) occur within areas characterized by weak bottom currents and muddy sediments. |
|