Photographs of the Sea Floor Offshore of New York and New Jersey, USGS Open-File Report 01-470
Title Page / Contents / Software / Introduction / Photo System / Photographs / Movies / Acknowledgments / References / List of Figures
Appendices: I. Bottom Photographs / II. Sea Floor Movies / III. Sediment Texture / IV. ArcView Project / V. Metadata
Appendix IV: ArcView Project
Viewing the photographs and movies using ArcView
The bottom photos and movies may be viewed in an ESRI (Environmental Systems Research Institute, URL: http://www.esri.com) ArcView 3.2 (or higher) project. In the ArcView project, the station locations can be viewed along with shaded relief or backscatter intensity images of part of the New York Bight (obtained from a multibeam sea floor mapping system (Butman and others (1998) and Butman and others (2002)), backscatter intensity from sidescan sonar (Schwab and others, 2003), or with geologic units identified from the sidescan sonar. These images provide some regional geologic context for the bottom photographs and samples. The multibeam images are preliminary (see metadata for description).
To use the ArcView project, open the file nyofr01_470.apr (located in the nybgis directory) with ArcView 3.2 or higher. A dialogue box will appear requesting the path to the 'nybgis/nypages' directory. If you are running the project from the DVDROM, enter the drive letter of your DVDROM reader (set as D in the pop-up), then click OK. If the project has been copied onto a hard drive, enter the entire pathway to the 'nybgis/nyimage' directory. The ArcView Spatial Analyst extension must be installed to view the NOAA Coastal Relief Model bathymetry theme (remosaic). The MrSID Image support extension must be loaded to view the sidescan sonar theme (Apex_li.sid) that has been compressed with LizardTech (URL: http://www.lizardtech.com/) MrSID Geospatial Encoder 1.3.1 image compression utility.
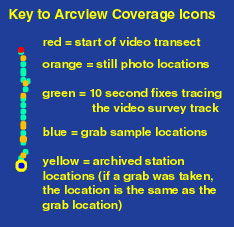 The ArcView project contains five views. View 1 includes all of the station data in this report. Views 2-4 contain the station information for the sampling locations that were occupied on each cruise. In each view, themes (1) show a station location that provides a link to all photographs (themes ny_stat.shp, seaxstat.shp, alphstat.shp, ocnsstat.shp, or endvstat.shp), (2) show the locations of each still photograph (themes ny_pics.shp, seaxpics.shp, alphpics.shp, ocnspics.shp, or endvpics.shp), (3) show the locations of the grab samples (themes ny_seds.shp, seaxseds.shp, alphseds.shp, ocnsseds.shp, or endvseds.shp), (4) show positions every 10 seconds along the video transects (themes ny_vid.shp, seaxvid.shp, alphvid.shp, ocnsvid.shp, or endvvid.shp), and (5) show the start of the large and small video clips ( movs*.shp for the small format movies, and movl*.shp for large-format movies, where * is the ship abbreviation alph, endv, ocns, or seax). The Key to ArcView Coverage Icons figure (right) illustrates the various themes (colors may vary between views). The individual photo locations (ny_pics.shp, seaxpics.shp, alphpics.shp, ocnspics.shp, or endvpics.shp) are not hot-linked, but the images displayed on the station page are in sequential order from the beginning to the end of the transect. Data sources for the ArcView project file are listed in Appendix V.
To view the photographs at a particular station using a hotlink, click on the photos or movies theme to make it active ( *stat.shp for photos, movs*.shp for the small format movies, and movl*.shp for large-format movies, where * is the ship abbreviation alph, endv, ocns, or seax), click on the lightening bolt icon on the toolbar, then click on the desired yellow station marker with the lightening bolt (the bottom tip of the lightening bolt icon must be positioned over the station marker). If a dialogue box pops up with "Hotlink to web/movie failed, check path", click on the P button in the toolbar, check the path to the folder 'nyimage' and change if necessary. If no movie or image pops up there are no images for that station. Double click on an image in the resulting station page to view a larger image.
Description of Views in the ArcView Project File (nyofr01_470.apr)
The themes included in each view are listed below. For more detailed description of each theme, see Description of Themes in GIS. The views are presented in a Mercator projection on the WGS84 ellipsoid, using a latitude of true scale at 40o N. and a central meridian of -75o W.
View 1: New York Bight Sea Floor Images and Sediment Samples
This view shows the location of all of the bottom photos, images and grab samples presented in this data report. Bathymetry, backscatter intensity from sidescan sonar (from Schwab and others, 2000), and backscatter intensity, shaded relief, colored backscatter intensity over shaded relief (from Butman and others (1998) and Butman and others (2002)) are included to provide a regional context for viewing the bottom images.
Themes View 1 (in alphabetical order by filename) include:
| File Name | Description |
| Anthro.shp | Geologic unit - Anthropogenic disposal material (dredged material/construction debris) |
| Apex_li.sid | Backscatter intensity from sidescan sonar for the New York Bight Apex and along the southern shore of Long Island. |
| Cret.shp | Geologic unit - Outcropping early Tertiary and Late Cretaceous coastal plain strata |
| Hars.shp | Historic Area Remediation Site Boundary |
| Holofsd.shp | Geologic unit - Holocene fine sand |
| Holosdwv.shp | Geologic unit - Holocene sand waves |
| Holosilt.shp | Geologic unit - Holocene silt |
| Holosrcr.shp | Geologic unit - Holocene sand ridges and reworked K/T coastal plain strata |
| Holosrpl.shp | Geologic unit - Holocene coarse sand |
| Har96mos.tif | HARS - backscatter intensity in 1996 (from multibeam) |
| Har96pse.tif | HARS - pseudo-colored backscatter intensity over shaded relief in 1996 (from multibeam) |
| Har96sun.tif | HARS - shaded relief in 1996 (from multibeam) |
| Har98mos.tif | HARS - backscatter intensity in 1998 (from multibeam) |
| Har98pse.tif | HARS - pseudo-colored backscatter intensity over shaded relief in 1998 (from multibeam) |
| Har98sun.tif | HARS - shaded relief in 1998 (from multibeam) |
| Har00mos.tif | HARS - backscatter intensity in 2000 (from multibeam) |
| Har00pse.tif | HARS - pseudo-colored backscatter intensity over shaded relief in 2000 (from multibeam) |
| Har00sun.tif | HARS - shaded relief in 2000 (from multibeam) |
| Movlocl.shp | Locations of video clips (large) |
| Movlocs.shp | Locations of video clips (small) |
| Ngdc_20_200.shp | Bathymetric contours |
| Nyb_mos.tif | Hudson Shelf Valley - backscatter intensity (from multibeam - preliminary) |
| Nyb_pse.tif | Hudson Shelf Valley - pseudo-colored backscatter intensity over shaded relief (from multibeam - preliminary) |
| Nyb_sun.tif | Hudson Shelf Valley - shaded relief (from multibeam - preliminary) |
| Nymoors.shp | Moorings deployed in winter 1999-2000 |
| Ny_pics.shp | Bottom photograph locations |
| Ny_seds.shp | Grab sample locations |
| Ny_stats.shp | Station locations |
| Pleisgvl.shp | Geologic unit - Pleistocene gravelly sand deposits |
| Pleisgsd.shp | Geologic unit - Pleistocene glaciofluvial sand and gravel reworked into transverse bedforms |
| Rb_holo.shp | Geologic unit - Raritan Bay Holocene deposits |
| Remosaic | Bathymetry - color coded |
View 2: R/V Seaward Explorer, June 1996
This view shows the location of all of the bottom photos, images and grab samples obtained on the R/V Seaward Explorer. Bathymetry, backscatter intensity from sidescan sonar (from Schwab and others, 2000), and backscatter intensity, shaded relief, colored backscatter intensity over shaded relief (from Butman and others (1998) and Butman and others (2002)) are included to provide a regional context for viewing the bottom images.
Themes in View 2 (in alphabetical order by filename) include:
| File Name | Description |
| Anthro.shp | Geologic unit - Anthropogenic disposal material (dredged material/construction debris) |
| Apex_li.sid | Backscatter intensity from sidescan sonar for the New York Bight Apex and along the southern shore of Long Island. |
| Cret.shp | Geologic unit - Outcropping early Tertiary and Late Cretaceous coastal plain strata |
| Hars.shp | Historic Area Remediation Site Boundary |
| Holofsd.shp | Geologic unit - Holocene fine sand |
| Holosdwv.shp | Geologic unit - Holocene sand waves |
| Holosilt.shp | Geologic unit - Holocene silt |
| Holosrcr.shp | Geologic unit - Holocene sand ridges and reworked K/T coastal plain strata |
| Holosrpl.shp | Geologic unit - Holocene coarse sand |
| Har96mos.tif | HARS - backscatter intensity in 1996 (from multibeam) |
| Har96pse.tif | HARS - pseudo-colored backscatter intensity over shaded relief in 1996 (from multibeam) |
| Har96sun.tif | HARS - shaded relief in 1996 (from multibeam) |
| Har98mos.tif | HARS - backscatter intensity in 1998 (from multibeam) |
| Har98pse.tif | HARS - pseudo-colored backscatter intensity over shaded relief in 1998 (from multibeam) |
| Har98sun.tif | HARS - shaded relief in 1998 (from multibeam) |
| Har00mos.tif | HARS - backscatter intensity in 2000 (from multibeam) |
| Har00pse.tif | HARS - pseudo-colored backscatter intensity over shaded relief in 2000 (from multibeam) |
| Har00sun.tif | HARS - shaded relief in 2000 (from multibeam) |
| Ngdc_20_200.shp | Bathymetric contours |
| Nyb_mos.tif | Hudson Shelf Valley - backscatter intensity (from multibeam - preliminary) |
| Nyb_pse.tif | Hudson Shelf Valley - pseudo-colored backscatter intensity over shaded relief (from multibeam - preliminary) |
| Nyb_sun.tif | Hudson Shelf Valley - shaded relief (from multibeam - preliminary) |
| Nymoors.shp | Moorings deployed in winter 1999-2000 |
| Pleisgvl.shp | Geologic unit - Pleistocene gravelly sand deposits |
| Pleisgsd.shp | Geologic unit - Pleistocene glaciofluvial sand and gravel reworked into transverse bedforms |
| Rb_holo.shp | Geologic unit - Raritan Bay Holocene deposits |
| Remosaic | Bathymetry - color coded |
| Seaxpics.shp | Bottom photograph locations |
| Seaxseds.shp | Grab sample locations |
| Seaxstats.shp | Station locations |
| Seaxvid.shp | Video-survey transects |
View 3: F/V Alpha and Omega, September 1998
This view shows the location of all of the bottom photos, images and grab samples obtained on the F/V Alpha and Omega. Bathymetry, backscatter intensity from sidescan sonar (from Schwab and others, 2000), and backscatter intensity, shaded relief, colored backscatter intensity over shaded relief (from Butman and others (1998) and Butman and others (2002)) are included to provide a regional context for viewing the bottom images.
Themes in View 3 (in alphabetical order by filename) include:
| File Name | Description |
| Alphpics.shp | Bottom photograph locations |
| Alphseds.shp | Grab sample locations |
| Alphstats.shp | Station locations |
| Alphvid.shp | Video-survey transects |
| Alvidst.shp | Start of video transects |
| Anthro.shp | Geologic unit - Anthropogenic disposal material (dredged material/construction debris) |
| Apex_li.sid | Backscatter intensity from sidescan sonar for the New York Bight Apex and along the southern shore of Long Island. |
| Cret.shp | Geologic unit - Outcropping early Tertiary and Late Cretaceous coastal plain strata |
| Hars.shp | Historic Area Remediation Site Boundary |
| Holofsd.shp | Geologic unit - Holocene fine sand |
| Holosdwv.shp | Geologic unit - Holocene sand waves |
| Holosilt.shp | Geologic unit - Holocene silt |
| Holosrcr.shp | Geologic unit - Holocene sand ridges and reworked K/T coastal plain strata |
| Holosrpl.shp | Geologic unit - Holocene coarse sand |
| Har96mos.tif | HARS - backscatter intensity in 1996 (from multibeam) |
| Har96pse.tif | HARS - pseudo-colored backscatter intensity over shaded relief in 1996 (from multibeam) |
| Har96sun.tif | HARS - shaded relief in 1996 (from multibeam) |
| Har98mos.tif | HARS - backscatter intensity in 1998 (from multibeam) |
| Har98pse.tif | HARS - pseudo-colored backscatter intensity over shaded relief in 1998 (from multibeam) |
| Har98sun.tif | HARS - shaded relief in 1998 (from multibeam) |
| Har00mos.tif | HARS - backscatter intensity in 2000 (from multibeam) |
| Har00pse.tif | HARS - pseudo-colored backscatter intensity over shaded relief in 2000 (from multibeam) |
| Har00sun.tif | HARS - shaded relief in 2000 (from multibeam) |
| Ngdc_20_200.shp | Bathymetric contours |
| Nyb_mos.tif | Hudson Shelf Valley - backscatter intensity (from multibeam - preliminary) |
| Nyb_pse.tif | Hudson Shelf Valley - pseudo-colored backscatter intensity over shaded relief (from multibeam - preliminary) |
| Nyb_sun.tif | Hudson Shelf Valley - shaded relief (from multibeam - preliminary) |
| Nymoors.shp | Moorings deployed in winter 1999-2000 |
| Pleisgvl.shp | Geologic unit - Pleistocene gravelly sand deposits |
| Pleisgsd.shp | Geologic unit - Pleistocene glaciofluvial sand and gravel reworked into transverse bedforms |
| Rb_holo.shp | Geologic unit - Raritan Bay Holocene deposits |
| Remosaic | Bathymetry - color coded |
Back to top of page
View 4: R/V Oceanus, December 1999
This view shows the location of all of the bottom photos, images and grab samples obtained on the R/V Oceanus. Bathymetry, backscatter intensity from sidescan sonar (from Schwab and others, 2000), and backscatter intensity, shaded relief, colored backscatter intensity over shaded relief (from Butman and others (1998) and Butman and others (2002)) are included to provide a regional context for viewing the bottom images.
Themes in View 4 (in alphabetical order by filename) include:
| File Name | Description |
| Anthro.shp | Geologic unit - Anthropogenic disposal material (dredged material/construction debris) |
| Apex_li.sid | Backscatter intensity from sidescan sonar for the New York Bight Apex and along the southern shore of Long Island. |
| Cret.shp | Geologic unit - Outcropping early Tertiary and Late Cretaceous coastal plain strata |
| Hars.shp | Historic Area Remediation Site Boundary |
| Holofsd.shp | Geologic unit - Holocene fine sand |
| Holosdwv.shp | Geologic unit - Holocene sand waves |
| Holosilt.shp | Geologic unit - Holocene silt |
| Holosrcr.shp | Geologic unit - Holocene sand ridges and reworked K/T coastal plain strata |
| Holosrpl.shp | Geologic unit - Holocene coarse sand |
| Har96mos.tif | HARS - backscatter intensity in 1996 (from multibeam) |
| Har96pse.tif | HARS - pseudo-colored backscatter intensity over shaded relief in 1996 (from multibeam) |
| Har96sun.tif | HARS - shaded relief in 1996 (from multibeam) |
| Har98mos.tif | HARS - backscatter intensity in 1998 (from multibeam) |
| Har98pse.tif | HARS - pseudo-colored backscatter intensity over shaded relief in 1998 (from multibeam) |
| Har98sun.tif | HARS - shaded relief in 1998 (from multibeam) |
| Har00mos.tif | HARS - backscatter intensity in 2000 (from multibeam) |
| Har00pse.tif | HARS - pseudo-colored backscatter intensity over shaded relief in 2000 (from multibeam) |
| Har00sun.tif | HARS - shaded relief in 2000 (from multibeam) |
| Movlocns.shp | Locations of video clips (large) |
| Movsocns.shp | Locations of video clips (small) |
| Ngdc_20_200.shp | Bathymetric contours |
| Nyb_mos.tif | Hudson Shelf Valley - backscatter intensity (from multibeam - preliminary) |
| Nyb_pse.tif | Hudson Shelf Valley - pseudo-colored backscatter intensity over shaded relief (from multibeam - preliminary) |
| Nyb_sun.tif | Hudson Shelf Valley - shaded relief (from multibeam - preliminary) |
| Nymoors.shp | Moorings deployed in winter 1999-2000 |
| Ocnspics.shp | Bottom photograph locations |
| Ocnsseds.shp | Grab sample locations |
| Ocnsstat.shp | Station locations |
| Ocnsvid.shp | Video survey tracks |
| Ocvidst.shp | Start of video transects |
| Pleisgvl.shp | Geologic unit - Pleistocene gravelly sand deposits |
| Pleisgsd.shp | Geologic unit - Pleistocene glaciofluvial sand and gravel reworked into transverse bedforms |
| Rb_holo.shp | Geologic unit - Raritan Bay Holocene deposits |
| Remosaic | Bathymetry - color coded |
View 5: R/V Endeavor, April 2000
This view shows the location of all of the bottom photos, images and grab samples obtained on the R/V Endeavor. Bathymetry, backscatter intensity from sidescan sonar (from Schwab and others, 2000), and backscatter intensity, shaded relief, colored backscatter intensity over shaded relief (from Butman and others (1998) and Butman and others (2002)) are included to provide a regional context for viewing the bottom images.
Themes in View 5 (in alphabetical order by filename) include:
| File Name | Description |
| Anthro.shp | Geologic unit - Anthropogenic disposal material (dredged material/construction debris) |
| Apex_li.sid | Backscatter intensity from sidescan sonar for the New York Bight Apex and along the southern shore of Long Island. |
| Cret.shp | Geologic unit - Outcropping early Tertiary and Late Cretaceous coastal plain strata |
| Endvpics.shp | Bottom photograph locations |
| Endvseds.shp | Grab sample locations |
| Endvstat.shp | Station locations |
| Envidst.shp | Video survey tracks |
| Endvvid.shp | Start of video transects |
| Hars.shp | Historic Area Remediation Site Boundary |
| Holofsd.shp | Geologic unit - Holocene fine sand |
| Holosdwv.shp | Geologic unit - Holocene sand waves |
| Holosilt.shp | Geologic unit - Holocene silt |
| Holosrcr.shp | Geologic unit - Holocene sand ridges and reworked K/T coastal plain strata |
| Holosrpl.shp | Geologic unit - Holocene coarse sand |
| Har96mos.tif | HARS - backscatter intensity in 1996 (from multibeam) |
| Har96pse.tif | HARS - pseudo-colored backscatter intensity over shaded relief in 1996 (from multibeam) |
| Har96sun.tif | HARS - shaded relief in 1996 (from multibeam) |
| Har98mos.tif | HARS - backscatter intensity in 1998 (from multibeam) |
| Har98pse.tif | HARS - pseudo-colored backscatter intensity over shaded relief in 1998 (from multibeam) |
| Har98sun.tif | HARS - shaded relief in 1998 (from multibeam) |
| Har00mos.tif | HARS - backscatter intensity in 2000 (from multibeam) |
| Har00pse.tif | HARS - pseudo-colored backscatter intensity over shaded relief in 2000 (from multibeam) |
| Har00sun.tif | HARS - shaded relief in 2000 (from multibeam) |
| Movlendv.shp | Locations of video clips (large) |
| Movsendv.shp | Locations of video clips (small) |
| Ngdc_20_200.shp | Bathymetric contours |
| Nyb_mos.tif | Hudson Shelf Valley - backscatter intensity (from multibeam - preliminary) |
| Nyb_pse.tif | Hudson Shelf Valley - pseudo-colored backscatter intensity over shaded relief (from multibeam - preliminary) |
| Nyb_sun.tif | Hudson Shelf Valley - shaded relief (from multibeam - preliminary) |
| Nymoors.shp | Moorings deployed in winter 1999-2000 |
| Pleisgvl.shp | Geologic unit - Pleistocene gravelly sand deposits |
| Pleisgsd.shp | Geologic unit - Pleistocene glaciofluvial sand and gravel reworked into transverse bedforms |
| Rb_holo.shp | Geologic unit - Raritan Bay Holocene deposits |
| Remosaic | Bathymetry - color coded |
Description of Themes in GIS (in alphabetical order)
To obtain additional metadata on selected themes, click on the theme name. To download the files, click on the download file name.
Alphpics.shp Download :
alphshp.zip
Description: Location of bottom photographs obtained on F/V Alpha and
Omega cruise.
Alphseds.shp Download:
alphshp.zip
Description: Location of grab samples obtained on F/V Alpha and Omega
cruise.
Alphstats.shp Download:
alphshp.zip
Description: Link to all pictures on F/V Alpha and Omega cruise.
Alphvid.shp Download:
alphshp.zip
Description: Video survey tracks F/V Alpha and Omega cruise.
Alvidst.shp Download:
alphshp.zip
Description: Start of video transects on F/V Alpha and Omega cruise.
Anthro.shp Download:
geologyshp.zip
Description: Geologic unit showing area of anthropogenic disposal
material (dredged material and construction debris).
Source: Schwab and others, 2000
Apex_li.sid Download:
sonar.zip
Description: Backscatter intensity from sidescan sonar. Backscatter intensity, the intensity of the acoustic return to the sidescan sonar from the sea floor, is a measure of the properties of the surficial sediments and the bottom roughness. Generally, a strong return (light gray tones) is associated with rock or coarse-grained sediment, and a weak return (dark gray tones) with fine-grained sediments. However, the micro-topography, such as ripples, burrows, and benthic populations also affect the reflectivity of the sea floor. In addition, because the sidescan sonar is towed near the bottom, features on the sea floor may produce shadows (areas of no backscatter return that are shielded from the sonar source because they are located behind objects that protrude above the sea floor or in depressions) in the sonar record. See Schwab and others (2000, 2003) for interpretations of these data. Direct observations, using bottom photography or video, and surface samples, are needed to help verify interpretations of the backscatter intensity data. The sidescan sonar theme (Apex_li.sid) has been compressed with LizardTech (www.lizardtech.com) MrSID Geospatial Encoder 1.3.1 image compression utility. The MrSID Image support extension must be loaded to view those files.
Source: Schwab and others (2003)
Cret.shp Download:
geologyshp.zip
Description: Geologic unit showing area of outcropping early Tertiary
and Late Cretaceous coastal plain strata
Source: Schwab and others, 2000
Endvpics.shp Download
:
endvshp.zip
Description: Location of bottom photographs obtained on R/V Endeavor
cruise.
Endvseds.shp Download:
endvshp.zip
Description: Location of grab samples obtained on R/V Endeavor cruise.
Endvstat.shp Download: endvshp.zip
Description: Link to all pictures on R/V Endeavor cruise.
Envidst.shp Download:
endvshp.zip
Description: Start of video transects on R/V Endeavor cruise.
Endvvid.shp Download: endvshp.zip
Description: Video survey tracks R/V Endeavor cruise.
Har96mos.tif Download:
harsmulti.zip
Description: Backscatter intensity of the Historic Area Remediation
Site (HARS) in 1996 as determined by a multibeam survey (Butman and others, 2002).
Backscatter intensity, the intensity of the acoustic return from the sea floor
from the multibeam system, is a measure of the properties of the surficial sediments
and of the bottom roughness. Generally, a strong return (light gray tones) is
associated with rock or coarse-grained sediment, and a weak return (dark gray
tones) with fine-grained sediments. However, the micro-topography, such as ripples,
burrows, and benthic populations also affect the reflectivity of the sea floor.
Direct observations, using bottom photography or video, and surface samples,
are needed to verify interpretations of the backscatter intensity data. The
backscatter data have a weak striping that runs parallel to the ships track.
Some of the striping is the result of poor data return at nadir that appears
as evenly-spaced thin speckled lines. Some striping is also due to critical angle
effects, where the intensity of return varies as a function of the angle of incidence
of the incoming sound on the seafloor (Hughes-Clark and others, 1997).
Source: Butman and others, 2002.
Har98mos.tif Download:
harsmulti.zip
Description: Backscatter intensity of the Historic Area Remediation
Site (HARS) in 1998 as determined by a multibeam survey (Butman and others, 2002).
Backscatter intensity, the intensity of the acoustic return from the sea floor
from the multibeam system, is a measure of the properties of the surficial sediments
and of the bottom roughness. Generally, a strong return (light gray tones) is
associated with rock or coarse-grained sediment, and a weak return (dark gray
tones) with fine-grained sediments. However, the micro-topography, such as ripples,
burrows, and benthic populations also affect the reflectivity of the sea floor.
Direct observations, using bottom photography or video, and surface samples,
are needed to verify interpretations of the backscatter intensity data. The
backscatter data have a weak striping that runs parallel to the ships track.
Some of the striping is the result of poor data return at nadir that appears
as evenly-spaced thin speckled lines. Some striping is also due to critical angle
effects, where the intensity of return varies as a function of the angle of incidence
of the incoming sound on the seafloor (Hughes-Clark and others, 1997).
Source: Butman and others, 2002.
Har00mos.tif Download:
harsmulti.zip
Description: Backscatter intensity of the Historic Area Remediation
Site (HARS) in 2000 as determined by a multibeam survey (Butman and others, 2002).
Backscatter intensity, the intensity of the acoustic return from the sea floor
from the multibeam system, is a measure of the properties of the surficial sediments
and of the bottom roughness. Generally, a strong return (light gray tones) is
associated with rock or coarse-grained sediment, and a weak return (dark gray
tones) with fine-grained sediments. However, the micro-topography, such as ripples,
burrows, and benthic populations also affect the reflectivity of the sea floor.
Direct observations, using bottom photography or video, and surface samples,
are needed to verify interpretations of the backscatter intensity data. The
backscatter data have a weak striping that runs parallel to the ships track.
Some of the striping is the result of poor data return at nadir that appears
as evenly-spaced thin speckled lines. Some striping is also due to critical angle
effects, where the intensity of return varies as a function of the angle of incidence
of the incoming sound on the seafloor (Hughes-Clark and others, 1997).
Source: Butman and others, 2002.
Har96pse.tif Download:
harsmulti.zip
Description: Backscatter intensity combined with the topography of
the Historic Area Remediation Site (HARS) in 1996 as determined by a multibeam
survey (Butman and others, 2002). In the image shown here, the backscatter intensity
is represented by a suite of eight colors ranging from blue, which represents
low intensity, to red, which represents high intensity. These data are draped
over a shaded relief image created by vertically exaggerating the topography
four times and then artificially illuminating the relief by a light source positioned
45 degrees above the horizon from an azimuth of 350 degrees. The resulting image
displays light and dark intensities within each color band that result from a
feature's position with respect to the light source. For example, north-facing
slopes, receiving strong illumination, show as a light intensity within a color
band, whereas south-facing slopes, being in shadow, show as a dark intensity
within a color band.
Source: Butman and others, 2002.
Har98pse.tif Download:
harsmulti.zip
Description: Backscatter intensity combined with the topography of
the Historic Area Remediation Site (HARS) in 1998 as determined by a multibeam
survey (Butman and others, 2002). In the image shown here, the backscatter intensity
is represented by a suite of eight colors ranging from blue, which represents
low intensity, to red, which represents high intensity. These data are draped
over a shaded relief image created by vertically exaggerating the topography
four times and then artificially illuminating the relief by a light source positioned
45 degrees above the horizon from an azimuth of 350 degrees. The resulting image
displays light and dark intensities within each color band that result from a
feature's position with respect to the light source. For example, north-facing
slopes, receiving strong illumination, show as a light intensity within a color
band, whereas south-facing slopes, being in shadow, show as a dark intensity
within a color band.
Source: Butman and others, 2002.
Har00pse.tif Download:
harsmulti.zip
Description: Backscatter intensity combined with the topography of
the Historic Area Remediation Site (HARS) in 2000 as determined by a multibeam
survey (Butman and others, 2002). In the image shown here, the backscatter intensity
is represented by a suite of eight colors ranging from blue, which represents
low intensity, to red, which represents high intensity. These data are draped
over a shaded relief image created by vertically exaggerating the topography
four times and then artificially illuminating the relief by a light source positioned
45 degrees above the horizon from an azimuth of 350 degrees. The resulting image
displays light and dark intensities within each color band that result from a
feature's position with respect to the light source. For example, north-facing
slopes, receiving strong illumination, show as a light intensity within a color
band, whereas south-facing slopes, being in shadow, show as a dark intensity
within a color band.
Source: Butman and others, 2002.
Har96sun.tif Download: harsmulti.zip
Description: Shaded relief view of the topography of the Historic
Area Remediation Site (HARS) in 1996 as determined by a multibeam survey (Butman
and others, 2002). The shaded relief image (3 m pixel size) was created by vertically
exaggerating the topography four times and then artificially illuminating the
relief by a light source positioned 45 degrees above the horizon from an azimuth of 350 degrees. In the resulting image, topographic features are enhanced by strong illumination
on the northward-facing slopes and by shadows cast on southern slopes. The image
also accentuates small features (relief of a few meters) that could not be effectively
shown as contours alone at this scale. Unnatural-looking features or patterns
oriented parallel or perpendicular to survey tracklines (tracklines run north-south)
are artifacts of data collection and environmental conditions.
Source: Butman and others, 2002.
Har98sun.tif Download:
harsmulti.zip
Description: Shaded relief view of the topography of the Historic
Area Remediation Site (HARS) in 1998 as determined by a multibeam survey (Butman
and others, 2002). The shaded relief image (3 m pixel size) was created by vertically
exaggerating the topography four times and then artificially illuminating the
relief by a light source positioned 45 degrees above the horizon from an azimuth of 350 degrees.
In the resulting image, topographic features are enhanced by strong illumination
on the northward-facing slopes and by shadows cast on southern slopes. The image
also accentuates small features (relief of a few meters) that could not be effectively
shown as contours alone at this scale. Unnatural-looking features or patterns
oriented parallel or perpendicular to survey tracklines (tracklines run north-south)
are artifacts of data collection and environmental conditions.
Source: Butman and others, 2002.
Har00sun.tif Download: harsmulti.zip
Description: Shaded relief view of the topography of the Historic
Area Remediation Site (HARS) in 2000 as determined by a multibeam survey (Butman
and others, 2002). The shaded relief image (3 m pixel size) was created by vertically
exaggerating the topography four times and then artificially illuminating the
relief by a light source positioned 45 degrees above the horizon from an azimuth of 350 degrees.
In the resulting image, topographic features are enhanced by strong illumination
on the northward-facing slopes and by shadows cast on southern slopes. The image
also accentuates small features (relief of a few meters) that could not be effectively
shown as contours alone at this scale. Unnatural-looking features or patterns
oriented parallel or perpendicular to survey tracklines (tracklines run north-south)
are artifacts of data collection and environmental conditions.
Source: Butman and others, 2002.
Hars.shp Download: harsmulti.zip
Description: Boundary of the Historic Area Remediation Site (HARS)
Source: From Butman and others (2002)
Holofsd.shp Download:
geologyshp.zip
Description: Geologic unit showing area of Holocene fine sand.
Source: Schwab and others (2000)
Holosdwv.shp Download:
geologyshp.zip
Description: Geologic unit showing area of Holocene sand waves.
Source: Schwab and others (2000)
Holosilt.shp Download:
geologyshp.zip
Description: Geologic unit showing area of Holocene silt.
Source: Schwab and others (2000)
Holosrcr.shp Download:
geologyshp.zip
Description: Geologic unit showing area of Holocene sand ridges and
reworked K/T coastal plain strata
Source: Schwab and others (2000)
Holosrpl.shp Download:
geologyshp.zip
Description: Geologic unit showing area of Holocene sand ridges over
Pleistocene coarse sand and gravel (exposed in the troughs)
Source: Schwab and others (2000)
Holocrsd.shp Download:
geologyshp.zip
Description: Geologic unit showing area of Holocene coarse sand.
Source: Schwab and others (2000)
Movlendv.shp Download:
movieshp.zip
Description: Locations of video clips (large format) from R/V Endeavor
cruise.
Movsendv.shp Download:
movieshp.zip
Description: Locations of video clips (small format) from R/V Endeavor
cruise.
Movlocns.shp Download
:
movieshp.zip
Description: Locations of video clips (large format) from R/V Oceanus
cruise.
Movsocns.shp Download:
movieshp.zip
Description: Locations of video clips (small format) from R/V Oceanus
cruise.
Movlocl.shp Download:
movieshp.zip
Description: Locations of video clips (large format).
Movlocs.shp Download
:
movieshp.zip
Description: Locations of video clips (small format).
Ngdc_20_200.shp Download:
ngdcbathy.zip
Description: Selected bathymetric contours of the New York Bight
based on historical observations. These data were compiled from all historical
data and gridded at 90 m spatial resolution. Contours produced in ArcView
Source: National Oceanic and Atmospheric Administration Coastal Relief
Model.
Reference: www.ngdc.noaa.gov/mgg/coastal/coastal.html
Ny_pics.shp Download:
nyshp.zip
Description: Location of all bottom photographs in this report (from Seward Explorer, Alpha and Omega, Oceanus, and Endeavor)
Ny_seds.shp Download:
nyshp.zip
Description: Location of all bottom grab samples in this report (from Seward Explorer, Alpha and Omega, Oceanus, and Endeavor)
Ny_stats.shp Download:
nyshp.zip
Description: Location of all sampling stations in this report (from Seward Explorer, Alpha and Omega, Oceanus, and Endeavor)
Nyb_mos.tif Download: nyb_multi.zip
(Draft form; requires additional processing)
Description: Backscatter intensity of the Hudson Shelf Valley as determined
by multibeam surveys carried in 1996, 1998, and 2000. The data collected north
of 42º 15' N. was published in paper maps in Butman and others (1998). All of
the multibeam data, with the exception of the data in the Historic Area Remediation
Site (HARS), requires additional processing and is presented here in draft form
for viewing with the bottom photographs. Backscatter intensity, the intensity
of the acoustic return from the sea floor from the multibeam system, is a measure
of the properties of the surficial sediments and of the bottom roughness. Generally,
a strong return (light gray tones) is associated with rock or coarse-grained
sediment, and a weak return (dark gray tones) with fine-grained sediments. However,
the micro-topography, such as ripples, burrows, and benthic populations also
affect the reflectivity of the sea floor. Direct observations, using bottom
photography or video, and surface samples, are needed to verify interpretations
of the backscatter intensity data. The backscatter data have a weak striping
that runs parallel to the ships track. Some of the striping is the result of
poor data return at nadir that appears as evenly-spaced thin speckled lines.
Some striping is also due to critical angle effects, where the intensity of return
varies as a function of the angle of incidence of the incoming sound on the seafloor.
Source (partial): Butman and others (1998); Butman and others (2002)
Nyb_pse.tif Download: nyb_multi.zip
(Draft form; requires additional processing)
Description: Backscatter intensity combined with the shaded relief view
of the topography of the Hudson shelf Valley as determined by a multibeam surveys
carried in 1996, 1998, and 2000. The data collected north of 42º 15' N. was
published in paper maps in Butman and others (1998). All of the multibeam data,
with the exception of the data in the Historic Area Remediation Site (HARS),
requires additional processing and is presented here in draft form for viewing
with the bottom photographs. In the image shown here, the backscatter intensity
is represented by a suite of eight colors ranging from blue, which represents
low intensity, to red, which represents high intensity. These data are draped
over a shaded relief image created by vertically exaggerating the topography
four times and then artificially illuminating the relief by a light source positioned
45 degrees above the horizon from the north. The resulting image
displays light and dark intensities within each color band that result from a
feature's position with respect to the light source. For example, north-facing
slopes, receiving strong illumination, show as a light intensity within a color
band, whereas south-facing slopes, being in shadow, show as a dark intensity
within a color band.
Source (partial): Butman and others (1998); Butman and others (2002)
Nyb_sun.tif Download: nyb_multi.zip
(Draft form; requires additional processing)
Description: Shaded relief view of the topography of the Hudson shelf
Valley as determined by a multibeam surveys carried in 1996, 1998, and 2000.
The data collected north of 42º 15' N. was published in paper maps in Butman
and others (1998). All of the multibeam data, with the exception of the data
in the Historic Area Remediation Site (HARS), requires additional processing
and is presented here in draft form for viewing with the bottom photographs.
The shaded relief image was created by vertically exaggerating the topography
four times and then artificially illuminating the relief by a light source positioned
45 degrees above the horizon from the north. In the resulting image, topographic
features are enhanced by strong illumination on the northward-facing slopes and
by shadows cast on southern slopes. The image also accentuates small features
(relief of a few meters) that could not be effectively shown as contours alone
at this scale. Unnatural-looking features or patterns oriented parallel or perpendicular
to survey tracklines (tracklines run north-south) are artifacts of data collection
and environmental conditions.
Source (partial): Butman and others (1998); Butman and others (2002)
Nymoors.shp
Download: nymoorshp.zip
Description: Location of instrumented moorings deployed by USGS
between December 1999 and April 2000. See Harris and others (submitted), and
Butman and others (2002).
Ocnspics.shp Download: ocnsshp.zip
Description: Location of bottom photographs obtained on R/V Oceanus cruise.
Ocnsseds.shp Download: ocnsshp.zip
Description: Location of grab samples obtained on R/V Oceanus cruise.
Ocnsstat.shp Download: ocnsshp.zip
Description: Link to all pictures on R/V Oceanus cruise.
Ocvidst.shp Download: ocnsshp.zip
Description: Start of video transects on R/V Oceanus cruise.
Ocnsvid.shp Download: ocnsshp.zip
Description: Video survey tracks on R/V Oceanus cruise.
Pleisgvl.shp Download: geologyshp.zip
Description: Geologic unit showing are of Pleistocene gravelly
sand deposits.
Source: Schwab and others (2000)
Pleisgsd.shp Download: geologyshp.zip
Description: Geologic unit showing area of Pleistocene glaciofluvial
sand and gravel reworked into transverse bedforms.
Source: Schwab and others (2000)
Rb_holo.shp Download: geologyshp.zip
Description: Geologic unit showing Raritan Bay Holocene deposits.
Source: Schwab and others (2000)
Remosaic Download: ngdcbathy.zip
Description: Color-coded bathymetry draped over shaded relief. The
shaded relief image was created by vertically exaggerating the topography 100
times and then artificially illuminating the relief by a light source positioned
45 degrees above the horizon from the north. In the resulting image, topographic
features are enhanced by strong illumination on the northward-facing slopes and
by shadows cast on southern slopes. The bathymetric data used to make this image
were compiled from all historical data and gridded at 90 m spatial resolution.
Source: National Oceanic and Atmospheric Administration Coastal Relief
Model.
Reference: www.ngdc.noaa.gov/mgg/coastal/coastal.html
Seaxpics.shp Download: seaxshp.zip
Description: Location of bottom photographs obtained on R/V Seaward Explorer
cruise.
Seaxseds.shp Download: seaxshp.zip
Description: Location of grab samples obtained on R/V Seaward Explorer
cruise.
Seaxstat.shp Download: seaxshp.zip
Description: Link to all pictures on R/V Seaward Explorer cruise.
Seaxvid.shp Download: seaxshp.zip
Description: Video survey tracks on R/V Seaward Explorer cruise.
Title Page / Contents / Software / Introduction / Photo System / Photographs / Movies / Acknowledgments / References / List of Figures
Appendices: I. Bottom Photographs / II. Sea Floor Movies / III. Sediment Texture / IV. ArcView Project / V. Metadata