Photographs of the Sea Floor Offshore of New York and New Jersey, USGS Open-File Report 01-470
Title Page / Contents / Software / Introduction / Photo System / Photographs / Movies / Acknowledgments / References / List of Figures
Appendices: I. Bottom Photographs / II. Sea Floor Movies / III. Sediment Texture / IV. ArcView Project / V. Metadata
Photographs of the Sea Floor Offshore of New York and New Jersey
U.S. Geological Survey Open File
Report 01-470
Bradford Butman, Benjamin T. Gutierrez, Marilyn Buchholtz ten Brink, William C. Schwab,
Dann S. Blackwood, Ellen L. Mecray, and Tammie J. Middleton
Introduction
To view files in PDF format, download free copy of Adobe Acrobat Reader,
(URL: http://www.adobe.com/products/acrobat/alternate.html).
 |
| Figure 1a. Location of bottom photographs obtained in the New York Bight. (PDF format) |
Preliminary descriptions of the sea floor geology in this region may be found in Schwab and others (2000, URL: https://pubs.usgs.gov/of/of00-295/; 2003), Butman and others (1998, URL: https://pubs.usgs.gov/of/of98-616/.), and Butman and others (2002, URL: https://pubs.usgs.gov/of/of00-503/). Schwab and others (2000 URL: https://pubs.usgs.gov/of/of00-295/; 2003) have identified 11 geologic units in New York Bight (Figure 2 (PDF format)). These units identify areas of active sediment transport, extensive anthropogenic influence on the sea floor, and various geologic units. Butman and others (2003) and Harris and others (in press) present the results of a moored array experiment carried out in the Hudson Shelf Valley to investigate the transport of sediments during winter. Summaries of these and other studies may be found at USGS studies in the New York Bight (URL: http://woodshole.er.usgs.gov/project-pages/newyork/).
This DVD-ROM contains digital images of bottom still photographs, images digitized from videos, sediment grain-size analysis results, and short QuickTime movies from video transects. The data are presented in tabular form and in an ESRI (Environmental Systems Research Institute, URL: http://www.esri.com) ArcView project where the image and sample locations may be viewed superimposed on maps showing side-scan sonar and/or multibeam backscatter intensity and bottom topography.
Photographic and Sampling Systems
Bottom photographs and/or video of the sea floor were obtained using several different imaging systems, that are described below for each cruise. Sediment samples were collected either with a Van Veen grab sampler (Figure 3) or a hydrostatically damped gravity corer (Figure 4). Samples obtained with the corer are specified with the letter "C" in the station identification (e.g. 1C1). Grain size of the sediments from the top 2 cm of the Van Veen and from the top 2 cm from the core are presented in this report. The sediments were analyzed for texture using the methods described in Poppe and others (2000) (Appendix III, Excel format).
Seaward Explorer ( USGS cruise SEAX96004)
Sediment samples were obtained with a Van Veen grab sampler that was outfitted with an underwater still camera and color video system (Figure 5). The sediment sampler was equipped with a steel rod tethered to the system that settled into the field of view as the sampler approached the seabed. The rod was 20 cm across and served as a length scale for the photographs.
Alpha & Omega ( USGS cruise ALPH98020)
Samples of the sea floor were made using a hydrostatically damped gravity corer (stations 1C1 to 31C3B) and a Van Veen grab sampler (stations 33G to 142VG). Both systems were fitted with a color video system. However, the video cable was damaged during the early part of the cruise and could not be repaired at sea. Starting at station 42G, a small black and white video camera using a diver flashlight for illumination was installed on the bottom grab sampler. This system provided limited video images of the sea floor. Starting at station 126G1, the lighting was improved by adding a reflector to diffuse the light beam from flashlight.
The images for this cruise were digitized from the videotapes using digital video editing software (Apple Computer´s iMovie2). Selected frames were digitized and saved as .jpg files for each station where there was reasonable quality video.
Oceanus (USGS cruise OCNS9906) and Endeavor ( USGS cruise ENDV00013)
Bottom samples and images were obtained using the SEABed Observation and Sampling System (SEABOSS, Blackwood and Parolski, (2000, URL: http://woodshole.er.usgs.gov/operations/seaboss/seaboss.html)) (Figure 3 and Figure 6). This system obtains 35 mm color photographs, continuous color video from both a downward and a forward looking camera, and a sample of the bottom sediment. At each station, the SEABOSS was lowered to a target elevation about 76 cm (30 inches) above the sea floor. As the ship drifted, typically at a knot or less, bottom video was recorded continuously and individual photographs of the sea floor were triggered remotely based on the video available in real time at the surface. Typically 5-50 still photographs were obtained at each station. At 76 cm above the bottom, the still photographs show a 76 x 51 cm area of the sea floor. The images from Endeavor stations 2025 and 2028 to 2035 were obtained by capturing a still frame from the video. At most stations, a single sample of the sediment was obtained during the transect. However, at some locations, cobbles and boulders on the sea floor made sampling impossible. For the R/V Endeavor cruise, only the downward-looking video camera was available.
Images without navigation and time information stamped on the image were obtained from the still camera system. Images that include navigation and time on the image were acquired by capturing frames from the video.
Viewing the Bottom Photographs (Appendix I, Appendix IV)
Photographs obtained at each station are presented in a station page that contains the station latitude and longitude, thumbnails of the bottom photographs, and the sediment grain size analysis results. The station pages may be accessed and viewed through Appendix I, using ArcView (see Appendix IV), or as individual pages. Appendix I and IV provide maps showing the station locations and are the recommended way to access the station pages. To view a larger image of each photograph, click on the thumbnail in the station page. If pages do not include photographs or sediment texture results, no photographs or sediment samples were obtained at that station.
Using Appendix
I
The
bottom photographs are organized by cruise. To view the station pages go to
Appendix I, click on the cruise number to obtain a table of station pages, then
click on the station number. Click on sub areas of the associated map to view station numbers.
Using ArcView (3.2 or higher)
The bottom photos and movies may be viewed in an ESRI ArcView 3.2 (or higher) project. In the ArcView project, the station locations can be viewed along with shaded relief or backscatter intensity images of part of the New York Bight (obtained from a multibeam sea floor mapping system (Butman and others (1998) and Butman and others (2002)), backscatter intensity from sidescan sonar (Schwab and others, 2003), or with geologic units identified from the sidescan sonar. These images provide some regional geologic context for the bottom photographs and samples. The multibeam images are preliminary (see metadata for description).
To use the ArcView project, open the file nyofr01_470.apr (located in the nybgis directory) with ArcView 3.2 or higher. A dialogue box will appear requesting the path to the 'nybgis/nypages' directory. If you are running the project from the
DVDROM, enter the drive letter of your DVDROM reader (set as D in the pop-up), then click OK. If the project has been copied onto a hard drive, enter the entire pathway to the 'nybgis/nyimage' directory.
The ArcView Spatial Analyst extension must be installed to view the NOAA Coastal Relief Model bathymetry theme (remosaic). The MrSID Image support extension must be loaded to view the sidescan sonar theme (Apex_li.sid) that has been compressed with LizardTech (URL: http://www.lizardtech.com/) MrSID Geospatial Encoder 1.3.1 image compression utility.
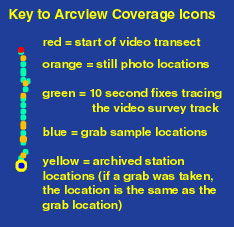 The ArcView project contains five views. View 1 includes all of the station data in this report. Views 2-4 contain the station information for the sampling locations that were occupied on each cruise. In each view, themes (1) show a station location that provides a link to all photographs (themes ny_stat.shp, seaxstat.shp, alphstat.shp, ocnsstat.shp, or endvstat.shp), (2) show the locations of each still photograph (themes ny_pics.shp, seaxpics.shp, alphpics.shp, ocnspics.shp, or endvpics.shp), (3) show the locations of the grab samples (themes ny_seds.shp, seaxseds.shp, alphseds.shp, ocnsseds.shp, or endvseds.shp), (4) show positions every 10 seconds along the video transects (themes ny_vid.shp, seaxvid.shp, alphvid.shp, ocnsvid.shp, or endvvid.shp), and (5) show the start of the large and small video clips ( movs*.shp for the small format movies, and movl*.shp for large-format movies, where * is the ship abbreviation alph, endv, ocns, or seax). The Key to ArcView Coverage Icons figure (right) illustrates the various themes (colors may vary between views). The individual photo locations (ny_pics.shp, seaxpics.shp, alphpics.shp, ocnspics.shp, or endvpics.shp) are not hot-linked, but the images displayed on the station page are in sequential order from the beginning to the end of the transect. Data sources for the ArcView project file are listed in Appendix V.
To view the photographs at a particular station using a hotlink, click on the photos or movies theme to make it active ( *stat.shp for photos, movs*.shp for the small format movies, and movl*.shp for large-format movies, where * is the ship abbreviation alph, endv, ocns, or seax), click on the lightening bolt icon on the toolbar, then click on the desired station marker with the lightening bolt (the bottom tip of the lightening bolt icon must be positioned over the station marker). If a dialogue box pops up with "Hotlink to web/movie failed, check path", click on the P button in the toolbar, check the path to the folder 'nyimage' and change if necessary. If no movie or image pops up there are no images for that station. Double click on an image in the resulting station page to view a larger image.
Using Individual JPEG images
Each
photo is stored as a JPEG file in a folder for each sampling station. The photo
file name is listed below each thumbnail on each station page. In each
station folder (found in the directory "nybgis\nyimage\nypage"), a
web page called "index.htm" will bring up the station page.
Movies of the Sea Floor (Appendix II)
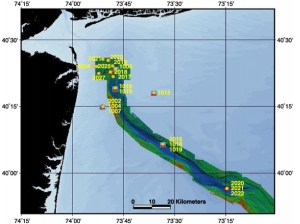 |
Figure 7. Location of video clips obtained in the New York Bight. (PDF format) |
This DVD-ROM
also presents short movies digitized from video transects of the sea floor collected
on OCNS9906 and ENDV00013 (Appendix II). These videos were digitized to produce compressed
QuickTime movies. The movies are also accessible in
the ArcView project file via a hotlink (see Appendix IV). These movies show the
sea floor near USGS mooring sites (Butman and others, 2003) in the Historic Area Remediation
Site (HARS, Butman and others, 2002) and areas at the head of the Hudson Shelf Valley (Butman and others, 1998) (Figure
7 (PDF format)). Within the ArcView project file, the movies can be viewed through
the main view or the views
created for the R/V Oceanus and R/V Endeavor cruises.
The movies were constructed from video clips from sea floor
video tapes collected using the SEABOSS system. The movies were captured
digitally with Apple computer's iMovie2 software using a Digital8 camera via
a FireWire connection. Once captured, specific segments of the video were
chosen and compressed into a QuickTime movie that was optimized for play back
from a DVD-ROM. The Sorenson Developer codec for QuickTime was used to compress
and watermark the movies. The codec was set to encode the movies at 29.97
frames per second with a key frame every 75 frames. The average data rate
was limited to 180 Kb/s or less. The movies are annotated with time, position
(latitude and longitude), station number, and water depth. This information was
printed onto the video while it was recorded to tape at sea.
Acknowledgments
We thank the crews of the F/V Alpha and Omega, R/V Endeavor, R/V Oceanus, and R/V Seaward Explorer for their skillful work at sea. Bill Schwab was chief scientist on the R/V Seaward Explorer cruise, Brad Butman and Marilyn ten Brink were co-chief scientists on the F/V Alpha and Omega cruise, and Brad Butman was chief scientist on the R/V Oceanus and R/V Endeavor cruises. Dann Blackwood led the preparation of the photographic systems and their operation at sea. Ellen Mecray and Marilyn ten Brink and were responsible for the sediment sampling. B. Taylor and D. Walsh did the grain size analyses in the laboratory. Donna Newman, Ben Gutierrez, and Tammie Middleton did the html. Chris Polloni helped to digitize the videos. Jane Denny provided Figure 2 and the metadata for the surficial geologic units included in the ArcView project file. J. Borden, M. Casso, J. Cote, V. Cross, S. Dadisman, W. Danforth, J. Denny, J. Fierra, E. Galvin, E. Haase, C. Harris, J. Hyatt, B. Irwin, T. Komado (Rutgers University), J. Loss, L. Lotto, M. Martini, D. Nichols, T. O'Brien, K. Parolski, J. Reid, R. Rendigs, E. Roworth, S. Shah, P. Traykovski (WHOI), and D. Walsh helped acquire the data at sea.
References
Blackwood, D. B., and Parolski,
K. F., 2000, "Seaboss": an elegantly simple image and sample collecting system
(extended abs.):Proceedings, 6th International Conference on Remote Sensing for
Marine Environments, Veridian ERIM International,Charleston, S.C., v. 1,
p. 99-106. ONLINE at
(URL: http://woodshole.er.usgs.gov/operations/seaboss/seaboss.html).
Butman, B., Danforth, W.W., Schwab, W.C., ten Brink, M.B., 1998, Multibeam Bathymetric and Backscatter Maps of the Upper Hudson Shelf Valley and Adjacent Shelf, Offshore of New York, U.S. Geological Survey Open-File Report, 98-616, 4 sheets. ONLINE at (URL: https://pubs.usgs.gov/of/of98-616/).
Butman, Bradford, Alexander, P.S., Harris, C.K., Lightsom, F.S., Martini, M.A., ten Brink, M.B., and Traykovsky, P.A., 2003, Oceanographic Observations in the Hudson Shelf Valley, December 1999 - April 2000: Data Report. U.S. Geological Survey Open-File Report 02-217. 1 DVD-ROM.
Butman, B., Danforth, W.W., Knowles, S.C., May, B. and Serrett, L., 2002, Sea Floor Topography and Backscatter Intensity of the Historic Area Remediation Site (HARS), Offshore of New York, Based on Multibeam Surveys Conducted in 1996, 1998, and 2000, U.S. Geological Survey Open File Report, 00-503. ONLINE at (URL: https://pubs.usgs.gov/of/of00-503/).
Butman, B., 1998, Mapping the Sea Floor Geology Offshore of the New York - New Jersey Metropolitan Region. U.S. Geological Survey Fact Sheet 133-98. ONLINE at (URL: https://pubs.usgs.gov/fs/fs133-98/).
Harris, C.K, Butman, B., Trakovski, P., in press, Winter-time Circulation and Sediment
Transport in the Hudson Shelf Valley. Submitted to Continental Shelf Research.
Hastings, M.E., Poppe, L.J., and Hathaway, J.C., USGS East-Coast Sediment Database, Chapter 2 in Poppe, L.J. and Polloni, C.F. (eds), 2000, USGS East-Coast Sediment Analysis: Procedures, Database and Georeferenced Displays, U.S. Geological Survey Open-file Report 00-358, 1 DVD-ROM. ONLINE at (URL: https://pubs.usgs.gov/of/of00-358/).
Mecray, E., ten Brink, M.B., and Butman, B., 1999, Contaminants and Marine Geology in the New York Bight: Modern sediment dynamics and a legacy for the future, U.S. Geological Survey Fact Sheet 114-99. ONLINE at (URL: https://pubs.usgs.gov/fs/fs114-99/).
Poppe, L.J., Eliason, A.H., Fredericks, J.J., Rendigs, R.R., Blackwood, D. and Polloni, C.F., Grain-size analysis of marine sediments - methodology and data processing, Chapter 1 in Poppe, L.J. and Polloni, C.F. (eds), 2000, USGS East-Coast Sediment Analysis: Procedures, Database and Georeferenced Displays, U.S. Geological Survey Open-file Report 00-358, 1 DVD-ROM. ONLINE at (URL: https://pubs.usgs.gov/of/of00-358/).
Schwab, W. C. , Denny, J. F., Foster, D.S., Lotto, L.L., Allison, A.L., Uchupi, E., Swift, B.A., Danforth, W.W., Thieler, E.R., and Butman, B., 2003, High-resolution quaternary seismic stratigraphy of the New York Bight Continental Shelf: U.S. Geological Survey Open-File Report 02-152, DVD-ROM. ONLINE at (URL: https://pubs.usgs.gov/of/2002/of02-152/).
Schwab, W.C., Denny, J.F., Butman, B., Danforth, W.W., Foster, D.S., Swift, B.A., Lotto, L.L., Allison, M.A. and Thieler, E.R, 2000, Sea-floor characterization offshore of the New York-New Jersey metropolitan area using sidescan sonar, U.S. Geological Survey Open-File Report 00-295. ONLINE at (URL: https://pubs.usgs.gov/of/of00-295/).
Title Page / Contents / Software / Introduction / Photo System / Photographs / Movies / Acknowledgments / References / List of Figures
Appendices: I. Bottom Photographs / II. Sea Floor Movies / III. Sediment Texture / IV. ArcView Project / V. Metadata