
Hydrologic Conditions and Quality of Rainfall and Storm Runoff in Agricultural and Rangeland Areas in San Patricio County, Texas, 2000-2001
U.S. Geological Survey
Open-File Report 02-291
In
cooperation with the U.S. Department of Agriculture,
Natural Resources Conservation Service;
San Patricio Soil and Water Conservation District; and
The Welder Wildlife Foundation
By Darwin J. Ockerman
You will need Acrobat Reader to read the PDF version of this report. If you do not have Acrobat Reader, you may download it here:
http://www.adobe.com/products/acrobat/readstep2.html
Document Accessibility: Adobe Systems Incorporated has information about PDFs and the visually impaired. This information provides tools to help make PDF files accessible. These tools convert Adobe PDF documents into HTML or ASCII text, which then can be read by a number of common screen-reading programs that synthesize text as audible speech. In addition, an accessible version of Acrobat Reader 5.0 for Windows (English only), which contains support for screen readers, is available. These tools and the accessible reader may be obtained free from Adobe at http://access.adobe.com/.
pdf version of text (609 KB)
jpg version of plate (809 KB)
Rainfall Deposition of Nitrogen
Nutrients, Major Inorganic Ions, and Trace Elements
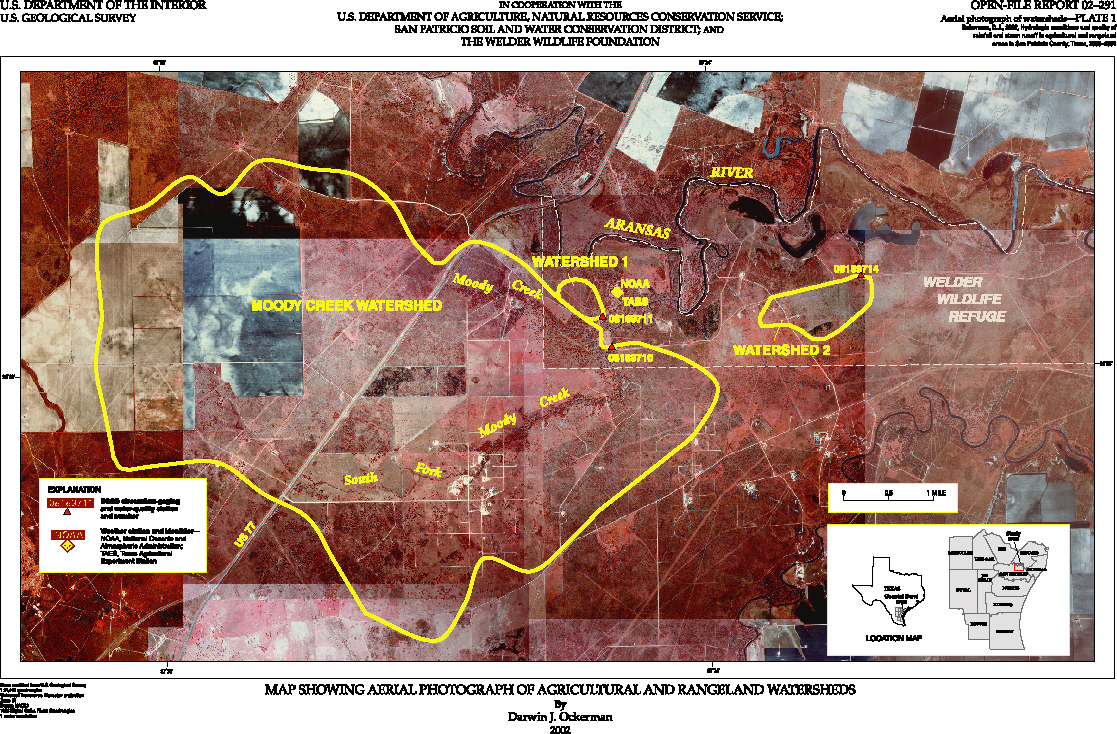
PLATE
1. Map showing aerial photograph of agricultural and rangeland watersheds (11" X 17")
FIGURES
1. Map showing Coastal Bend area of South Texas and study area
2. Hydrograph showing rainfall, discharge, and subsample-collection timing at watershed site 2 during3-5. Graphs showing:
3. Mean
monthly rainfall at National Oceanic and Atmospheric Administration (NOAA)
weather
station,
1965-2001, and monthly study area rainfall, 2000-2001
4. Comparison
of computed and estimated (from regression) total nitrogen deposition for
sampled
rainfall events,
June 2000-August 2001
5. Comparison
of runoff concentrations for selected constituents between mixed agricultural
watershed (Moody
Creek watershed) and rangeland watersheds (watersheds 1 and 2),
2000-2001
TABLES
1. Rainfall, runoff volumes, and runoff coefficients for runoff events, 2000-2001
2. Concentrations of nutrients in rainfall samples, 2000-2001
3. Summary statistics of selected nutrient concentrations in rainfall samples, 2000-2001
4. Event-mean concentrations for selected properties and constituents in runoff samples, 2000-2001
5. Summary statistics of
event-mean concentrations for selected constituents in runoff samples,
2000-2001
6. Densities of bacteria in runoff samples, 2000-2001
7. Summary statistics of bacteria densities in combined runoff samples, 2000-2001
8. Monthly and annual loads of selected constituents in runoff, 2000-2001
| AccessibilityFOIAPrivacyPolicies and Notices | |
 |
|