Geologic Variables
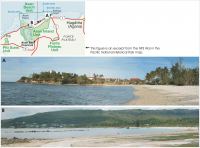 |
| Figure 3. Photos of geomorphic features within the Asan Beach Unit of War in the Pacific NHP. Click on figure for larger image. |
| 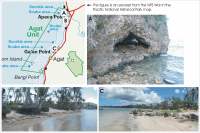 |
| Figure 4. Photos of geomorphic features within the Agat Unit of War in the Pacific NHP. Click on figure for larger image. |
|
The geomorphology variable expresses the relative erodibility of different landform types (Table 1). These data were derived using the 2002-2003 IKONOS imagery provided by the Pacific Islands GIS Project and NOAA/NOS (http://www.csc.noaa.gov/islandsgis/resources.html). In addition, field visits were made within accessible locations of the park to verify the geomorphologic classification (Figure 3 A-B and Figure 4 A-C). War in the Pacific NHP consists of geomorphology types, that include high vulnerability rubble to rocky shoreline skirted by fringing reef and very high vulnerability sand beaches with fringing reef (Figure 5).
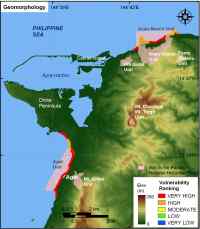 |
| Figure 5. Coastal geomorphology for War in the Pacific NHP. Click on figure for larger image. |
| 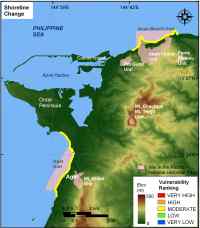 |
| Figure 6. Shoreline change rates for War in the Pacific NHP. Click on figure for larger image. |
|
Shoreline erosion and accretion rates for War in the Pacific NHP were calculated using digitized shorelines from 1966 and 2002/2003 (Table 2). Shoreline rates of change (m/yr) were calculated at 50 m intervals (transects) along the coast using Digital Shoreline Analysis System (DSAS) software (http://woodshole.er.usgs.gov/project-pages/dsas/) to derive the rate of shoreline change. The change rates for each transect within each grid cell were averaged to determine the shoreline change value used here, with positive numbers indicating accretion and negative numbers indicating erosion. Shoreline change rates within the park are all in the moderate vulnerability category, which is between -1 m/yr and +1 m/yr. The rocky portions of the shoreline have not changed since 1966, There has been some erosion along Asan Beach and other sandy areas, although rates still lie within +/- 1 m/yr (Figure 6).
 |
| Figure 7. Regional coastal slope for War in the Pacific NHP. Click on figure for larger image. |
Regional coastal slope is an indication of the relative vulnerability to inundation and the potential rapidity of shoreline retreat because low-sloping coastal regions should retreat faster than steeper regions (Pilkey and Davis, 1987). The regional slope of the coastal zone was calculated from a grid of topographic and bathymetric elevations extending 2 km landward and seaward of the shoreline. Elevation data were obtained from the National Geophysical Data Center (NGDC) as gridded topographic and bathymetric elevations at 0.1-meter vertical resolution for 1-minute grid cells. These data were supplemented with DEM data from NOAA's Biogeography Program and SHOALS (Scanning Hydrographic Operational Airborne Lidar Survey) data (Table 2). Regional coastal slopes for War in the Pacific National Historical Park fall within the very low to very high vulnerability category (< 4.55% - > 14.7%) (Figure 7).
Back to Top