USGS Open-File Report 2005-1231
The comparison histograms of potassium, uranium, and thorium for the results of the classification of the data provide pairs of histograms that facilitate comparison of the classes. This section discusses bi-histograms of selected groups of classes. The classes chosen were selected to help determine whether the classes are geologically different. The choices were based upon examination of the table of means and standard deviations, the graph of the means and standard deviations, the three-dimensional graphs of the means, and the statistical graphs. At strategic points within this section, links to subsections are provided to facilitate navigation within this section.
For each group of classes, the histograms are presented in matrix form. The horizontal scales of the individual graphs in each matrix are identical for the concentrations of potassium, uranium, and thorium, respectively. The vertical axis scales represent the relative frequency of the classes and are variable for clarity of visual representation. In some cases, the bins used to calculate the histograms also vary from graph to graph.
The comparisons presented in this section were selected on the basis of apparent correlations between classes and landscape and geologic features. One of the groups was chosen because the classes appear to be related to the presence of water. Other groups were chosen because they appeared related to the Goliad Formation, Beaumont Formation, Lissie Formation and sand dunes, and the Holocene floodplain deposits of the Rio Grande.
Classes that appear related to the presence of water are R02, R12, R18, R19, and R20. Figure H1 shows the histograms for potassium. Figure H2 shows the histograms for uranium and Figure H3 shows the histograms for thorium. In all cases the concentrations of potassium, uranium, and thorium for class R12 are less than the concentrations of the other classes in this group.
For class R02, the potassium distribution largely overlaps the distributions of classes R18, R19, and R20 but does not overlap that of R12. The uranium distribution of R02 overlaps those of classes R18 and R20, has little overlap with the uranium distribution of class R19, and has no overlap with that of class R12. An examination of the classification map and the geologic map indicates that class R02 occurs almost exclusively in areas mapped as recent floodplain deposits (Qas and Qam). Grid cells classified as R02 also often occur around areas classified as R12.
For class R12, the potassium , uranium, and thorium distributions exhibit little overlap with the corresponding distributions of the other classes in this group. A comparison of the classification map with the locations of ponds and lakes clearly shows that class R12 is a robust indicator of the presence of water. A close examination of the classification map also shows that the other classes in this group often occur around areas classified as R12.
For class R18, the potassium distribution overlaps that of class R02, does not overlap that of R12, and exhibits some overlap with classes R19 and R20. The uranium distribution of R18 overlaps the uranium distributions of classes R02 and R20, does not overlap that of R12, and shows some overlap with R19. For class R18, the thorium distribution overlaps that of class R02, does not overlap that of R12, and exhibits some overlap with classes R19 and R20. An examination of the classification map and the geologic map shows that class R18 occurs almost exclusively in areas mapped as recent floodplain deposits (Qas and Qam).
For class R19, the potassium distribution overlaps the potassium distributions of classes R02 and R20, does not overlap that of R12, and exhibits some overlap with class R19. The uranium distribution of R19 exhibits some overlap with the uranium distributions of all of the other classes in this group. The thorium distribution of R19 overlaps that of class R20 but has relatively little overlap with the thorium distributions of classes R02, R12, and R18. Comparison of the classification map and the geologic map shows that class R19 occurs mostly in areas mapped as members of the Beaumont Formation (Qb, Qbf, Qbm). Examination of the map showing areas where the survey aircraft flew at effective altitudes greater than 200 m reveals that many of the grid cells classified as class R19 occur in those areas.
For class R20, the potassium distribution overlaps the potassium distributions of classes R02 and R19, has little overlap with that of R12, and exhibits some overlap with class R18. The uranium distribution of R20 overlaps the uranium distributions of classes R02 and R18, does not overlap that of R12, and shows some overlap with R19. The thorium distribution of R20 overlaps that of class R19, has relatively little overlap with the thorium distribution of class R12, and exhibits some overlap with R18 and R02. Comparison of the classification map and the geologic map shows that class R20 occurs mostly in areas mapped as members of the Beaumont Formation (Qb, Qbf, Qbm). Examination of the map showing areas where the survey aircraft flew at effective altitudes greater than 200 m reveals that many of the grid cells classified as class R20 occur in those areas.
One conclusion that can be drawn from these comparisons is that class R12 is very distinct and the geographical correlation with the locations of known bodies of water indicates that class R12 is a robust indicator of water. The fact that the other classes often occur around areas of R12 is probably an indication that those particular grid cells include the influence of the water of the water on the measurements. Detailed examinations of relatively large areas classified as class R12 show that the classes included in this comparison are not uniquely associated with R12 and that many of the other classes sometimes occur around areas of R12. Figure H4 shows an example where an area of R12 is surrounded by grid cells that are classified as many different classes. This result suggests that any occurrence of a variety of apparently unrelated classes may be an indication of the presence of water or possibly of soils with higher water contents.
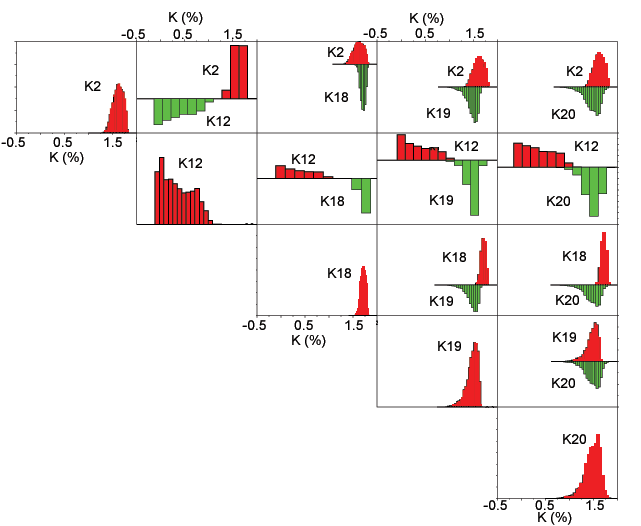
Figure H1. Matrix of potassium bi-histograms for classes related to water. The number denotes the class (refer to the classification map).
[Figure H1] [Figure H2] [Figure H3] [Figure H4]
[Water related][Goliad Formation][Lissie Formation or dune sand][Beaumont Formation][Rio Grande floodplain]
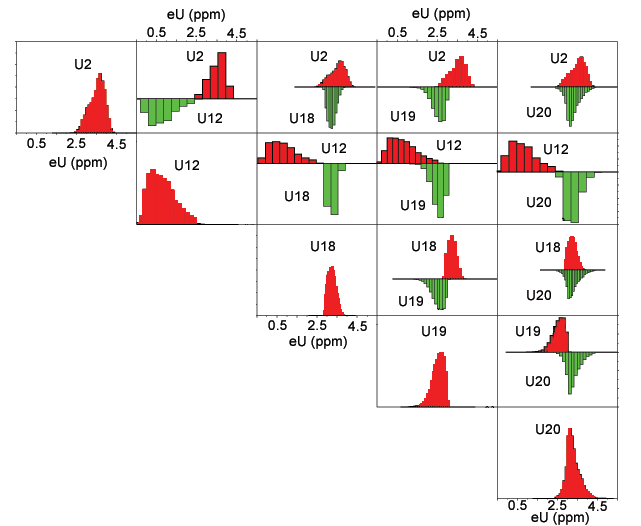
Figure H2. Matrix of uranium bi-histograms for classes related to water. The number denotes the class (refer to the classification map).
[Figure H1] [Figure H2] [Figure H3] [Figure H4]
[Water related][Goliad Formation][Lissie Formation or dune sand][Beaumont Formation][Rio Grande floodplain]
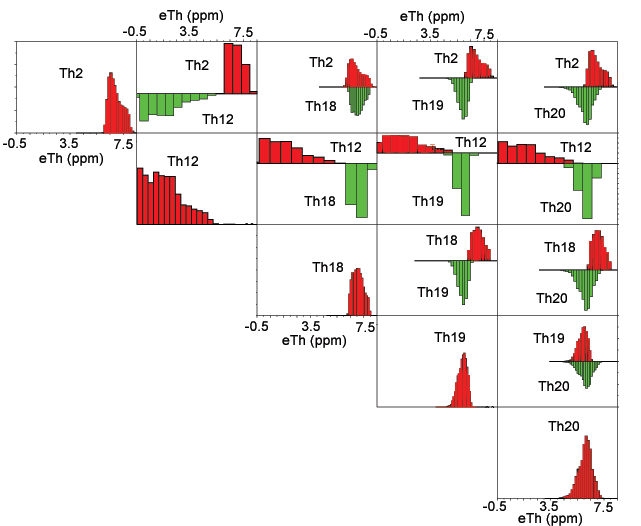
Figure H3. Matrix of thorium bi-histograms for classes related to water. The number denotes the class (refer to the classification map).
[Figure H1] [Figure H2] [Figure H3] [Figure H4]
[Water related][Goliad Formation][Lissie Formation or dune sand][Beaumont Formation][Rio Grande floodplain]
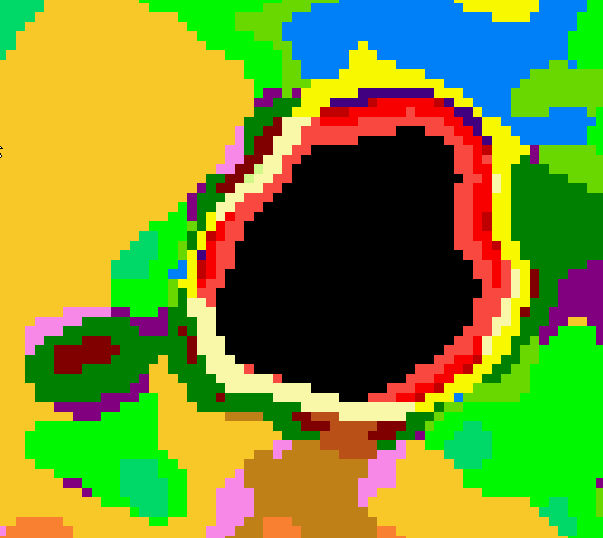
Figure H4. Detailed area showing an area of class R12 surrounded by grid cells assigned to a variety of different classes.
[Figure H1] [Figure H2] [Figure H3] [Figure H4]
[Water related][Goliad Formation][Lissie Formation or dune sand][Beaumont Formation][Rio Grande floodplain]
This section discusses a group of classes selected because they appear to be related to the Goliad Formation. Figure H5 shows a matrix of potassium histograms comparing classes R04, R14, R16, and R17. Figure H6 shows a matrix of the uranium histograms and figure H7 shows a matrix of the thorium histograms.
For class R04, the potassium distribution largely overlaps that of class R17, has some overlap with class R14, and has little overlap with the potassium distribution of class R16. The uranium distribution of class R04 largely overlap the uranium distributions of classes R14, R16, and R17. The thorium distribution of R04 has a small bimodal component that has much higher concentrations of thorium than most of the grid cells in this class. The thorium distribution of R04 exhibits some overlap with all of the other classes in this group but the mean values are distinct (see table of mean values). The mean values of all three elements for class R04 are less that the mean values for classes R14, R16, and R17. Comparison of the classification map and the geologic map indicates that class R04 occurs almost exclusively in areas mapped as Goliad Formation. The Goliad Formation is known to contain caliche (Weeks, 1945) and one possibility is that areas identified as class R04 have greater amounts of calcium carbonate in the soil than areas identified as classes R14, R16, and R17. Because calcium carbonate contains very low amounts of the radioactive elements, its presence would cause a reduction in the concentrations of the radioactive elements compared to the same soil without the calcium carbonate. Because the energies of the gamma rays emitted by the radioactive elements and used to estimate their concentrations are similar (1.46 Mev for K40, 1.76 Mev for Bi214of the U238 decay series, and 2.64 Mev for Tl208 of the Th232 decay series), the attenuation of the gamma rays by the calcium carbonate should result in similar percentage reductions in the apparent concentrations. Ratios of the mean values indicate that this is approximately true for classes R14 and R16 but not true for R17.
For class R14, the potassium histogram somewhat overlaps the distributions of the other classes in this group. The mean potassium concentration of R14 is greater than the mean concentrations of classes R04 and R17 but less than that of R16. The uranium distribution of R14 largely overlaps the uranium distributions of the other classes in this group. The thorium distribution of R14 somewhat overlaps that of class R04 and largely overlaps the thorium distributions of classes R16 and R17.
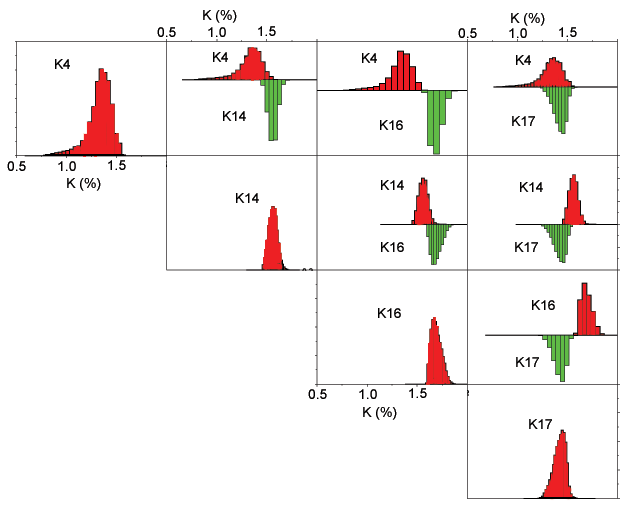
Figure H5. Matrix of potassium bi-histograms for classes related to the Goliad Formation. The number denotes the class (refer to the classification map).
[Figure H5] [Figure H6] [Figure H7]
[Water related][Goliad Formation][Lissie Formation or dune sand][Beaumont Formation][Rio Grande floodplain]
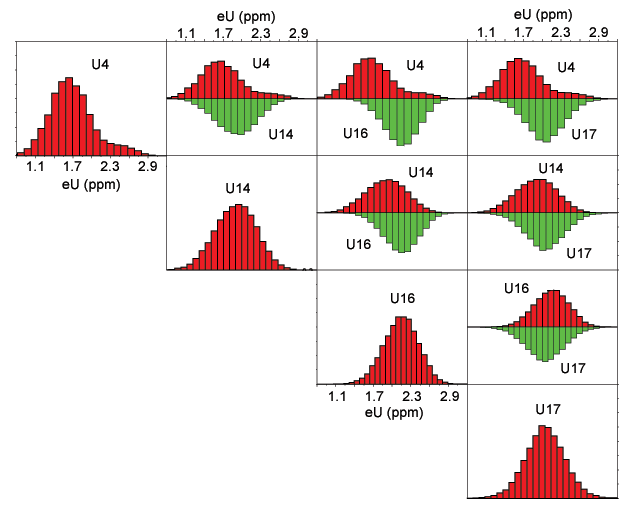
Figure H6. Matrix of uranium bi-histograms for classes related to the Goliad Formation. The number denotes the class (refer to the classification map).
[Figure H5] [Figure H6] [Figure H7]
[Water related][Goliad Formation][Lissie Formation or dune sand][Beaumont Formation][Rio Grande floodplain]
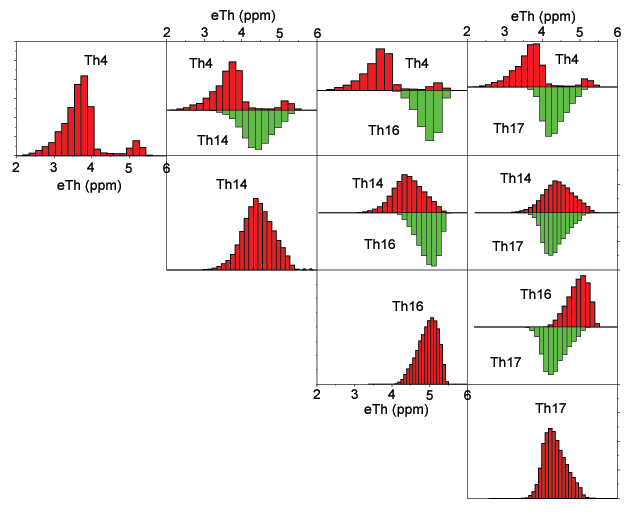
Figure H7. Matrix of thorium bi-histograms for classes related to the Goliad Formation. The number denotes the class (refer to the classification map).
[Figure H5] [Figure H6] [Figure H7]
[Water related][Goliad Formation][Lissie Formation or dune sand][Beaumont Formation][Rio Grande floodplain]
This section discusses a group of classes selected because they appear to be related to the Beaumont Formation. Figure H8 shows a matrix of potassium histograms comparing classes R01, R03, R06, R08, and R11. Figure H9 shows a matrix of the uranium histograms and figure H10 shows a matrix of the thorium histograms.
For class R01, the potassium distribution overlaps that of R03 but has little or no overlap with classes R06, R08, or R11. The uranium distribution of R01 overlaps the uranium distributions of all of the other classes in this group. The thorium distribution of R01 overlaps the thorium distributions of the other classes in this group and may have a bimodal component. The geographical distribution of R01 (see the classification map) is limited and mostly occurs in association with and adjacent to areas of R03. Comparison of the classification map and the geologic map shows that approximately half of the grid cells classified as R01 occur in the general vicinity of areas mapped as the clay and mud member (Qbm) of the Beaumont Formation although only 16 percent of R01 occurs within areas mapped as Qbm (see Table 1 of geology comparisons).
For class R03, the potassium distribution overlaps that of R01 and R11 but has little or no overlap with classes R06 and R08. The uranium distribution of R03 overlaps the uranium distributions of all of the other classes in this group and has a small bimodal component. The thorium distribution of R03 overlaps the thorium distributions of the other classes in this group and is bimodal. The geographical distribution of R03 (see the classification map) is limited and mostly occurs in association with and adjacent to areas of R01 and R11. Comparison of the classification map and the geologic map shows that approximately half of the grid cells classified as R03 occur in the general vicinity of areas mapped as the clay and mud member (Qbm) of the Beaumont Formation although only 17 percent of R03 occurs within areas mapped as Qbm (see Table 1 of geology comparisons).
For class R06, the potassium distribution somewhat overlaps that of R08 but has no overlap with classes R01, R03, or R11. The uranium distribution of R06 overlaps the uranium distributions of all of the other classes in this group. The thorium distribution of R06 overlaps the thorium distributions of classes R01, R03, and R06 but has relatively little overlap with that of R11. Class R06 occurs mostly in the eastern part of the survey area (see the classification map) and about 68 percent of the class occurs within areas mapped either as undivided Beaumont Formation (Qb) or as floodplain deposits of the Beaumont Formation (Qbf) (refer to the geologic map and Table 1 of geology comparisons).
For class R08, the potassium distribution has relatively overlap with the potassium distributions of the other classes in this group. The uranium distribution of R08 overlaps the uranium distributions of the other classes in this group. Similarly, the thorium distribution of R08 overlaps the thorium distributions of the other classes in this group. About 50 percent of R08 occurs within areas mapped as members of the Beaumont Formation and about 32 percent within areas mapped as dune sands (Qds) (refer to the geologic map and Table 1 of geology comparisons).
For class R11, the potassium distribution overlaps that of R03 but has relatively little overlap with the potassium distributions of the other classes in this group. The uranium distribution of R11 overlaps the uranium distributions of the other classes in this group. The thorium distribution of R11 overlaps the thorium distributions of classes R01, R03, and R08 but has relatively little overlap with that of R06. The geographical distribution of R11 (see the classification map) is limited and often occurs in association with and adjacent to areas of R01 and R03. Comparison of the classification map and the geologic map shows that most of the grid cells classified as R11 occur in the general vicinity of areas mapped as the clay and mud member (Qbm) of the Beaumont Formation although only 17 percent of R11 occurs within areas mapped as Qbm (see Table 1 of geology comparisons).
Overall, the association of the classes in this group with the Beaumont Formation is robust. Classes R01, R03, R06, R08, and R11 together account for about 89 percent of the areas mapped as undivided Beaumont Formation (Qb), about 72 percent of areas mapped as floodplain deposits (Qbf), and about 57 percent of areas mapped as clay and mud deposits (Qbm) (refer to Table 1 of geology comparisons).
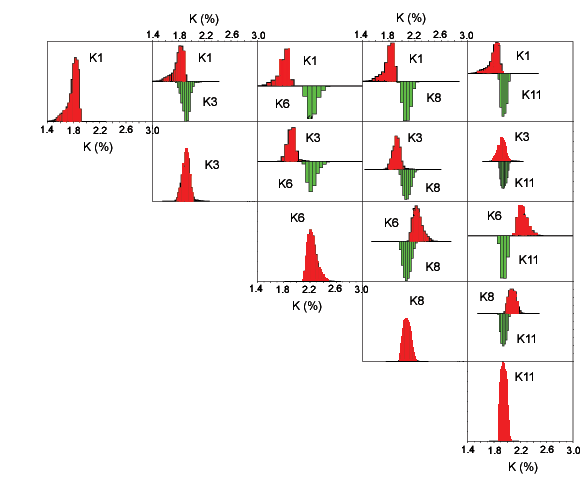
Figure H8. Matrix of potassium bi-histograms for classes related to the Beaumont Formation. The number denotes the class (refer to the classification map).
[Figure H8][Figure H9][Figure H10]
[Water related][Goliad Formation][Lissie Formation or dune sand][Beaumont Formation][Rio Grande floodplain]
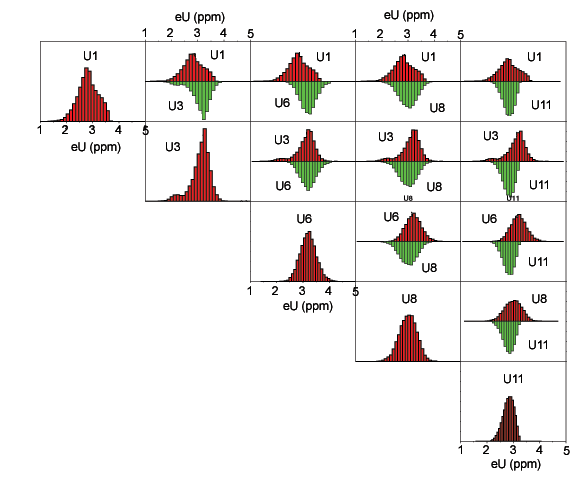
Figure H9. Matrix of uranium bi-histograms for classes related to the Beaumont Formation. The number denotes the class (refer to the classification map).
[Figure H8][Figure H9][Figure H10]
[Water related][Goliad Formation][Lissie Formation or dune sand][Beaumont Formation][Rio Grande floodplain]
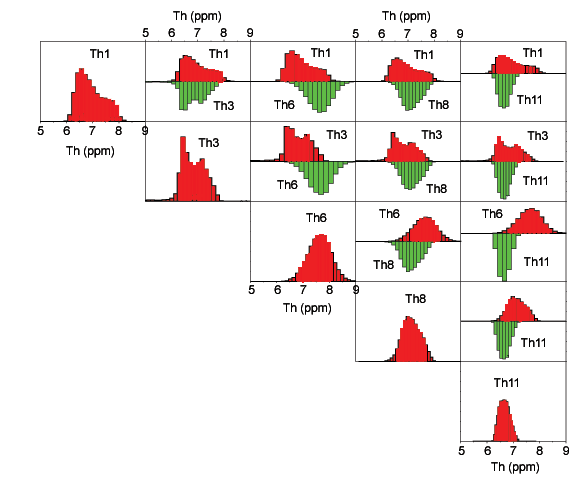
Figure H10. Matrix of thorium bi-histograms for classes related to the Beaumont Formation. The number denotes the class (refer to the classification map).
[Figure H8][Figure H9][Figure H10]
[Water related][Goliad Formation][Lissie Formation or dune sand][Beaumont Formation][Rio Grande floodplain]
This section discusses a group of classes selected because they appear to be related to Holocen floodplain deposits of the Rio Grande (Qam and Qas). Figure H11 shows a matrix of potassium histograms comparing classes R02, R07, R09, R15, and R21. Figure H12 shows a matrix of the uranium histograms and figure H13 shows a matrix of the thorium histograms.
For class R02, the potassium distribution overlaps the potassium distributions of classes R07 and R15 but has little or no overlap with classes R09, R10, or R21. The uranium distribution of R02 overlaps the uranium distributions of all of the other classes in this group. The thorium distribution of R02 has little or no overlap with the thorium distributions of the other classes in this group. The geographical distribution of R02 (see the classification map) is limited and about 42 percent of the class occurs in areas mapped as muddy floodplain deposits (Qam) and about 49 percent in areas mapped as sandy floodplain deposits (Qas) (see Table 1 of geology comparisons).
For class R07, the potassium distribution overlaps that of class R02, does not overlap that of R10, and exhibits some overlap with the potassium distributions of classes R09, R15, and R21. The uranium distribution of R07 overlaps the uranium distributions of all of the other classes in this group. The thorium distribution of R07 overlaps the thorium distribution of classes R10, R15, and R21, has little overlap with the thorium distribution o fR02, and has some overlap with that of R09. Class R07 is broadly distributed along the floodplain of the Rio Grande (see the classification map) and about 59 percent of the class occurs in areas mapped as muddy floodplain deposits (Qam) and about 39 percent in areas mapped as sandy floodplain deposits (Qas) (see Table 1 of geology comparisons).
For class R09, the potassium distribution overlaps that of class R21, has little overlap with that of R15, and exhibits some overlap with the potassium distributions of classes R02, R07, and R10. The uranium distribution of R09 overlaps the uranium distributions of all of the other classes in this group. The thorium distribution of R09 overlaps the thorium distribution of classes R07, R10, R15, and R21 but does not overlap the thorium distribution of R02. Class R09 is distributed along the floodplain of the Rio Grande (see the classification map) and about 61 percent of the class occurs in areas mapped as muddy floodplain deposits (Qam) and about 39 percent in areas mapped as sandy floodplain deposits (Qas) (see Table 1 of geology comparisons).
For class R10, the potassium distribution overlaps the potassium distributions of classes R09 and R21 but has little overlap with the potassium distributions of the other classes in this group. The uranium distribution of R10 overlaps the uranium distributions of all of the other classes in this group. The thorium distribution of R10 overlaps the thorium distributions of the other classes in this group except class R02 with which there is little overlap. Class R10 is scattered along the floodplain of the Rio Grande (see the classification map) and about 38 percent of the class occurs in areas mapped as muddy floodplain deposits (Qam) and about 52 percent in areas mapped as sandy floodplain deposits (Qas) (see Table 1 of geology comparisons).
For class R15, the potassium distribution overlaps the potassium distributions of class R02, has some overlap with that of R07, but has little or no overlap with the potassium distributions of R09, R10, and R21. The uranium distribution of R15 overlaps the uranium distributions of all of the other classes in this group. The thorium distribution of R15 overlaps the thorium distribution of classes R07, R09, R10, and R21 but has little overlap with the thorium distribution of R02. Class R15 is widely scattered along the floodplain of the Rio Grande (see the classification map) and much of it occurs as small isolated areas that are embedded within areas of class R07. About 66 percent of the class occurs in areas mapped as muddy floodplain deposits (Qam) and about 32 percent in areas mapped as sandy floodplain deposits (Qas) (see Table 1 of geology comparisons).
For class R21, the potassium distribution overlaps the potassium distributions of classes R07, R09, and R10 but has little overlap with the potassium distributions of R02 and R15. The uranium distribution of R21 overlaps the uranium distributions of all of the other classes in this group. The thorium distribution of R21 overlaps the thorium distributions of all of the other classes in this group. Class R21 is distributed along the proximal floodplain of the Rio Grande (see the classification map). About 34 percent of the class occurs in areas mapped as muddy floodplain deposits (Qam) and about 62 percent in areas mapped as sandy floodplain deposits (Qas) (see Table 1 of geology comparisons).
Overall, classes R02, R07, R09, R10, R15, and R21 are robust indicators of Holocene floodplain deposits of the Rio Grande. These classes together account for about 79 percent of the areas mapped as Qam and about 76 percent of the areas mapped as Qas (refer to Table 1 of geology comparisons).
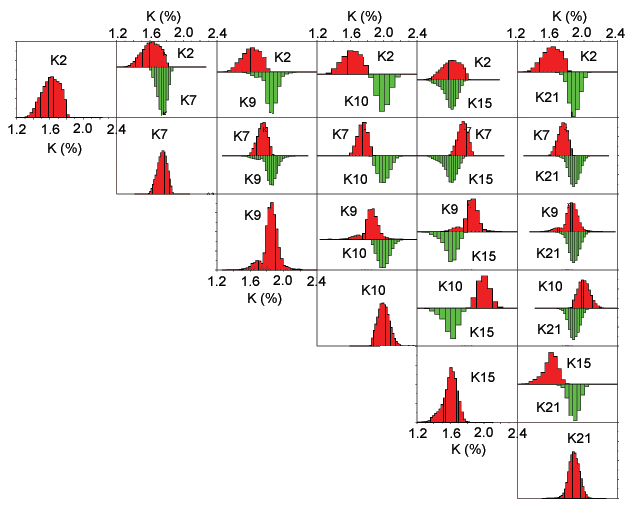
Figure H11. Matrix of potassium bi-histograms for classes related to Holocene floodplain deposits of the Rio Grande. The number denotes the class (refer to the classification map).
[Figure H11][Figure H12][Figure H13]
[Water related][Goliad Formation][Lissie Formation or dune sand][Beaumont Formation][Rio Grande floodplain]
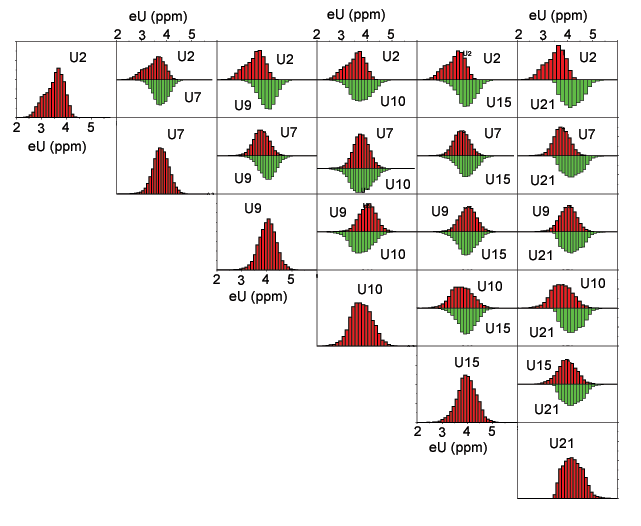
Figure H12. Matrix of uranium bi-histograms for classes related to Holocene floodplain deposits of the Rio Grande. The number denotes the class (refer to the classification map).
[Figure H11][Figure H12][Figure H13]
[Water related][Goliad Formation][Lissie Formation or dune sand][Beaumont Formation][Rio Grande floodplain]
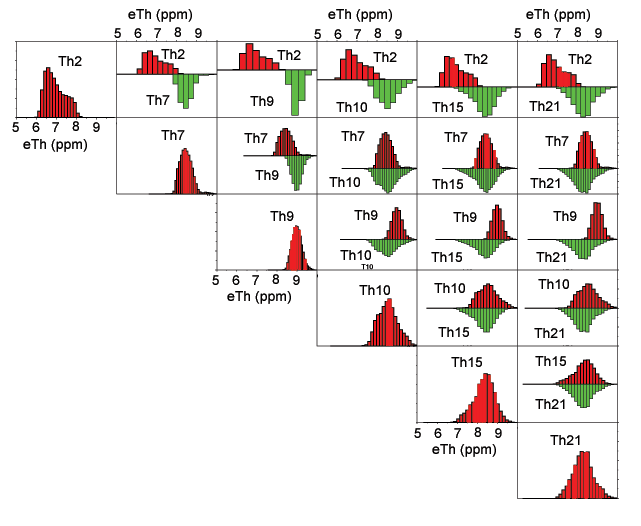
Figure H13. Matrix of thorium bi-histograms for classes related to Holocene floodplain deposits of the Rio Grande. The number denotes the class (refer to the classification map).
[Figure H11][Figure H12][Figure H13]
[Water related][Goliad Formation][Lissie Formation or dune sand][Beaumont Formation][Rio Grande floodplain]
This section discusses a group of classes selected because they might be related to the Lissie Formation (Ql) or dune sand deposits (Qds). Figure H14 shows a matrix of potassium distributions comparing classes R05, R11, R13, and R16. Figure H15 shows a matrix of the uranium histograms and figure H16 shows a matrix of the thorium histograms.
For class R05, the potassium distribution overlaps that of class R16 but has little overlap with the potassium distributions of classes R11 and R13. The uranium distribution of class R05 overlaps the uranium distributions of all of the other classes in this group. The thorium distribution of R05 overlaps that of R11, has some overlap with the thorium distribution of class R13, and does not overlap that of R16. Class R05 occurs in relatively large areas throughout much of the middle part of the survey area and frequently has class R13 adjacent to it or embedded within it (refer to the classification map). About 37 percent of the class occurs in areas mapped as dune sands (Qds), about 22 percent as Lissie Formation, and about 28 percent in areas mapped as Goliad Formation (see Table 1 of geology comparisons).
For class R11, the potassium distribution overlaps that of class R13 but has little overlap with the potassium distributions of classes R05 and R16. The uranium distribution of class R11 overlaps the uranium distributions of all of the other classes in this group. The thorium distribution of R11 overlaps that of R05, has some overlap with the thorium distribution of class R13, and does not overlap that of R16. Class R11 occurs in relatively small areas and is widely distributed across much of the survey area. It is sometimes associated with class R13 but is more commonly associated with classes R01, R03, and R08 (refer to the classification map). About 43 percent of the class occurs in areas mapped as dune sands (Qds), about 14 percent in areas mapped as Beaumont floodplain deposits (Qbf), about 17 percent in areas mapped as clay and mud deposits of the Beaumont Formation (Qbm), and about 16 percent in areas mapped as Lissie Formation (Ql) (see Table 1 of geology comparisons).
For class R13, the potassium distribution overlaps that of class R11 but has little overlap with the potassium distributions of classes R05 and R16. The uranium distribution of class R13 overlaps the uranium distributions of all of the other classes in this group. The thorium distribution of R13 exhibits some overlap with the thorium distributions of classes R05 and R11 but has little overlap with that of R16. Class R13 is widely scattered throughout much of the middle part of the survey area but does not have any patterns that are particularly consistent with any of the mapped geologic units. Much of an area mapped as dune sand in Cameron county on the eastern side of the survey area is classified as R13. About 59 percent of class R13 occurs in areas mapped as dune sands and about 17 percent in areas mapped as Lissie Formation (see Table 1 of geology comparisons).
For class R16, the potassium distribution overlaps that of class R05 but has little overlap with the potassium distributions of classes R11 and R13. The uranium distribution of class R16 overlaps the uranium distributions of all of the other classes in this group. The thorium distribution of R16 has little overlap with the thorium distributions of the other classes in this group. Class R16 occurs mostly in the northern part of the survey area with small areas scattered elsewhere. About 79 percent of class R16 occurs in areas mapped as Goliad Formation (Tg), about 8 percent in areas mapped as dune sand (Qds), and about 13 percent in areas mapped as Lissie Formation (Ql) (see Table 1 of geology comparisons).
All together these four classes only account for about 53 percent of areas mapped as dune sand and about 61 percent of areas mapped as Lissie Formation. Class R05 by itself accounts for about 25 percent of areas mapped as Qds and about 35 percent of areas mapped as Lissie Formation (refer to Table 1 of geology comparisons).
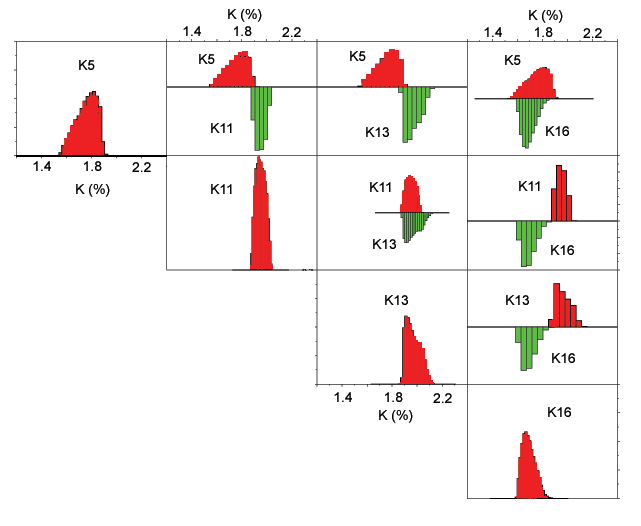
Figure H14. Matrix of potassium bi-histograms for classes related to Lissie Formation or sand dunes. The number denotes the class (refer to the classification map).
[Figure H14][Figure H15][Figure H16]
[Water related][Goliad Formation][Lissie Formation or dune sand][Beaumont Formation][Rio Grande floodplain]
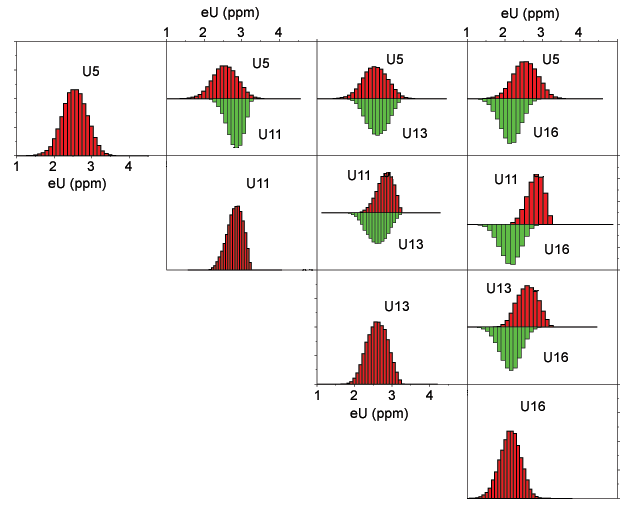
Figure H15. Matrix of uranium bi-histograms for classes related to Lissie Formation or sand dunes. The number denotes the class (refer to the classification map).
[Figure H14][Figure H15][Figure H16]
[Water related][Goliad Formation][Lissie Formation or dune sand][Beaumont Formation][Rio Grande floodplain]
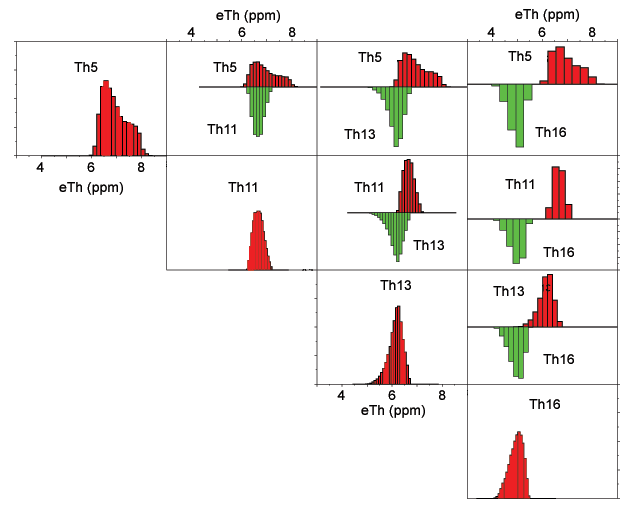
Figure H16. Matrix of thorium bi-histograms for classes related to Lissie Formation or sand dunes. The number denotes the class (refer to the classification map).
[Figure H14][Figure H15][Figure H16]
[Water related][Goliad Formation][Lissie Formation or dune sand][Beaumont Formation][Rio Grande floodplain]
![]() Statistical Graphs | Conclusions
Statistical Graphs | Conclusions ![]()

![]() U.S. Department of the Interior |
U.S. Geological Survey
U.S. Department of the Interior |
U.S. Geological Survey
URL: http://pubsdata.usgs.gov/pubs/of/2005/1231/discbihist.htm
Page Contact Information: Stephen Snyder
Page Last Modified: Saturday, 12-Jan-2013 21:27:50 EST