|
Throughout the marine environment, organic matter delivered and incorporated into marine sediments is efficiently metabolized. Typically, well in excess of 90% of the organic matter raining to the seafloor is remineralized. In the open ocean oxygen is the primary oxidant used, accounting for about 90% of organic matter metabolism (Jahnke and Jackson, 1992). In coastal environments other oxidants (NO3-, Mn-oxides, Fe-oxides, SO4=), can be responsible for a substantial fraction of the oxidation of organic matter, but because of the reaction of oxygen with the reduced products of "sub-oxic" remineralization, oxygen fluxes still provide a good measure of the integrated organic matter oxidation rate (Canfield and others, 1993). Increased deposition of metabolizable organic matter must lead to an increase in oxidation rate. Where a large proportion of organic matter deposited in sediments is oxidized, an increase in the rate of organic matter deposition results in a similar increase in the oxidation rate (at steady state). The oxidation of organic matter in sediments results in a redox zonation of the sediments with depth that reflects the sequence in which the various oxidants are used to remineralize the organic matter. The sequence is everywhere similar, with only the length scales of the zonation varying in response to organic matter deposition rates. This zonation is of great importance to the fate of metals deposited in the sediments, as redox changes alter the partitioning between solid phases and the interstitial waters (see Martin section on metal recycling). The importance of O2 penetration to the fate of metals in the sediments makes the depth at which O2 is exhausted, the O2=0 depth, a critical redox boundary. The depth of O2 penetration in sediments is related to organic matter deposition rate, the rate at which it is metabolized (Cai and Sayles, 1996), and bottom water O2 concentration. Hence, changes in organic matter deposition can be expected to change the O2 penetration depth.
Sediment O2 Profiles in Massachusetts Bay
The importance of oxygen to both organic matter oxidation and sedimentary metal cycles led to the development of a program to characterize O2 profiles in the sediments of Massachusetts Bay. The expected responses of sedimentary O2 profiles and fluxes to changes in the deposition rate of metabolizable organic matter provides an opportunity to investigate the possible impact of sewage effluent discharge in sediments near the new Massachusetts Bay outfall. The hypothesis is that enhanced deposition of metabolizable organic matter, if it occurs, will alter the sediment O2 profiles and fluxes. To this end studies were undertaken at a site (USGS Station 3, Figure 7.1) characterized by fine-grained sediment where organic matter is most likely to accumulate. The studies began in September 1995 and have continued to the present. With few exceptions, three cruises per year were carried out, one each in February-March, May-June, and September-October to provide a seasonal perspective to the data collected.
Sediment O2 profiles were determined in situ with polarographic oxygen electrodes mounted on a profiler described by Sayles and others (1996). The approach is similar to that developed by Revsbech and others (1980). This instrument is a small tripod (Figure 8.1) that is lowered to the seafloor, cast loose from the ship so other activities can be pursued, and retrieved after completion of its preset program (~45 minutes). The profiler uses three electrodes to simultaneously collect three profiles on each deployment. The depth increments for the profiles in Massachusetts Bay were 0.54 mm near the interface, increasing to 1. 08 mm after 47 steps. Two deployments on each cruise were planned but not always achieved.
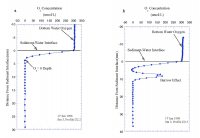
Figure 8.2a illustrates the typical distribution of O2 with depth at the study site. As illustrated here, O2 is rapidly exhausted below the sediment-water interface, rarely penetrating below 10 mm and typically reaching O2=0 at 3 to 6 mm. Figure 8.2b illustrates a complication caused by the activities of burrowing organisms on the distribution of O2 in the sediment. The rapid increase in O2 below an O2=0 depth of 4.5 mm is indicative of the advection of O2 into the sediment by biological activity. Less than 10% of the profiles exhibited similar perturbations; these profiles were not used in the determinations of O2=0 or O2 fluxes. The two profiles of Figure 8.2 illustrate how heterogeneous the sediments are on a small spatial scale. These two profiles are from one deployment; the electrodes were separated by ~9 cm. Such variability inevitably enhances scatter in the results. The data from profiles such as Figure 8.2a form the basis of our calculations of O2 fluxes and O2=0 depths.
Sediment O2 fluxes
The diffusive fluxes of O2 into the sediment were calculated on the basis of the estimated O2 gradient at the interface. Gradients at x=0 were determined by fitting an exponential to the first 5 or 6 points in the sediment. The algorithm used was C/Co= a1[1-exp(a2x)]+a3, where C is the electrode response at depth x and Co the electrode response in bottom water and a1, a2, and a3 are fitting parameters. For depth x=0, the derivative, dc/dx, of this expression is -a1• a2. The gradient at the interface in terms of O2 is -a1• a2• O2BW, where O2BW= bottom water O2. The bottom water O2 data used for the period 1995 to 2000 were interpolated from MWRA monthly monitoring cruises before and after our deployments. For the period 2000-2005, O2 was measured on samples taken at the time of the deployment cruises (W. R Martin; pers. communication, 2005). The flux was calculated as
JO2 =-por • Dsw • (por.75) • (dc/dx)x=0
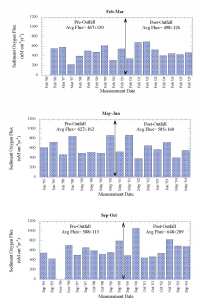
where por is the average porosity measured in the upper 3mmof a number of sediment cores collected over many years; por.75 is a correction for sediment tortuosity (Klinkenberg, 1961, McDuff and Ellis, 1979) determined on those cores, and Dsw is the diffusion coefficient of O2 in seawater corrected for ambient temperature. The porosity and tortuosity values were supplied by W. R. Martin (pers. communication, 2005). Figure 8.3 presents the estimates of O2 fluxes over the period 1995-2005. The data presented are the averages of values obtained from the three profiles collected on each deployment; on occasion one electrode failed, reducing the number of profiles to two. Rarely, only a single profile was measured. On most cruises two deployments were carried out. Each deployment on a given cruise is presented as an average, hence there are often two values on a given sample date. The data are grouped into 3 time periods: February-March, May-June, and September-October. This was done because there is the potential for systematic differences in fluxes between these three seasons. The point at which the Massachusetts Bay outfall commenced operation, Sept 2000, is indicated. At the top of the figure the averages for the pre- and post-outfall years are given. The data show quite clearly that within the variation of the flux data, 1 sigma ranges from 20 to 30%, there is no difference between the pre- and post outfall fluxes. A Student t-test yields no significant difference in the calculated fluxes for the pre- and post-outfall years for any of the 3 periods (t-probabilities ≥0.3).
An important qualification to this method of estimating sediment O2 fluxes should be noted. In coastal environments, diffusive fluxes often do not account for the total O2 flux; rather, biological activity, often termed irrigation, enhances transport across the sediment-water interface (Aller, 1980; Christensen and others, 1984). Fluxes determined with benthic chambers do include both diffusive and biologically mediated exchange, i.e. measure the total flux. In eight instances where our profiling was done at the same time as chamber deployments, our estimated fluxes are ~75% of the total as determined with the chambers (chamber O2 data from W.R. Martin, pers. communication). Thus there is a significant O2 flux that is not accounted for by diffusion. We cannot say whether or not this additional flux has changed as a result of the initiation of the outfall discharge. To constitute a significant change in sediment metabolism, however, would require that a large proportion of this flux be a result of oxidation of outfall material. This seems unlikely in the face of a lack of change in the diffusive flux.
A second caveat to our conclusion regarding O2 fluxes relates to the rates of metabolism of outfall organic matter reaching the sediments. If these rates are low, for example less than ~0.3/yr, the effect of enhanced organic matter delivery would not reach the maximum for ~ 10 years (5 half lives). Should such a slow reaction rate apply, we would not expect to see small changes for a number of years. However, a substantial change in delivery (e.g. ≥50% increase) should be readily detectable in the ~4 year record available since discharge from the outfall began. While such a slow rate, used strictly as an example here, seems unlikely for sewage outfall material, I do not know of actual measurements that could resolve this issue.
Sediment O2 Penetration Depths
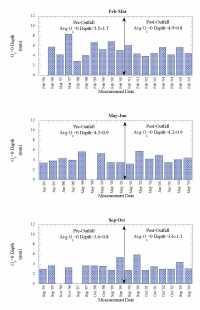
The depths to O2=0 are summarized in Figure 8.4. The presentation scheme is the same as that for the O2 fluxes (Figure 8.3). The averages for each of the data sets are given for pre- and post- outfall data at the top of the figure. As in the case of sediment O2 fluxes, there is no discernible effect from the onset of use of the outfall. A Student t-test of the data from the pre- and post-outfall periods confirms this (t-probability ≥.3) for each of the three time periods.
It is interesting that for both O2 fluxes and depth to O2=0, the differences between the Feb-Mar and Sept-Oct data sets are significant (t-probability <<.05). This is reassuring as regards the estimates made since the warmer temperatures and "burn down" of the spring-summer bloom material are expected to enhance organic matter remineralization in the fall period, leading to greater O2 fluxes and shallower O2=0 depths as observed. Indeed, similar seasonal effects are observed in many coastal environments.
Conclusions
Estimates of O2 diffusion into the sediment, based on O2 profiles, as well as depths to O2=0 in the sediments at the study site provide no evidence of an influence of sewage discharge from the Massachusetts Bay outfall. A substantial (~25%) non-diffusive O2 flux, not detectable with the method used here, seems unlikely to alter this conclusion. However, a very slow reaction rate for outfall derived organic matter could delay the onset of detectable changes.
|
Click on figures below for larger images (PDF format).
 | Figure 8.1.
|
 | Figure 8.2.
|
 | Figure 8.3.
|
 | Figure 8.4.
|
|