
Suspended-Sediment Load Computation for Poland Run near Swanton, Maryland, 2007-08
By Allen C. Gellis and William S.L. Banks
Introduction
For Water Year (WY) 2008 (October 1, 2007 - September 30, 2008), a suspended-sediment data-collection program designed for computation of a daily suspended-sediment record was initiated at Poland Run near Swanton, Maryland at U.S. Geological Survey (USGS) streamflow-gaging and water-quality station 03075800 (fig. 1). The purpose of the investigation was to help the Maryland Department of Natural Resources (MDDNR) better understand sediment input to Deep Creek Lake by studying a tributary to Deep Creek Lake that was disturbed by land-development activities in the watershed.
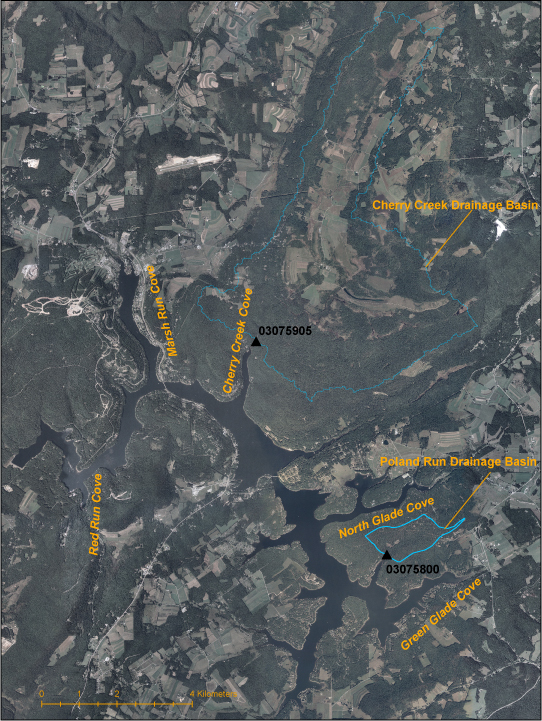
Figure 1. Poland Run and Cherry Creek drainage basins, Garrett County, Maryland.
Methods
Samples of suspended sediment to be used in the computation of daily suspended-sediment loads were collected using a U.S. Series depth-integrating, isokinetic DH-48 hand-held sampler. If the stream depth was not sufficient to use this sampler, suspended-sediment samples were collected using the hand-dip method. In the hand-dip method, a pint bottle is submerged in the stream by hand and samples are taken at one or more cross sections (Edwards and Glysson, 1999). Suspended-sediment samples were collected using the equal-width-increment (EWI) method, in which samples are collected at equal-width increments in the channel cross section (Edwards and Glysson, 1999). An automatic suspended-sediment pump sampler was installed at Poland Run on July 25, 2008. This sampler is designed to pump samples into 24 separate 1-L (liter) plastic bottles. The sampler contains a peristaltic pump to transport the sample from the stream to the sample bottle. The transfer line is purged by the sampler before and after each sample is collected. The timing of the collection of 24 samples was pre-programmed to pump samples across the flood hydrograph so that samples were collected on both the rising and falling limbs at various stages.
Suspended-sediment samples were sent to the USGS Kentucky Water Science Center Sediment Laboratory in Louisville, Kentucky, for analysis of suspended-sediment concentrations. Determination of suspended-sediment concentration was made by the evaporation or filtration method (Guy, 1969).
Daily suspended-sediment loads were computed at Poland Run using the subdivision method (Porterfield, 1977) with the USGS-software program Graphical Constituent Loading Analysis System (GCLAS). In the subdivision method, a continual trace of suspended-sediment concentration is developed for the period of interest using suspended-sediment concentrations obtained from field sampling and estimates of suspended-sediment concentrations for intervals between times of sample collection. The relation of discharge to suspended-sediment concentration is known as a sediment-transport curve and was used to estimate suspended-sediment concentrations. Suspended-sediment concentration can be estimated quite accurately using turbidity (Lewis, 2003; Ziegler, 2003). At Poland Run, a nephelometer (a device to measure turbidity) was installed and recorded turbidity readings every 5 minutes. Turbidity at Poland Run was recorded in Formazin Nephelometric Units (FNUs). In addition, suspended sediment was measured on a periodic basis at the site. Turbidity data were used to estimate suspended-sediment concentrations between measurements by regressing known suspended sediment values against Nephelometric values. The values of turbidity were entered into the GCLAS program to assist in the construction of a continuous suspended-sediment concentration trace.
In the software package GCLAS, the following data are plotted against time: (1) the hydrograph for the period of interest, (2) sampled suspended-sediment concentrations, (3) the sediment-transport curve, and (4) a background curve of transformed values of turbidity expressed as suspended-sediment concentration in mg/L. Once a satisfactory trace of suspended-sediment concentrations has been developed, GCLAS computes the suspended-sediment load for each day of interest.
Results
For WY 2008, 38 water samples were collected for determination of suspended-sediment concentration (table 1). These samples were collected during flows that ranged from 0.15 to 29.0 ft3/s (cubic feet per second) and had suspended-sediment concentrations that ranged from 3.0 to 5,260 mg/L (table 1). For two of the samples, the instantaneous discharge data were not available (table 1). When the instantaneous peak flow exceeded 3 ft3/s, a runoff occurred at Poland Run. During WY2008, Poland Run had 19 runoff events. Samples were collected for 5 of the 19 runoff events, for a total of 17 samples Suspended-sediment concentrations in these samples ranged from 98 to 5,260 mg/L. Suspended-sediment concentrations are typically highest during rainfall and runoff events compared to base-flow conditions and thus, these rainfall events can account for the majority of the annual suspended-sediment load (Gellis and others, 2005). Many of the suspended-sediment concentrations collected during the five runoff events were one or more orders of magnitude higher than suspended-sediment concentrations in base-flow samples; this demonstrates the importance of sampling runoff events. For WY 2008, the instantaneous peak flow in Poland Run was 29 ft3/s and occurred during a runoff event from June 4 to 5, 2008, when nine suspended-sediment samples were collected across the storm hydrograph (table 1).
Flow responds quickly to precipitation events at Poland Run and the storm hydrographs rise and fall rapidly (within a few hours) Due to the flashy nature of flow at Poland Run, it was often difficult to arrive at the site in time to collect a sediment sample at high flows. An automatic sampler was installed in late WY 2008 (July 25, 2008), but many of the events were sampled before the installation. In WY 2008, nine of the 38 sediment samples were collected using the automatic sampler. In order to compute a daily suspended-sediment record, it is necessary to generate a continuous suspended-sediment trace with suspended-sediment samples collected across the storm hydrograph. Because suspended-sediment samples were not collected during most of the runoff events at Poland Run, suspended-sediment concentrations had to be estimated using a sediment-transport curve developed for Poland Run (fig. 2) and the relation of turbidity to suspended-sediment concentration, also developed for Poland Run (fig. 3). Due to limited sampling during storms, the sediment record and estimated loads at Poland Run for WY 2008 were rated as "Fair."
Figure 2. Suspended-sediment transport curve for Poland Run near Swanton, Maryland,
for samples collected from October 1, 2007, through September 30, 2008.
[ft3/s, cubic feet per second; mg/L, milligrams per liter]
Figure 3. Turbidity plotted against suspended-sediment concentrations for Poland Run
near Swanton, Maryland, for samples collected from October 1, 2007 through September 30, 2008.
[FNU, Formazin Nephelometric Units; mg/L, milligrams per liter]
The total suspended-sediment load for Poland Run in WY 2008 for the days when load was computed is 94 tons (table 2). Daily streamflow was estimated for 68 days at Poland Run (table 2). Estimation of daily streamflow was necessary because of equipment malfunctions or problems caused by natural conditions (such as extremely low or no flow). If a mean daily discharge at Poland Run was estimated, the suspended-sediment load was not computed for that day (table 2). An 'e' is shown in table 2 to indicate that a limited number of sediment samples were collected on these days and the sediment loads are therefore considered to be estimates. The suspended-sediment load transported during the 19 runoff events was 74 tons, which is 79 percent of the total computed suspended-sediment load for WY 2008 (table 3). The runoff event on June 4-5, 2008 transported 27 tons of suspended sediment or 29 percent of the total computed suspended-sediment load for WY 2008 (tables 2 and 3). For the 19 runoff events, the suspended-sediment load was estimated for 12 days and totaled 28 tons (tables 2 and 3). This indicates that approximately one-third (30 percent) of the computed suspended-sediment load at Poland Run is estimated and supports the rating of "Fair" for this sediment record.
The suspended-sediment load for Poland Run was not computed over an entire water year and, therefore, it is not appropriate to compare the suspended-sediment loads at Poland Run to other streams in Maryland. However, the suspended-sediment record at Poland Run is consistent with sediment transport for other streams in Maryland in that a majority of the suspended sediment is transported during high-runoff events.
References Cited
Edwards, T.K., and Glysson, G.D., 1999, Field methods for measurement of fluvial sediment: U.S. Geological Survey Techniques of Water-Resources Investigations, book 3, chap. C2, 89 p.
Gellis, A.C., Banks, W.S.L., Langland, M.J., and Martucci, S.K., 2005, Suspended-sediment data for streams draining the Chesapeake Bay Watershed, Water Years 1952-2002: Scientific Investigations Report 2004-5056, 59 p., available online at http://pubs.usgs.gov/sir/2004/5056/#pdf.
Guy, H.P., 1969, Laboratory theory and methods for sediment analysis: U.S. Geological Survey Techniques of Water-Resources Investigations, book 5, chap. C1, 58 p.
Lewis, J., 2003, Estimation of suspended sediment flux in streams using continuous turbidity and flow data coupled with laboratory concentrations, in Gray, J.R., and Glysson, C.D., eds., Turbidity and Other Sediment Surrogates Workshop, April 30-May 2, 2002, Reno, Nevada: U.S. Geological Survey Circular 1250, List of Extended Abstracts, Appendix 2, accessed November 7, 2008 at http://water.usgs.gov/osw/techniques/TSS/listofabstracts.htm.
Porterfield, G., 1977, Computation of fluvial-sediment discharge: U.S. Geological Survey Techniques of Water-Resources Investigations, book 3, chap. C3, 66 p.
Ziegler, A.C., 2003, Issues related to use of turbidity measurements as a surrogate for suspended sediment, in Gray, J.R., and Glysson, G.D., eds., Turbidity and Other Sediment Surrogates Workshop, April 30-May 2, 2002, Reno, Nevada: U.S. Geological Survey Circular 1250, List of Extended Abstracts, Appendix 2, accessed November 7, 2008 at http://water.usgs.gov/osw/techniques/TSS/listofabstracts.htm.
