Skip past header information
USGS - science for a changing world

U.S. Geological Survey Open-File Report 2010-1146

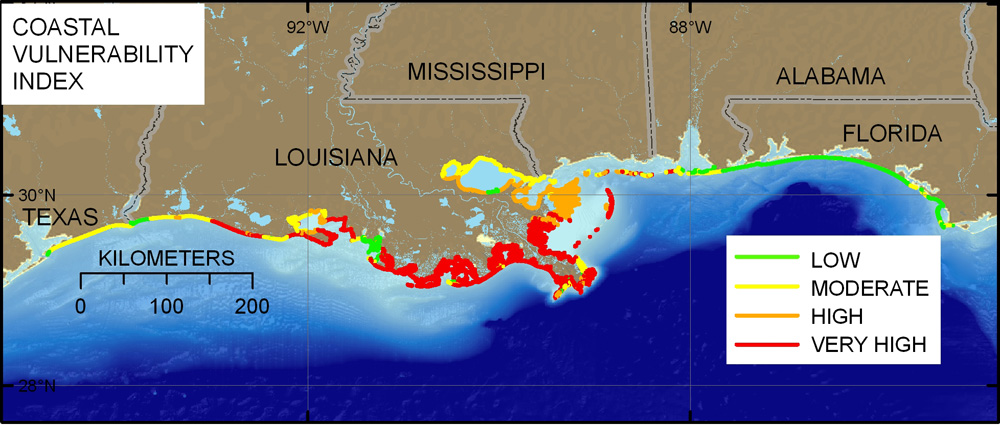
Coastal Vulnerability Assessment of the Northern Gulf of Mexico to Sea-Level Rise and Coastal Change


Skip past navigation menu to main textTitle Page / Contents / List of Figures and Tables / Conversion Factors and Datum / Abstract / Introduction / Northern Gulf of Mexico / Methods / Geologic Variables / Physcial Process Variables / Results / Discussion / Conclusions / Acknowledgments / References Cited / Appendix


Figure 11. Updated data source CVI calculated using Miller and others (2004), and Martinez and others (2006) shoreline change data, Barras and others (2008) land-area change data, and vertical movement data from Ivins and others (2007).

Figure 11 is a map of the updated data source CVI calculated using Miller and others (2004), and Martinez and others (2006) shoreline change data, Barras and others (2008) land-area change data, and vertical movement data from Ivins and others (2007). Louisiana and Mississippi are mostly high to very high vulnerability, whereas Texas, Alabama, and Florida are mostly moderate to low vulnerability.


To view files in PDF format, download a free copy of Adobe Reader.


Accessibility FOIA Privacy Policies and Notices

Take Pride in America logo USA.gov logo U.S. Department of the Interior | U.S. Geological Survey
URL: https://pubsdata.usgs.gov/pubs/of/2010/1146/html/imagepages/Figure11.html
Page Contact Information: Contact USGS
Page Last Modified: Wednesday, 07-Dec-2016 22:36:51 EST