U.S. Geological Survey Open-File Report 2010-1146
Coastal Vulnerability Assessment of the Northern Gulf of Mexico to Sea-Level Rise and Coastal Change
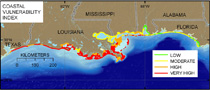
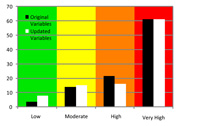
A CVI for the Northern Gulf of Mexico is calculated using NOS tide gages (Zervas, 2001) and Dolan and others (1985) shoreline change data in order to create a baseline of comparison for the updated CVI, which will replace NOS tide gage SLR rates with vertical movement rates (Ivins and others, 2007) and the Dolan and others (1985) shoreline change data with updated shoreline change (Miller and others, 2004; Martinez and others, 2006) and land-area loss rates (Barras and others, 2008). The calculated CVI values for the Northern Gulf of Mexico based on NOS/NOAA water-level recorders for sea-level rise rate (Zervas, 2001), geomorphology, shoreline change from Dolan and others (1985), wave height, coastal slope, and tidal range are between 5.16 to 39.53 (fig. 10). The mean CVI value is 20.96; the mode and median are both 22.82. The standard deviation is 6.63. If the CVI is recalculated for the same area based on vertical movement rates from Ivins and others (2007) in place of sea-level rise data from tide gages, shoreline change rates from Miller and others (2004), Martinez and others (2006), and land loss rates from Barras and others (2008), while all other variables remain the same, the CVI values are between 3.65 to 35.35 (fig. 11). The mean CVI value is 20.38; the mode and median are 22.82 and 20.41, respectively. The standard deviation is 5.87. The CVI scores in figures 10 and 11 are divided into low, moderate, high, and very high vulnerability categories based on the natural breaks in the data as determined from the original (data source) CVI (fig. 10). This was done so that the CVI value ranges were the same between figures, allowing direct comparison. CVI values below 10.95 are assigned to the low vulnerability category. Values from 10.96 to 16.32 are considered moderate vulnerability. High vulnerability values lie between 16.33 and 20.4. CVI values above 20.4 are classified as very high vulnerability. Figure 12 shows the percentage of shoreline in each vulnerability category for figures 10 and 11. Between 10,000 and 11,000 kilometers of shoreline are evaluated in the study area for figures 10 and 11. Of this total, 61 percent of the mapped shoreline is classified as being at very high vulnerability due to future sea-level rise. 16 to 21 percent is classified as high vulnerability, 13 to 15 percent as moderate vulnerability, and 3 to 7 percent as low vulnerability. The updated CVI mean value was less than 3 percent different than the original CVI mean value. In order to determine which variables may be most important to the CVI, a principal component analysis (PCA) was performed on the variables used to calculate the CVI. For both CVIs (figs. 10 and 11), sea-level rise rate or vertical movement rate, shoreline change rate or land-loss rate, and wave height were the three most important variables (appendix). Wave height was most significant in the first principal component for the original data source CVI, while the combination of vertical movement, shoreline change (or land loss), and wave height was important in the updated CVI first principal component. Tidal range did not vary within the entire study area, and therefore did not contribute to the variance in the CVI. Coastal slope and geomorphology were only significant in the 4th and 5th principal components, which explains between 5 and 0.75 percent of the CVI variance, respectively. Appendix contains figures and tables from the principal component analysis of both CVIs. The areas that were consistently ranked as very high vulnerability among CVI determinations include the coastal areas surrounding Barataria Bay, Terrebonne Bay, and the Chandeleur Islands. The Atchafalaya Bay region was consistently ranked as moderate to low vulnerability, as was much of the Florida panhandle. Lake Pontchartrain and Lake Borgne generally ranked from moderate to high vulnerability. The areas that varied the most between CVI determinations were the Chenier Plain in Western Louisiana and Texas, and the Mississippi-Alabama barrier island chain. |

![]() U.S. Department of the Interior |
U.S. Geological Survey
U.S. Department of the Interior |
U.S. Geological Survey
URL: https://pubsdata.usgs.gov/pubs/of/2010/1146/html/results.html
Page Contact Information: Contact USGS
Page Last Modified: Wednesday, 07-Dec-2016 22:36:48 EST