U.S. Geological Survey Open-File Report 2010-1146
Coastal Vulnerability Assessment of the Northern Gulf of Mexico to Sea-Level Rise and Coastal Change
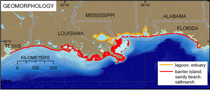
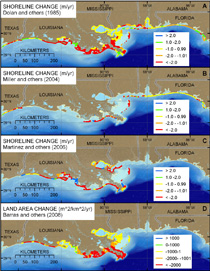
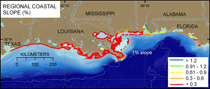
Geomorphology The geomorphology variable expresses the relative erodibility of different landform types (table 2). These data were derived using aerial photography, land cover data, Google Earth™, and Coastal Classification Atlases (Morton and others, 2004, 2005; Morton and Peterson, 2005a-c) (table 1). Geomorphologic landforms within the study area include high vulnerability lagoons and estuaries and very high vulnerability sandy beaches, saltmarshes, barrier islands, and tidal flats (fig. 4). Very high vulnerability landform types account for 85 percent of the assessed shoreline. Areas classified as high vulnerability (15 percent) include Lake Borgne and Lake Pontchartrain and the mainland coast of Mississippi and Alabama. Historical shoreline change rate Several historical shoreline change rate databases are available for the Northern Gulf of Mexico (Dolan and others, 1985; Miller and others 2004; and Martinez and others, 2006). The Dolan and others (1985) dataset was constructed using a coastal erosion information system (CEIS), which was based on numerous data sources and resolutions, and was the only available dataset when the original Gulf of Mexico CVI was produced (Thieler and Hammar-Klose, 2000b). The Miller and others (2004) dataset covers sandy beaches and barriers for all of the Gulf of Mexico, and their historical change rates are based on a linear regression every 50 m for four shorelines between the late 1800s and 2002 (fig. 5B). Connor and others (2004) produced shoreline change rates for coastal Louisiana by dividing the shore into 80 reaches, generally between 3 and 40 km in length, based on geomorphology, change trends, and shoreline engineering practices. Martinez and others (2006) expanded the shoreline change coverage for the Gulf Coast of Louisiana originally published by Connor and others (2004), to include the birdfoot and Atchafalaya Bay (fig. 5C). The Dolan and others (1985) estimates of shoreline erosion and accretion cover the entire U.S. coastline, which represents shoreline change rates on a regional scale (1:7,500,000) (fig. 5A). The shoreline change data produced by Miller and others (2004) and Martinez and others (2006), provide a high resolution alternative to the 1:7,500,000 shoreline change dataset of Dolan and others (1985). Although these higher resolution datasets are not available in wetland areas or along the mainland coast of Mississippi and Alabama, they are a more current dataset at a more useful scale for CVI assessments and should be included whenever possible to increase CVI resolution. Figure 5A-C shows the shoreline change data availability and distribution along the Northern Gulf of Mexico coast. Historical land-loss rate Large wetland areas cannot be quantified with regard to shoreline erosion and accretion through the use of traditional mean high water line delineation and linear regression techniques. In order to investigate vulnerability for the vast wetland stretches of Louisiana, the traditional CVI methodology (Theiler and Hammar-Klose, 2000b) is modified to include land-loss data produced by Barras and others (2008). These data represent inland and coastal wetland loss from 1956 to 2008 (fig. 5D). These data are incorporated into the CVI in much the same way as the historical shoreline change studies are included. The main difference is that land loss data are measured in terms of area change rather than length. The Barras and others (2008) land-area change dataset provides a quantitative and novel approach to delineating land loss rates in Louisiana wetland areas, where traditional shoreline change determinations cannot be made. These data provide a long-term record (1956-2008) of land-area change that can be incorporated into the CVI. Regional coastal slope Coastal slope is an indication of vulnerability to inundation and the potential rapidity of shoreline retreat because low-sloping coastal regions should retreat faster than steeper regions (Pilkey and Davis, 1987). The regional slope (percent) of the coastal zone was calculated from a grid of topographic and bathymetric elevations extending in a 10-km radius, landward and seaward, of the shoreline. Elevation data were obtained from the National Geophysical Data Center (NGDC) as gridded topographic and bathymetric elevations at 0.1-meter vertical resolution and 3-arc second horizontal resolution (Divins and Metzger, 2009). These data also mark a resolution improvement over the original Gulf of Mexico CVI (Thieler and Hammar-Klose, 2000b) (fig. 1), wherein slopes were based on ETOPO-2 elevation data (U.S. Department of Commerce, 2006). Regional coastal slopes for the Northern Gulf of Mexico range from the very low to the very high vulnerability category (<0.3% - >1.2%); however, the very high vulnerability regional slope category (slope <0.3 %) represents 86 percent of the total assessed shoreline (fig. 6).
|

![]() U.S. Department of the Interior |
U.S. Geological Survey
U.S. Department of the Interior |
U.S. Geological Survey
URL: https://pubsdata.usgs.gov/pubs/of/2010/1146/html/geologicvar.html
Page Contact Information: Contact USGS
Page Last Modified: Wednesday, 07-Dec-2016 22:36:44 EST