U.S. Geological Survey Open-File Report 2010-1178
Geophysical Data from offshore of the Gulf Islands National Seashore, Cat Island to Western Horn Island, Mississippi
|
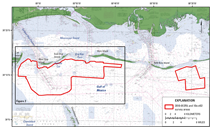
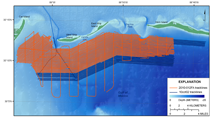
The Gulf Islands of Mississippi and Alabama lie 10 to 20 kilometers (km) offshore of the mainland. These islands are part of the Gulf Islands National Seashore and protect the mainland coast from the open Gulf of Mexico (fig. 1). Understanding the geologic framework upon which the Gulf Islands are built, the volume and distribution of sand associated with them and the processes that shape the surrounding seafloor, is essential to determining the evolution and fate of the island chain. The U.S. Geological Survey (USGS) in Woods Hole, Mass., and St. Petersburg, Fla., in cooperation with the U.S. Army Corps of Engineers Mobile District, have funded a study that aims to better understand the geologic framework and barrier island evolution of this coastal system. This report presents a compilation of the geophysical data acquired during the offshore-mapping component of the cooperative study. A complementary report containing the geologic interpretation and discussion of sand resources within the area is presented by Twichell and others (in press). A dense grid of more than 2,500 km of geophysical tracklines (fig. 2), covering an area of approximately 420 square kilometers (km2), was occupied seaward of the Gulf Islands during two cruises (IDs 2010-012-FA and 10CCT02) in March 2010. Surface and subsurface geophysical data were acquired with the following equipment: a Systems Engineering and Assessment, Ltd., SwathPlus interferometric sonar; Klein 3000 and 3900 dual-frequency sidescan sonars; and an EdgeTech 512i Chirp sub-bottom profiling system. The long-term goal of the offshore-mapping effort is to produce high-quality, high-resolution geologic data, maps, and interpretations that can be used (1) to identify sand resources within the region, (2) to better understand the Holocene evolution, and (3) to anticipate future changes in this coastal system. This report discusses the survey acquisition parameters and data-processing procedures and presents processed bathymetric grids, sidescan-sonar imagery, and seismic-reflection datasets in a geographic information system (GIS) for the westernmost surveyed area (fig. 1 and fig. 2). The 78-km2 eastern survey area (fig. 1) is published in a separate report (DeWitt and others, 2010), and together these datasets will serve as the foundation for future interpretive reports (for example, Twichell and others, in press). |