U.S. Geological Survey Open-File Report 2010-1178
Geophysical Data from offshore of the Gulf Islands National Seashore, Cat Island to Western Horn Island, Mississippi
|
The following sections provide basic descriptions of shipboard acquisition and cruise processing of the geophysical and geospatial data contained in this report. Detailed descriptions of acquisition parameters, postprocessing steps, and accuracy assessments for each data type are provided within the metadata files for geospatial data layers in the GIS Data Catalog. Field Program Approximately 350 km2 of the inner continental shelf offshore of the Gulf Islands, between Cat Island and the western end of Horn Island, were surveyed during two cruises aboard the Gulf Coast Research Laboratory's research vessel (R/V) Tommy Munro in March 2010 (fig. 1 and fig. 3). An additional 78 km2 area was surveyed near Petit Bois Pass during the second cruise and is described and published in a separate report (Dewitt and others, 2010). Interferometric-sonar, sidescan-sonar, and Chirp seismic-reflection systems were deployed simultaneously during the two cruises. The survey area on the western side of the Gulf Islands is approximately 45 km wide and extended from about 1.5 to 2 km seaward of the Gulf Islands chain (approximately 8 to 13 km offshore of coastal Mississippi). Positions of the ship and geophysical data were determined using Differential Global Positioning System (DGPS) navigation and were recorded using HYPACK® Hydrographic Survey Software. The DGPS antenna was mounted directly above the interferometric-sonar head on the port side of the vessel. Figure 4 shows the computer acquisition configuration onboard the R/V Tommy Munro, where each geophysical acquisition system had a dedicated computer in the ship's dry lab. During acquisition, the R/V Tommy Munro maintained speeds between 1.5 and 2.5 meters per second (m/s). Data were collected along tracklines spaced 150 meters (m) apart in the shore-parallel direction, and 2 km apart in the shore-perpendicular direction. Shore-parallel trackline spacing was chosen to ensure overlap of adjacent sidescan-sonar swaths. The sidescan system produces a large swath width, typically around 200 m. Shore-perpendicular tracklines were occupied to correlate alongshore and cross-shelf Chirp seismic-reflection data. Interferometric-Sonar Bathymetry Bathymetric data were acquired using a 234-kilohertz (kHz) SEA Ltd., SwathPlus interferometric sonar during the first cruise (2010-012-FA; 04 March 2010 - 17 March 2010), and a 468-kHz SEA Ltd., SwathPlus interferometric sonar during the second cruise (10CCT02; 19 March 2010 - 29 March 2010). The instrument was mounted on a rigid pole, along the port side of the vessel, about 2.5 m below the sea surface. SwathPlus acquisition software (version 6.8.0) was used to fire the system at a 0.25-second (s) ping rate and digitally log the data at a rate of 1,500 samples per second (Systems Engineering and Assessment, Ltd., 2010). Ship motion (heave, pitch, roll, and yaw) was recorded continuously with an Octopus F180 Attitude and Positioning system during the first cruise and an Octopus F190R system during the second cruise (Coda Octopus Group, Inc., 2010). Sound-velocity profiles (SVPs) were acquired approximately every 6 to 12 hours using an Applied MicroSystems SV Plus Sound Velocimeter (Applied Microsystems, 2010). The interferometric-sonar system acquired bathymetric soundings over swath widths ranging from 20 to 115 m, in water depths between 3 and 16 m. Data gaps resulted between adjacent interferometric-sonar swaths because tracklines were planned to optimize sea-floor coverage with the towed-sidescan system. Gap widths ranged from 0 to 100 m and varied as a function of trackline spacing, water depth, and avoidance of nautical obstructions. Accordingly, swath bathymetric data were acquired over approximately 40 to 50 percent of the entire survey area. CARIS (2010), a swath-bathymetry-processing software package, was used to post-process the bathymetric soundings. Sounding data were rectified for ship motion, and spurious soundings were eliminated. Corrections for sound velocity changes within the water column and tidal offsets (utilizing a NOAA discrete tidal zoning model and tidal observations from two Mississippi tide stations) were also applied to the soundings. Final soundings were referenced to mean lower low water (MLLW) vertical datum. Processed soundings from approximately 1,800 km of tracklines yielded a final bathymetric surface area of about 265 km2, which was gridded at a resolution of 50 m/pixel. Sidescan Sonar Sidescan-sonar (acoustic-backscatter) data were acquired during the first cruise (2010-012-FA) with a Klein 3000 dual-frequency sidescan-sonar system (100 and 500 kHz), which was towed approximately 3 m astern from a starboard-side davit (Klein Associates, Inc., 2010). During the second cruise (10CCT02), a Klein L3900 dual-frequency sidescan system (445 and 900 kHz) was used to acquire the data. Klein SonarPro acquisition software was used to log the data digitally at a sample rate resulting in raw pixel resolutions of approximately 0.18 and 0.14 m in the across-track and along-track directions, respectively. Horizontal offset values between the sidescan fish and DGPS antenna were provided to SonarPro, which calculated fish position dynamically during acquisition. The Klein system produced usable data over swath widths of 200 m during the first cruise and swath widths between 100 and 200 m during the second cruise. XSonar/ShowImage software was used to correct for geometric and radiometric distortions in the raw sidescan data (Danforth, 1997), and PCI Geomatica (version 10.1) software was used to create georeferenced mosaics of the final, processed data. Gray-scale GeoTIFF images of the mosaics were produced at 1-m resolution. Sidescan-sonar data were acquired along approximately 1,750 km of tracklines during the 2010 cruises, yielding a total mosaic area of about 260 km2. Chirp Seismic Reflection Approximately 2,015 km of high-resolution Chirp seismic-reflection profiles were collected using an EdgeTech Geo-Star Full Spectrum Sub-bottom (FSSB) system and SB-512i towfish (0.5-12 kHz) (EdgeTech, 2010). Data were acquired using a 0.5- to 8- kHz frequency sweep, a 5-millisecond pulse length, a 0.25-second shot rate, a 46-microsecond sample interval, and a 100-millisecond record length. During the first cruise (2010-012FA), SonarWiz.MAP +SBP® acquisition software (Chesapeake Technology Inc., 2010) was used to control the Geo-Star topside unit and digitally log trace data in SEG-Y, revision 1, standard format (Norris and Faichney, 2002). The SB-512i towfish was mounted on a catamaran and towed astern of the starboard side of the vessel. Navigation coordinates in arc-seconds were obtained from a DGPS antenna mounted on the catamaran and logged to the SEG-Y trace headers. A total of 1,523 km of seismic data were collected during the first cruise. During the second cruise (10CCT02), EdgeTech Discover® acquisition software was used to control the Geo-Star topside unit and digitally log trace data in SEG-Y format (Norris and Faichney, 2002). The SB-512i towfish was towed astern of the vessel approximately 3 m below the water surface. Differential Global Positioning System (DGPS) navigation coordinates were obtained from the Coda Octopus F190R motion reference unit (equipped with Omnistar HP) antenna and logged to the SEG-Y trace headers. A total of 492 km of seismic data from the second survey are included in this report. SIOSEIS (SIOSEIS, 2007), Seismic Unix (Stockwell and Cohen, 2010) and SeisVision (Halliburton, 2010) were used to postprocess the raw Chirp seismic-reflection data. Navigation data were inspected and edited, static corrections were applied to correct for fish depth beneath the sea surface, seafloor reflections were identified by peak amplitude, and sea-surface heave was removed. Final trace data, plotted as PNG images, and geo-located trackline files are presented in this report. |
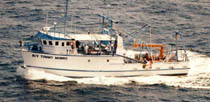
Figure 3. The R/V Tommy Munro. Photo by the Gulf Coast Research Laboratory, University of Southern Mississippi. |
||||||||||
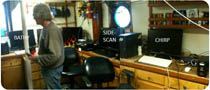
Figure 4 . Data acquisition setup onboard the R/V Tommy Munro. From left to right, interferometric bathymetry (SwathPlus 234/468), sidescan-sonar (Klein 3000/3900), and 512i sub-bottom Chirp seismic-reflection acquisition computers. |