U.S. Geological Survey Open-File Report 2011-1040
Continuous Resistivity Profiling Data From Great South Bay, Long Island, New York
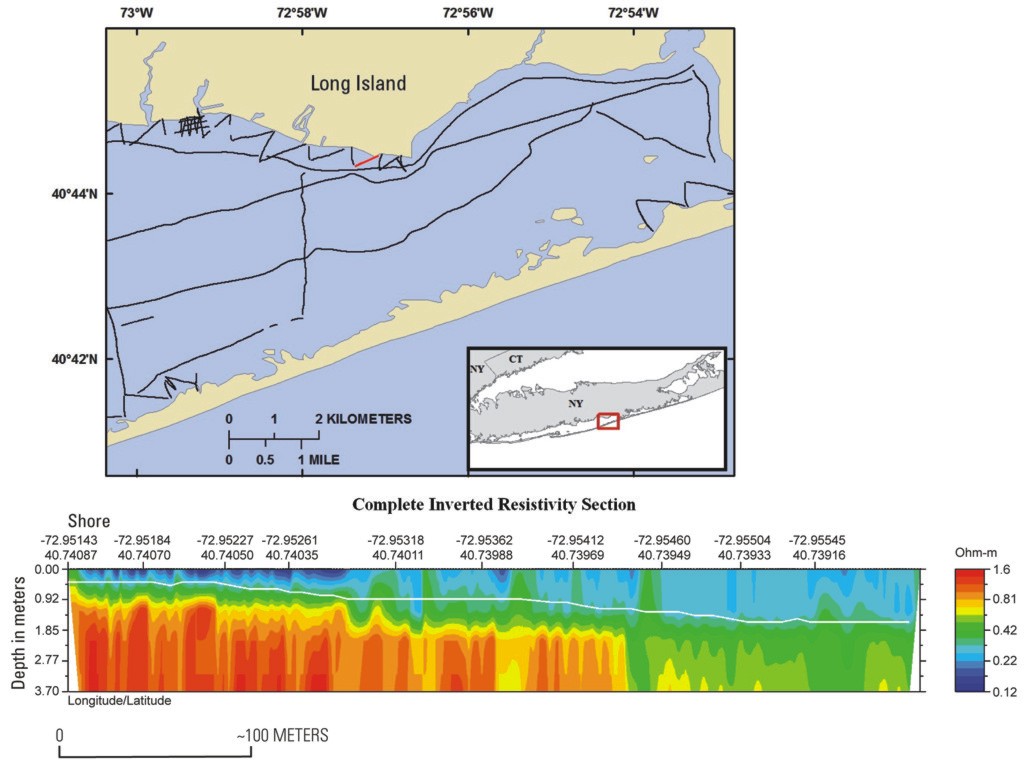 |
| Figure 6. Location map showing a portion of the continuous resistivity profiling (CRP) tracklines and a graph of the inverted resistivity profile associated with the red trackline. Low-salinity groundwater extends 100 meters or more offshore along much of the north and south shores of Great South Bay, based on high-resistivity anomalies (red and orange colors) in CRP data and offshore groundwater sampling. This shore-perpendicular CRP profile (red trackline in map) is typical of those collected in these settings, especially adjacent to modern marshes and near the mouths of tidal creeks. The profile color scale ranges from blues to reds with reds representing the higher resistivity values corresponding to fresher (less saline) groundwater. Click on image for larger version. |

![]() U.S. Department of the Interior |
U.S. Geological Survey
U.S. Department of the Interior |
U.S. Geological Survey
URL: http://pubsdata.usgs.gov/pubs/of/2011/1040/html/figurepages/fig6.html
Page Contact Information: GS Pubs Web Contact
Page Last Modified: Thursday, 08-Dec-2016 00:30:17 EST
