 |
Figure 1. Maps showing Long Island, New York. The lower map shows the location of Great South Bay adjacent to the glacial outwash plains of southern Long Island, New York. The bay is bounded on the south by a long barrier island, Fire Island, that includes the land area of Fire Island National Seashore as indicated in the upper map. The ridges that form the backbone of Long Island are glacial moraines. The base image in the lower map was acquired from Stony Brook University (accessed June 2011 at http://www.geo.sunysb.edu/reports/dem_2/). |
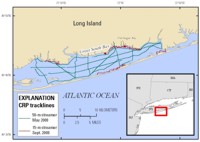 |
Figure 2. Location map showing the continuous resistivity profiling tracklines of the surveys in May and September 2008 in Great South Bay, Long Island, New York. |
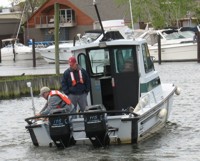 |
Figure 3. Photograph of the National Park Service boat used for data collection in Great South Bay. Photograph by VeeAnn Cross, U.S. Geological Survey. |
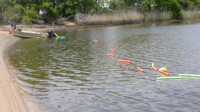 |
Figure 4. Photograph of the continuous resistivity profiling streamer deployed behind the R/V Terrapin (photograph is from a different survey). Foam flotation is attached to the cable between each electrode. Photograph by John Bratton, National Oceanic and Atmospheric Administration. |
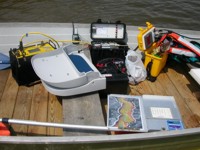 |
Figure 5. Photograph of the continuous resistivity profiling data acquisition system in the U.S. Geological Survey R/V Terrapin (photograph is from a different survey). The yellow box on the left of the photograph is the AGI SuperSting R8 resistivity meter, the black box in the middle manages the battery power to the system, and the yellow box on the right side contains the Lowrance GPS-enabled fathometer. Photograph by John Bratton, National Oceanic and Atmospheric Administration. |
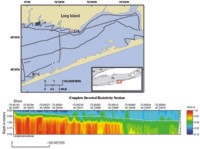 |
Figure 6. Location map showing a portion of the continuous resistivity profiling (CRP) tracklines and a graph of the inverted resistivity profile associated with the red trackline. Low-salinity groundwater extends 100 meters or more offshore along much of the north and south shores of Great South Bay, based on high-resistivity anomalies (red and orange colors) in CRP data and offshore groundwater sampling. This shore-perpendicular CRP profile (red trackline in map) is typical of those collected in these settings, especially adjacent to modern marshes and near the mouths of tidal creeks. The profile color scale ranges from blues to reds with reds representing the higher resistivity values corresponding to fresher (less saline) groundwater. |
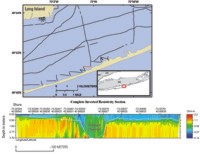 |
Figure 7. Location map showing a portion of the continuous resistivity profiling (CRP) tracklines and a graph of the inverted resistivity profile associated with the red trackline. This CRP profile (red trackline in map) shows resistivity anomalies present on either side of a dredged channel that likely truncates submerged confining units resulting in focused groundwater discharge to the channel. Navigation channels like this are common along the northern side of Fire Island (see fig. 1 for location). The profile color scale ranges from blues to reds with reds representing the higher resistivity values corresponding to fresher (less saline) groundwater. |
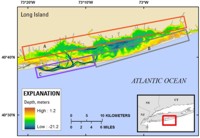 |
Figure 8. Map showing submarine groundwater discharge (SGD) environments in Great South Bay, Long Island, New York. These SGD environments can be divided into three primary types. The north shore of the bay (box A) is dominated by filled and natural marsh deposits, with adjacent submerged peats and clays that commonly promote flow of low-salinity groundwater to distances of greater than 100 meters (m) offshore. The south central and southeastern shores of the bay (north shore of Fire Island; box B) consist of modern marshes and drowned peats on shallow, sandy overwash fans that result in similarly wide SGD zones. The young, sandy spit that makes up the western end of Fire Island (box C) does not have extensive submarine confining units and therefore has narrow SGD zones less than 10 m wide. The bathymetric data were acquired from the National Oceanic and Atmospheric Administration estuarine bathymetry Web site (accessed April, 2008 at http://estuarinebathymetry.noaa.gov/). |

