Skip past header information
USGS - science for a changing world

U.S. Geological Survey Open-File Report 2011-1040

Continuous Resistivity Profiling Data From Great South Bay, Long Island, New York


Results of Continuous Resistivity Profiling

Skip past contents information

Click on figure for larger image.

Figure 2, location map of CRP tracklines in Great South Bay, Long Island, New York and link to larger image.

Figure 2.Location map showing the continuous resistivity profiling tracklines of the surveys in May and September 2008 in Great South Bay, Long Island, New York.

Thumbnail image for figure 6, map of CRP profile locations and profile showing low-salinity groundwater extending more than 100 meters offshore along the north shore of Great South Bay, and link to larger image.

Figure 6. Location map showing a portion of the continuous resistivity profiling (CRP) tracklines and a graph of the inverted resistivity profile associated with the red trackline. Low-salinity groundwater extends 100 meters or more offshore along much of the north and south shores of Great South Bay, based on high-resistivity anomalies (red and orange colors) in CRP data and offshore groundwater sampling. This shore-perpendicular CRP profile (red trackline in map) is typical of those collected in these settings, especially adjacent to modern marshes and near the mouths of tidal creeks. The profile color scale ranges from blues to reds with reds representing the higher resistivity values corresponding to fresher (less saline) groundwater.

Thumbnail image for figure 7, map of CRP profile locations and profile showing resistivity anomalies present on either side of a dredged channel in Great South Bay, and link to larger image.

Figure 7. Location map showing a portion of the continuous resistivity profiling (CRP) tracklines and a graph of the inverted resistivity profile associated with the red trackline. This CRP profile (red trackline in map) shows resistivity anomalies present on either side of a dredged channel that likely truncates submerged confining units resulting in focused groundwater discharge to the channel. Navigation channels like this are common along the northern side of Fire Island (see fig. 1 for location). The profile color scale ranges from blues to reds with reds representing the higher resistivity values corresponding to fresher (less saline) groundwater.

Thumbnail image for figure 8, map showing the location of three primary types of submarine groundwater discharge environmnets in Great South Bay, and link to larger image.

Figure 8. Map showing submarine groundwater discharge (SGD) environments in Great South Bay, Long Island, New York. These SGD environments can be divided into three primary types. The north shore of the bay (box A) is dominated by filled and natural marsh deposits, with adjacent submerged peats and clays that commonly promote flow of low-salinity groundwater to distances of greater than 100 meters (m) offshore. The south central and southeastern shores of the bay (north shore of Fire Island; box B) consist of modern marshes and drowned peats on shallow, sandy overwash fans that result in similarly wide SGD zones. The young, sandy spit that makes up the western end of Fire Island (box C) does not have extensive submarine confining units and therefore has narrow SGD zones less than 10 m wide. The bathymetric data were acquired from the National Oceanic and Atmospheric Administration estuarine bathymetry Web site (accessed April, 2008 at http://estuarinebathymetry.noaa.gov/).

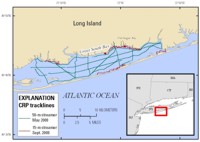
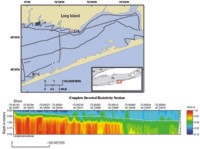
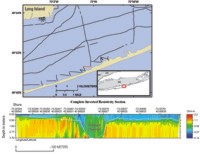
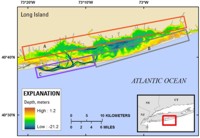
Major components of the study included the baywide CRP survey (fig. 2) and subsequent ground-truthing via groundwater sampling at sites in Patchogue Bay that were representative of the developed Long Island shoreline and adjacent to Fire Island (Bratton and others, 2009b and 2010). These investigations indicate that shallow submarine confining units (Bratton, 2007 and 2010) present beneath some nearshore areas of Great South Bay appear to exert primary control on nearshore submarine groundwater flow and discharge (figs. 6 and 7).

Based on CRP data and ground-truthing, shallow, low-salinity groundwater extends 100 m or more offshore (figs. 6 and 7) along much of the northern and southern shores of Great South Bay especially off the mouths of tidal creeks, and beneath shallow flats formed by overwash fans and drowned marshes adjacent to modern salt marshes on the northern side of Fire Island (fig. 8). Sandy spits and headlands were less likely to show evidence of fresh submarine groundwater flow and discharge offshore. Furthermore, human alteration of the natural hydrogeology of the bay's shorelines and nearshore area has truncated confining units and increased recharge near the shore through fill.

Much of the shoreline along the north shore of the bay consists of filled salt marshes, bulkheaded shorelines with numerous piers, and dredged complexes of navigation channels. Navigation channels and harbors dredged through the overwash fans on the north side of Fire Island are likely to focus groundwater discharge (fig. 6 and 7). The improved understanding provided by this study of how submarine groundwater discharges along both modified and natural shorelines of coastal lagoons like Great South Bay, could lead to more accurate models and more effective mitigation strategies for reducing nutrient discharge to this estuary and in comparable coastal settings.


Accessibility FOIA Privacy Policies and Notices

Take Pride in America logo USA.gov logo U.S. Department of the Interior | U.S. Geological Survey
URL: http://pubsdata.usgs.gov/pubs/of/2011/1040/html/summary.html
Page Contact Information: GS Pubs Web Contact
Page Last Modified: Thursday, 08-Dec-2016 00:30:35 EST