Skip past header information
USGS - science for a changing world

U.S. Geological Survey Open-File Report 2011-1041

Continuous Resistivity Profiling Data from Northport Harbor and Manhasset Bay, Long Island, New York


Continuous Resistivity Profile Previews - Manhasset Bay 15-m Streamer

Skip past contents information

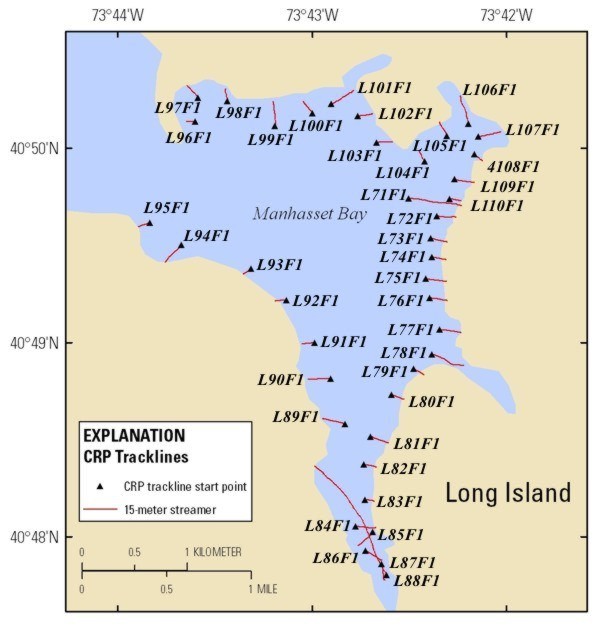
The table below contains previews of the 15-m streamer CRP data from Manhasset Bay processed using the average measured water resistivity value (WRES) of 0.35 ohm-m. Both the EarthImager 2D JPEG image and the MATLAB JPEG image of each processed file are presented. In addition, the trackline map below is a clickable map. By clicking on a line name, a new window will open with the processed images from that particular line segment. This new window will contain the MATLAB JPEG image as well as a reduced version of the EarthImager 2D JPEG image (short version). The beginning of each line is marked with a triangle on the map. The left side of the associated JPEG image represents the beginning of the line and corresponds to the triangle on the map. The line names represent the original line names at time of data collection.

Trackline map of processed 15-m streamer CRP lines collected in Manhasset Bay in May 2008. Line names provide hotlinks to the JPEG profiles.

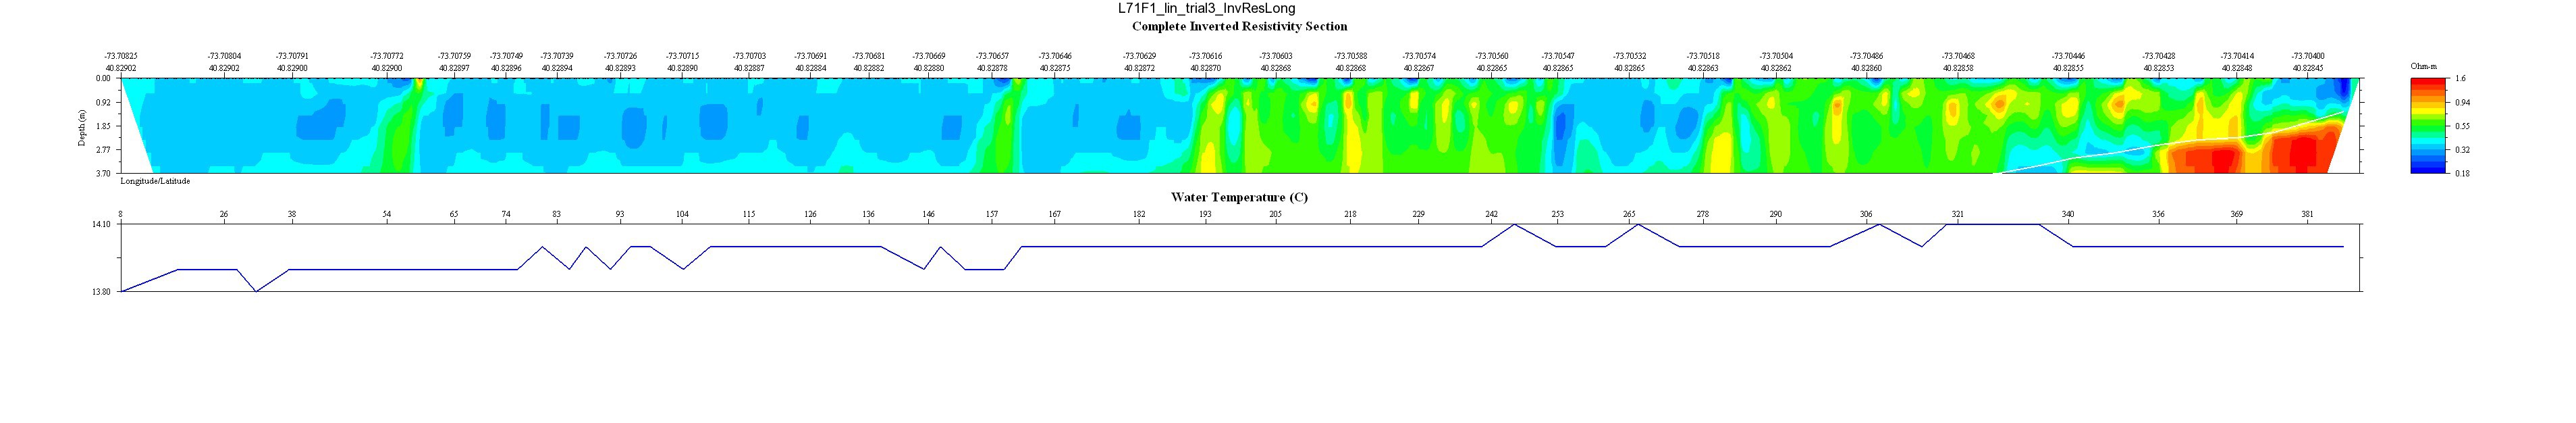
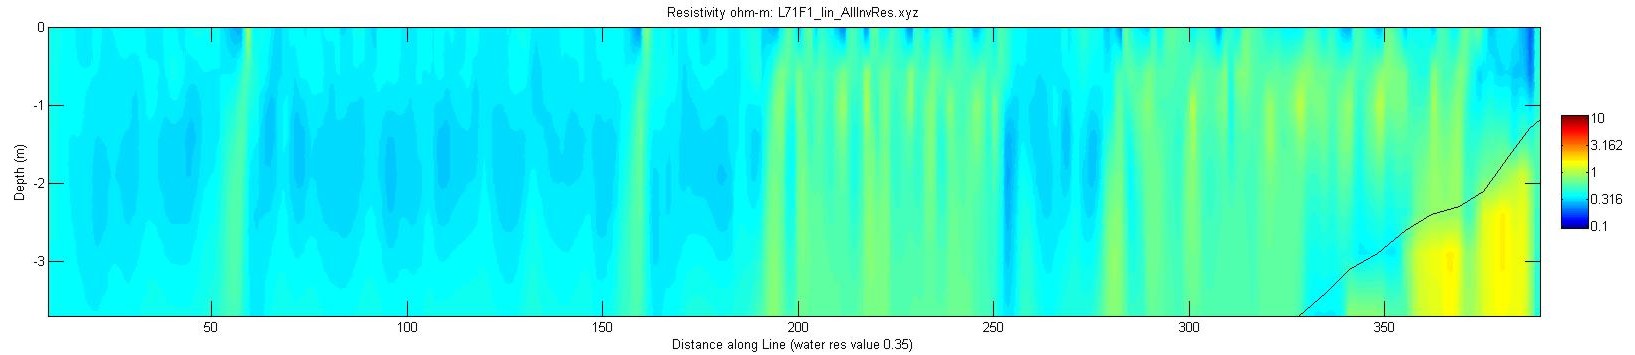
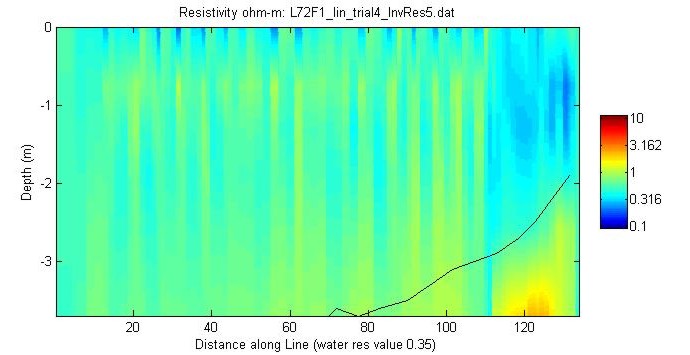
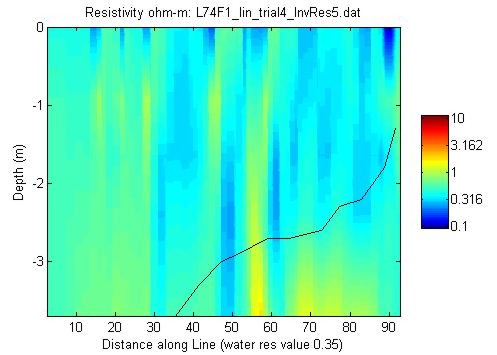
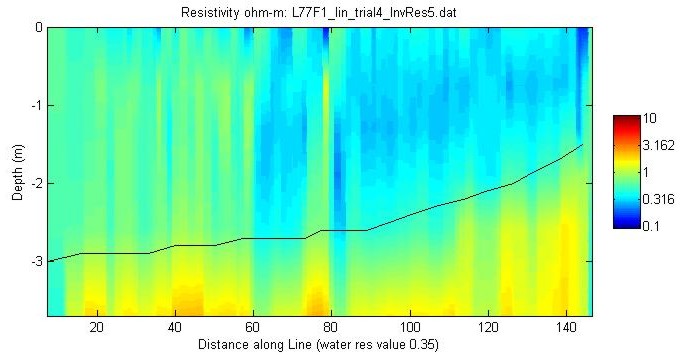
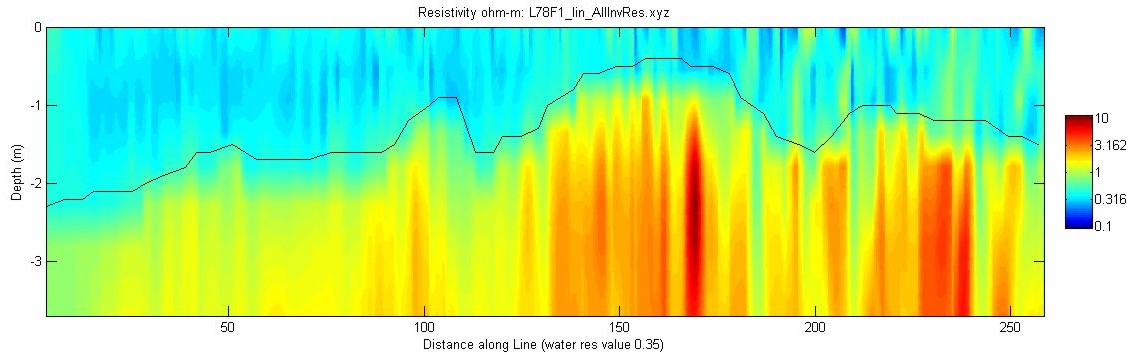
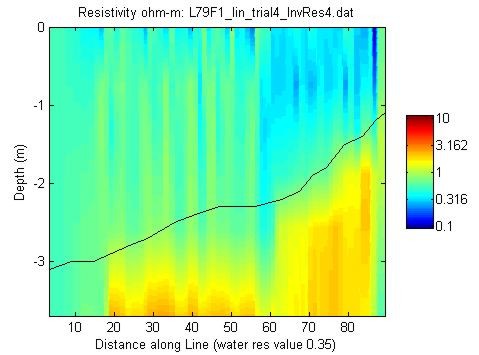
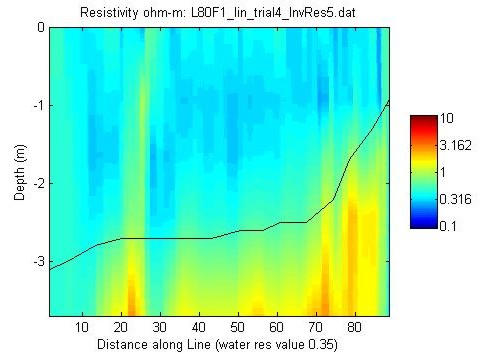
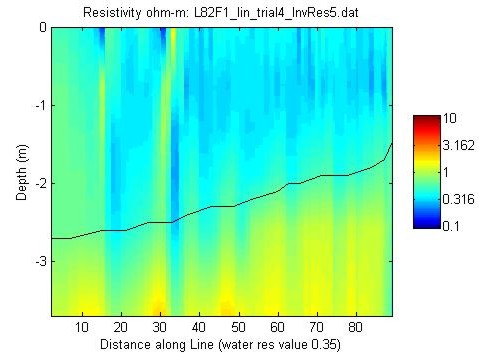
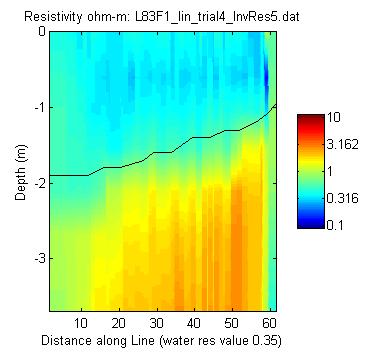
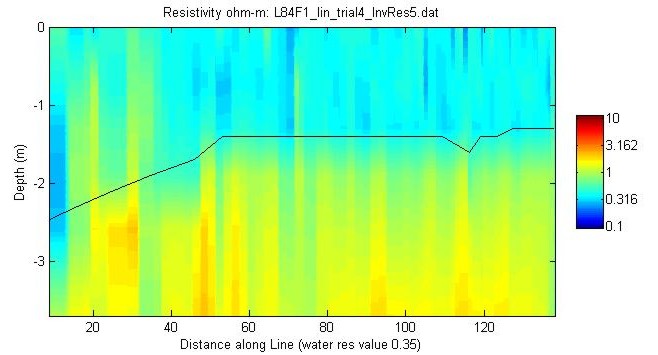
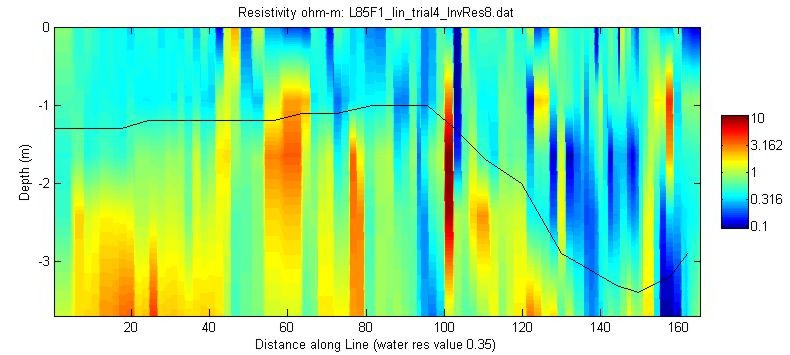
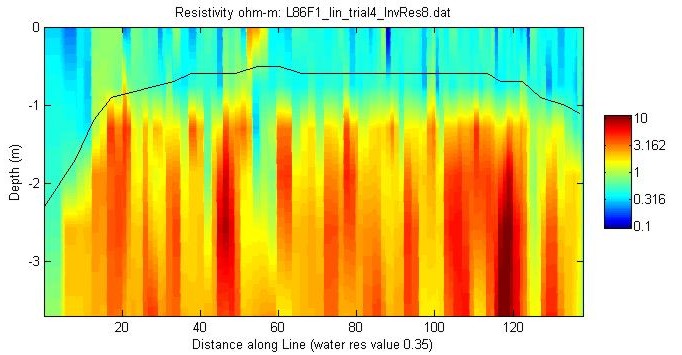
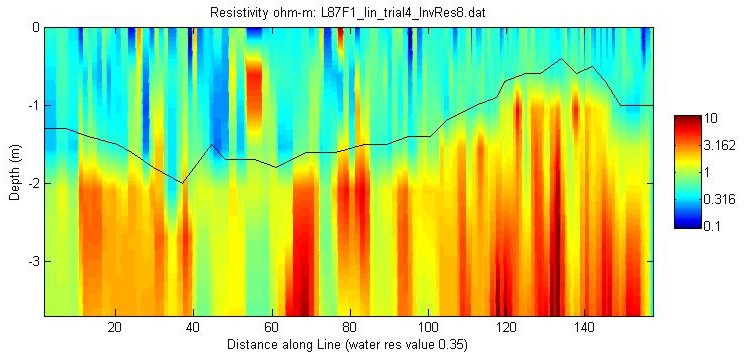
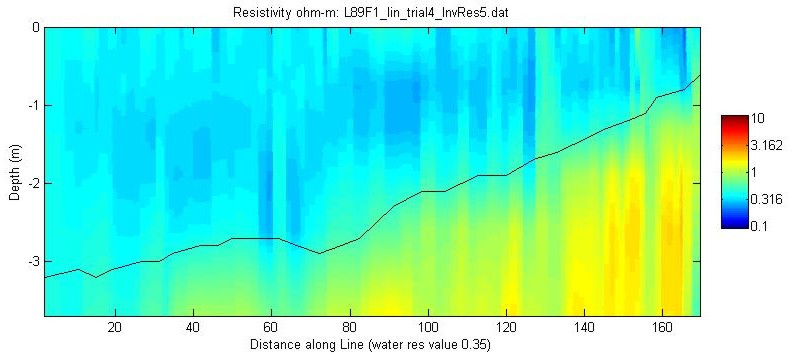
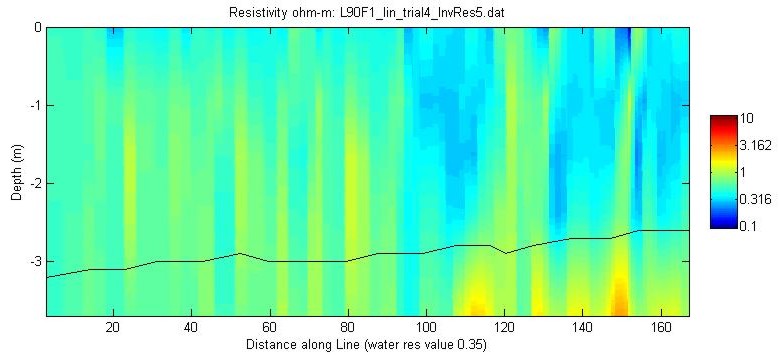
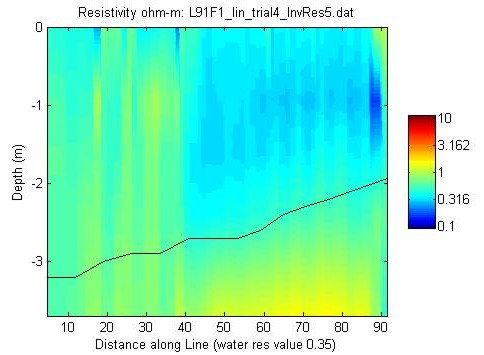
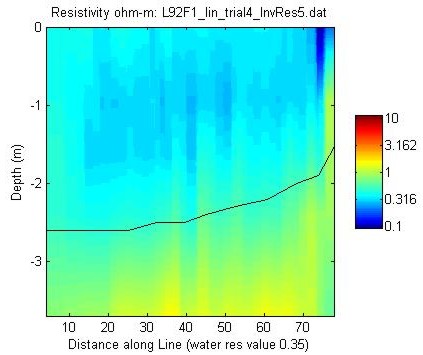
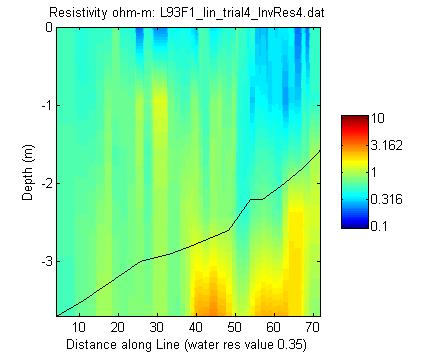
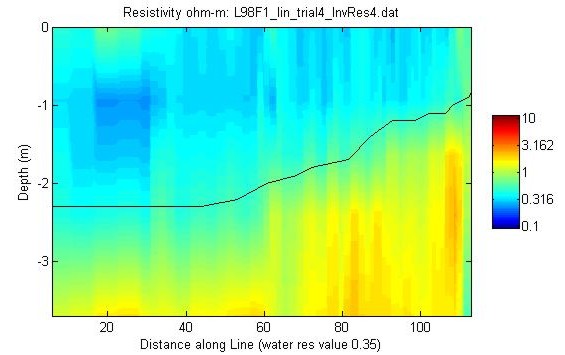
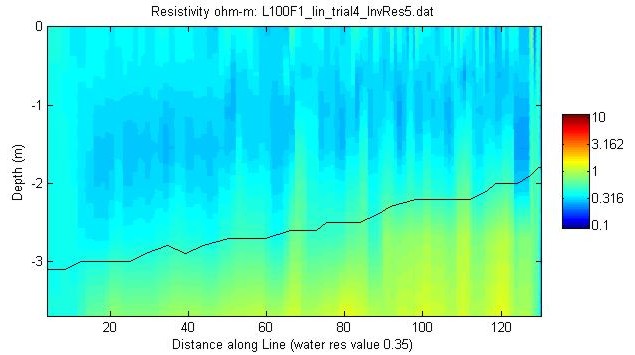
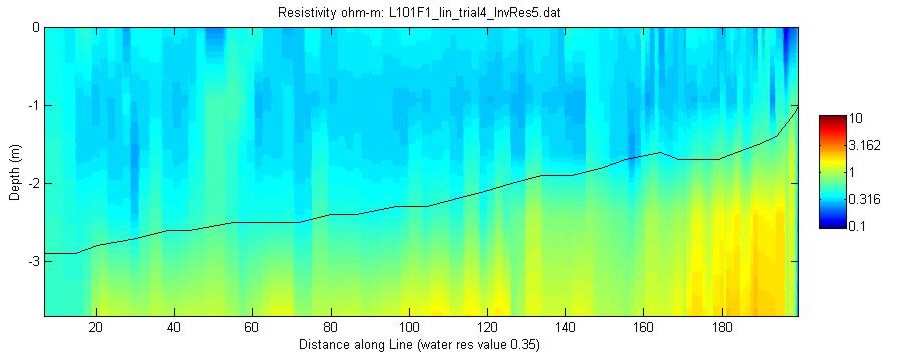
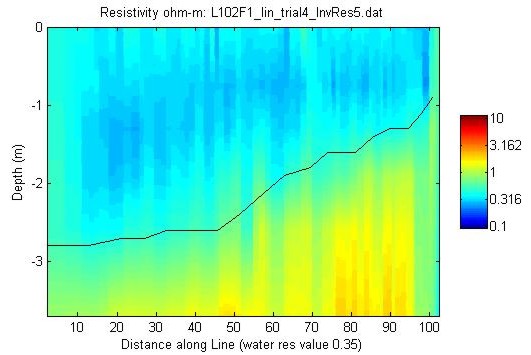
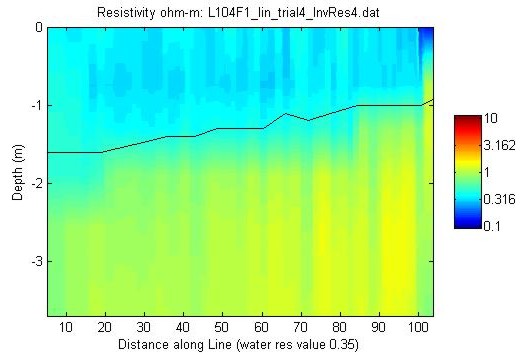
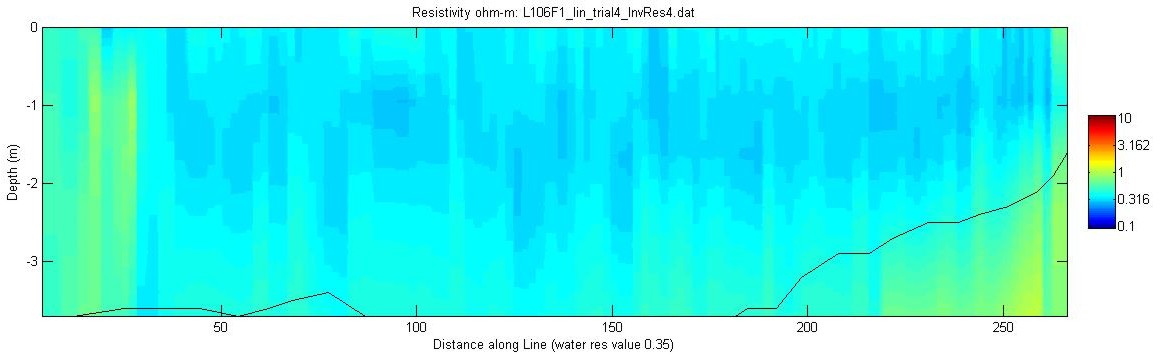
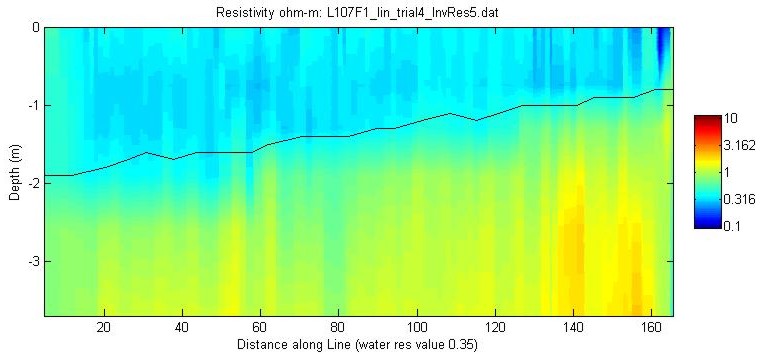
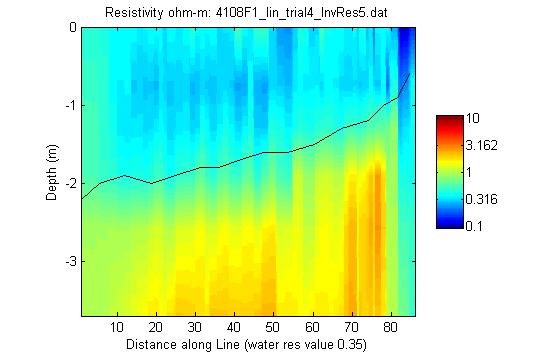
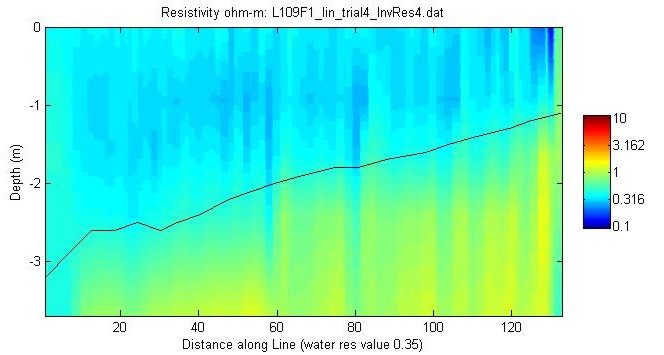
Preview of Profiles - click individual images to see full-size JPEG images of the profile. For the EarthImager 2D versions, the long version of the profile is available. All of the profiles are available for download from the Data Catalog page.

In the EarthImager 2D version, the white line in the image represents the water depth as measured by the fathometer. In the MATLAB-generated JPEG images, the water depth is represented by a black line. The JPEG images resulting from the EarthImager 2D processing were saved with the default color scale generated by the software. This color scale ranges from blues to reds with reds representing the higher resistivity values, which correspond to fresher (less saline) groundwater. Each individual image has the resistivity scale maximized for the range of resistivity values in that dataset. The MATLAB versions of the JPEG images use a common color scale for all the files to facilitate profile comparison. For these images, the polarity of the color scheme is the same as that of the EarthImager 2D JPEGs in that the colors range from blue to red with reds indicating higher resistivity values. In the MATLAB version, the x-axis represents distance along line in meters. The EarthImager 2D version x-axis units are latitude and longitude (position) along line. On extremely short lines that did not require the roll-along processing, the temperature plot is not generated during processing and the x-axis units are distance along line in meters. The 15-m streamer reaches depths of less than 4 meters. Several of the lines had portions of the survey in water depths greater than 4 meters as indicated by the absence of the water depth line. Several of the lines are so short the MATLAB image titles and x-axis labels are truncated.


EarthImager version MATLAB version

May 17, 2008: Line L71F1, WRES = 0.35
EarthImager thumbnail JPEG image of line 71 resistivity and temperature profile.

MATLAB thumbnail JPEG image of line 71 resistivity profile.
May 17, 2008: Line L72F1, WRES = 0.35
EarthImager thumbnail JPEG image of line 72 resistivity profile.
MATLAB thumbnail JPEG image of line 72 resistivity profile.
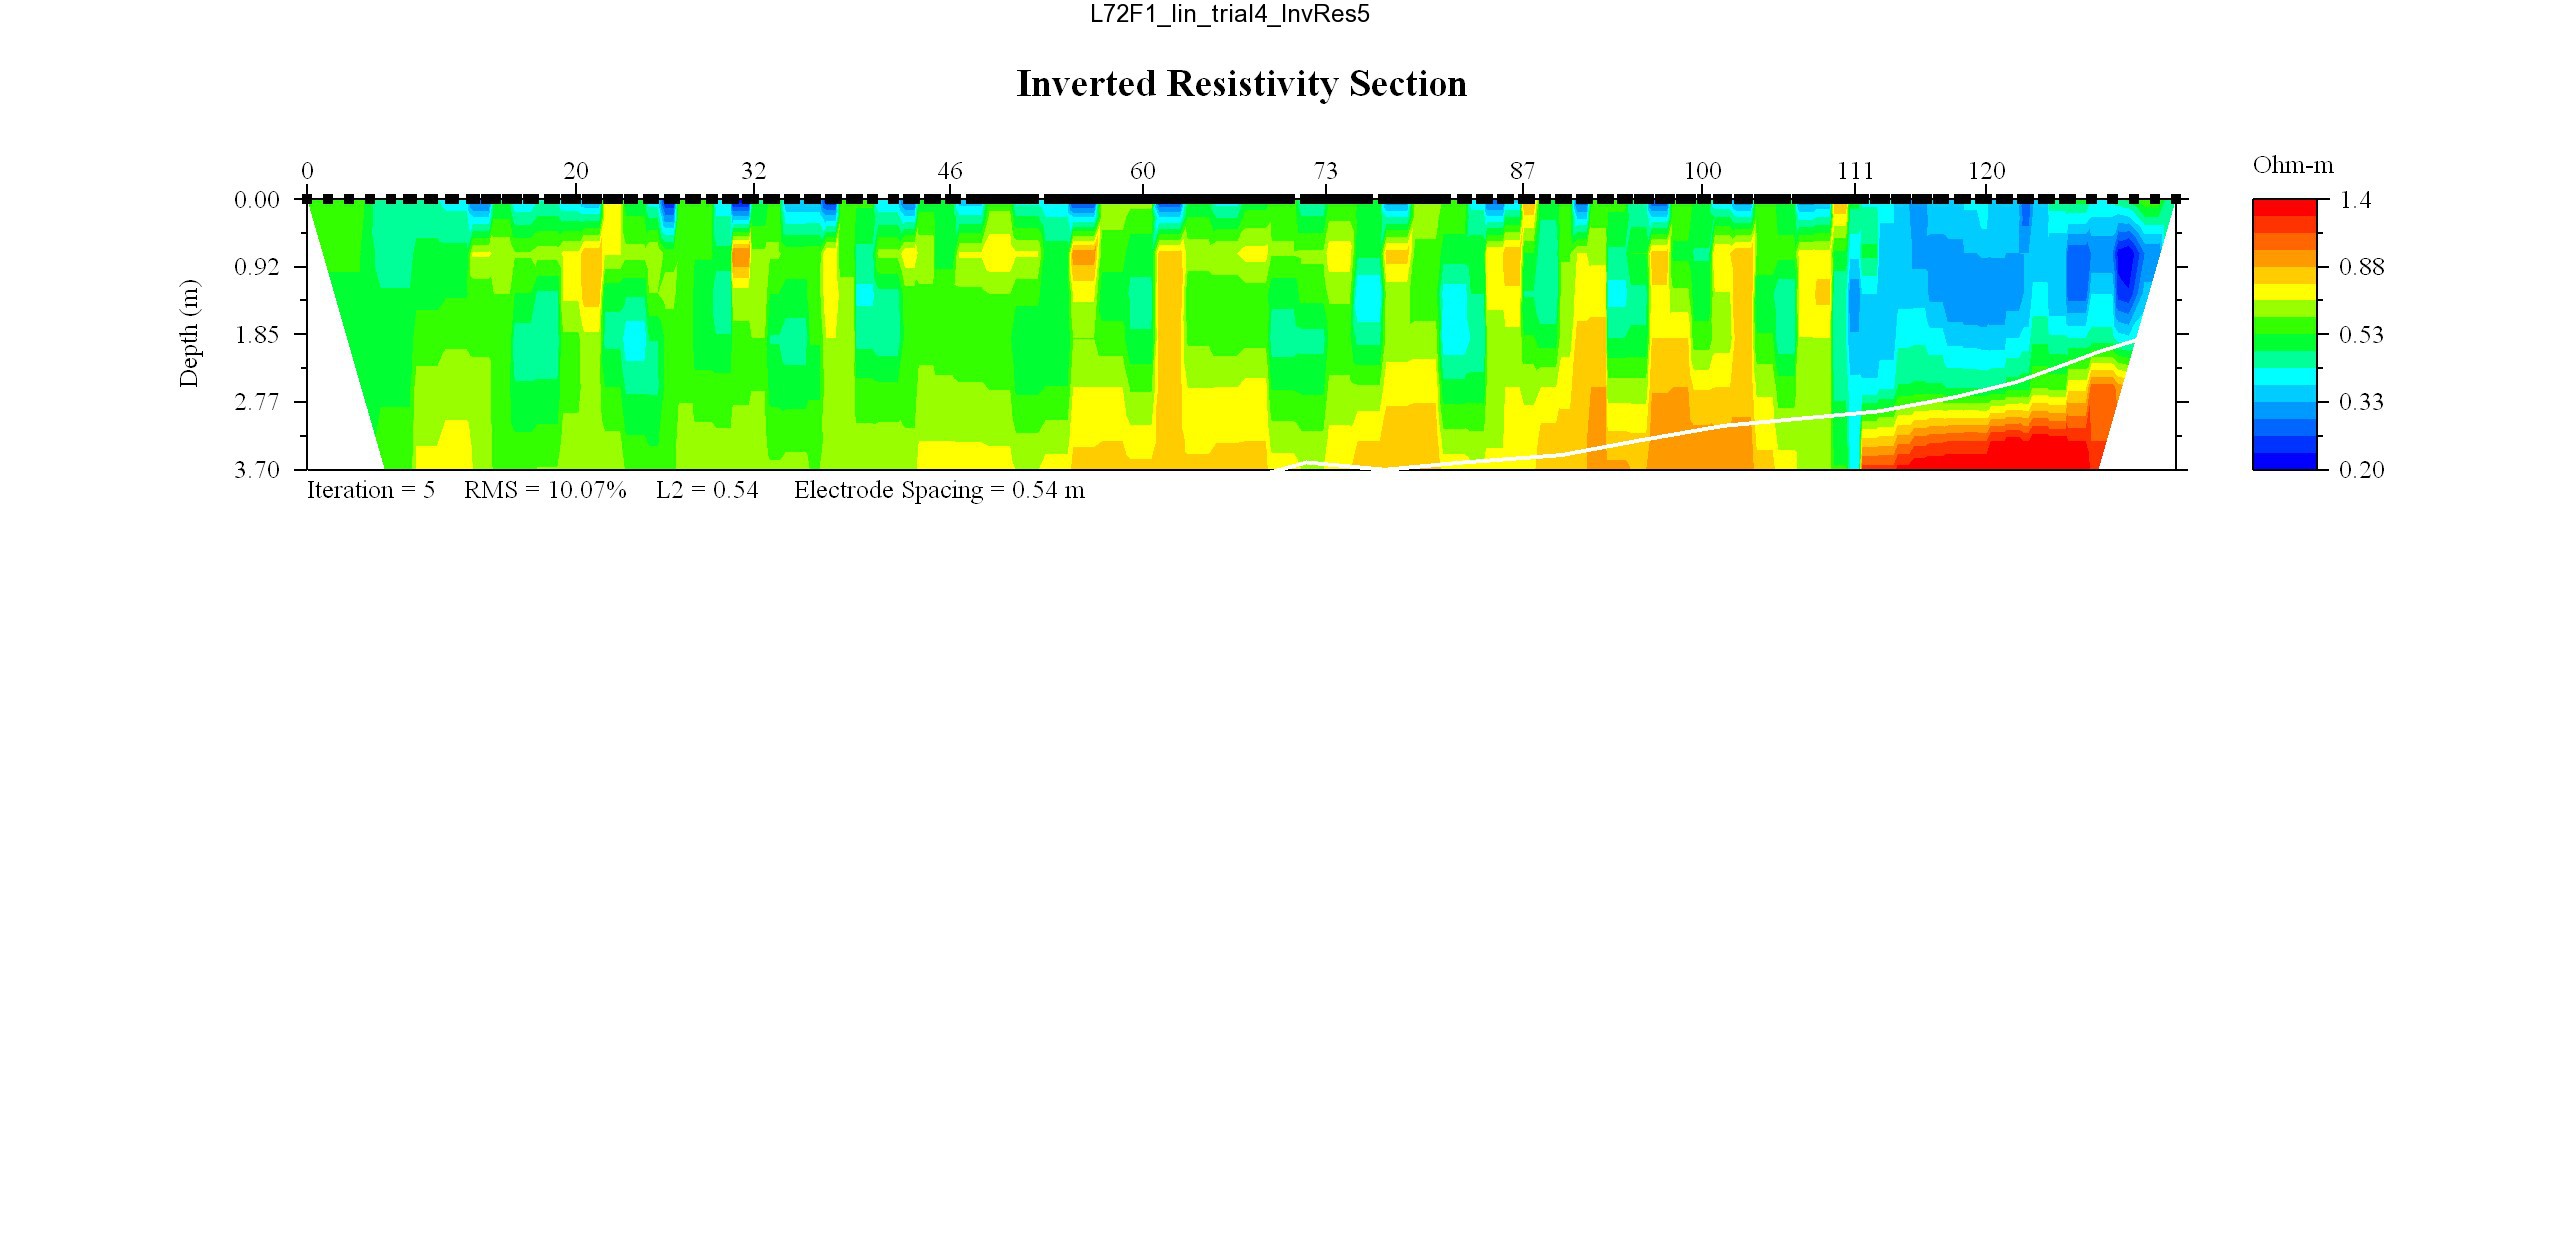
May 17, 2008: Line L73F1, WRES = 0.35
EarthImager thumbnail JPEG image of line 73 resistivity profile.
MATLAB thumbnail JPEG image of line 73 resistivity profile.
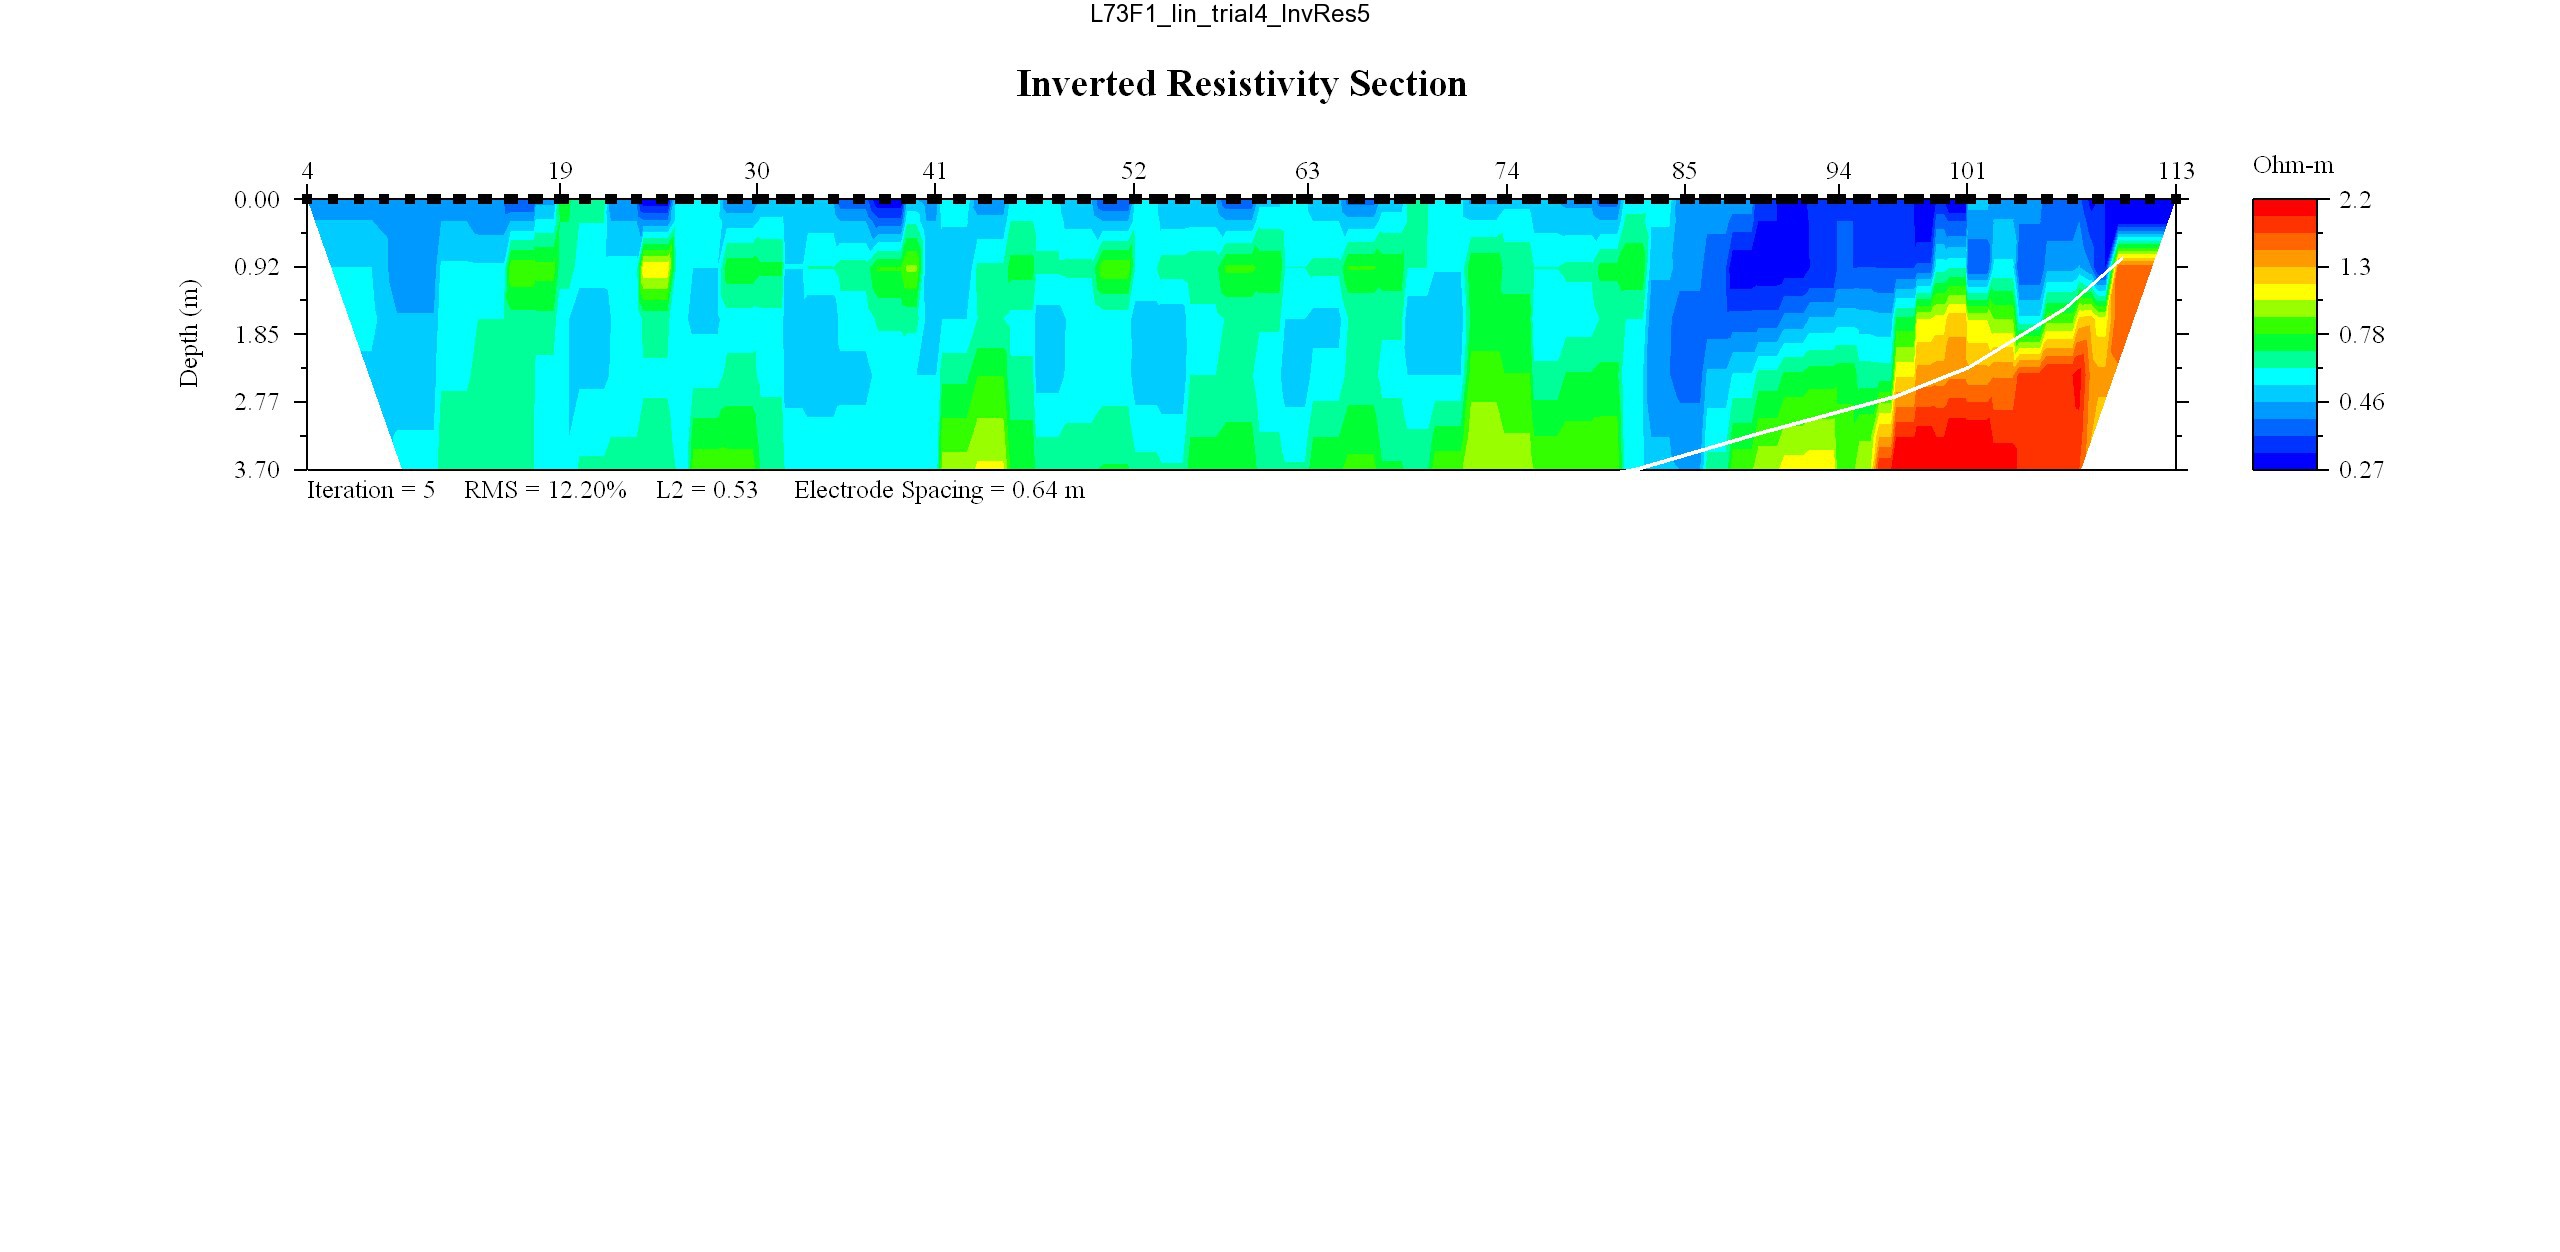
May 17, 2008: Line L74F1, WRES = 0.35
EarthImager thumbnail JPEG image of line 74 resistivity profile.
MATLAB thumbnail JPEG image of line 74 resistivity profile.
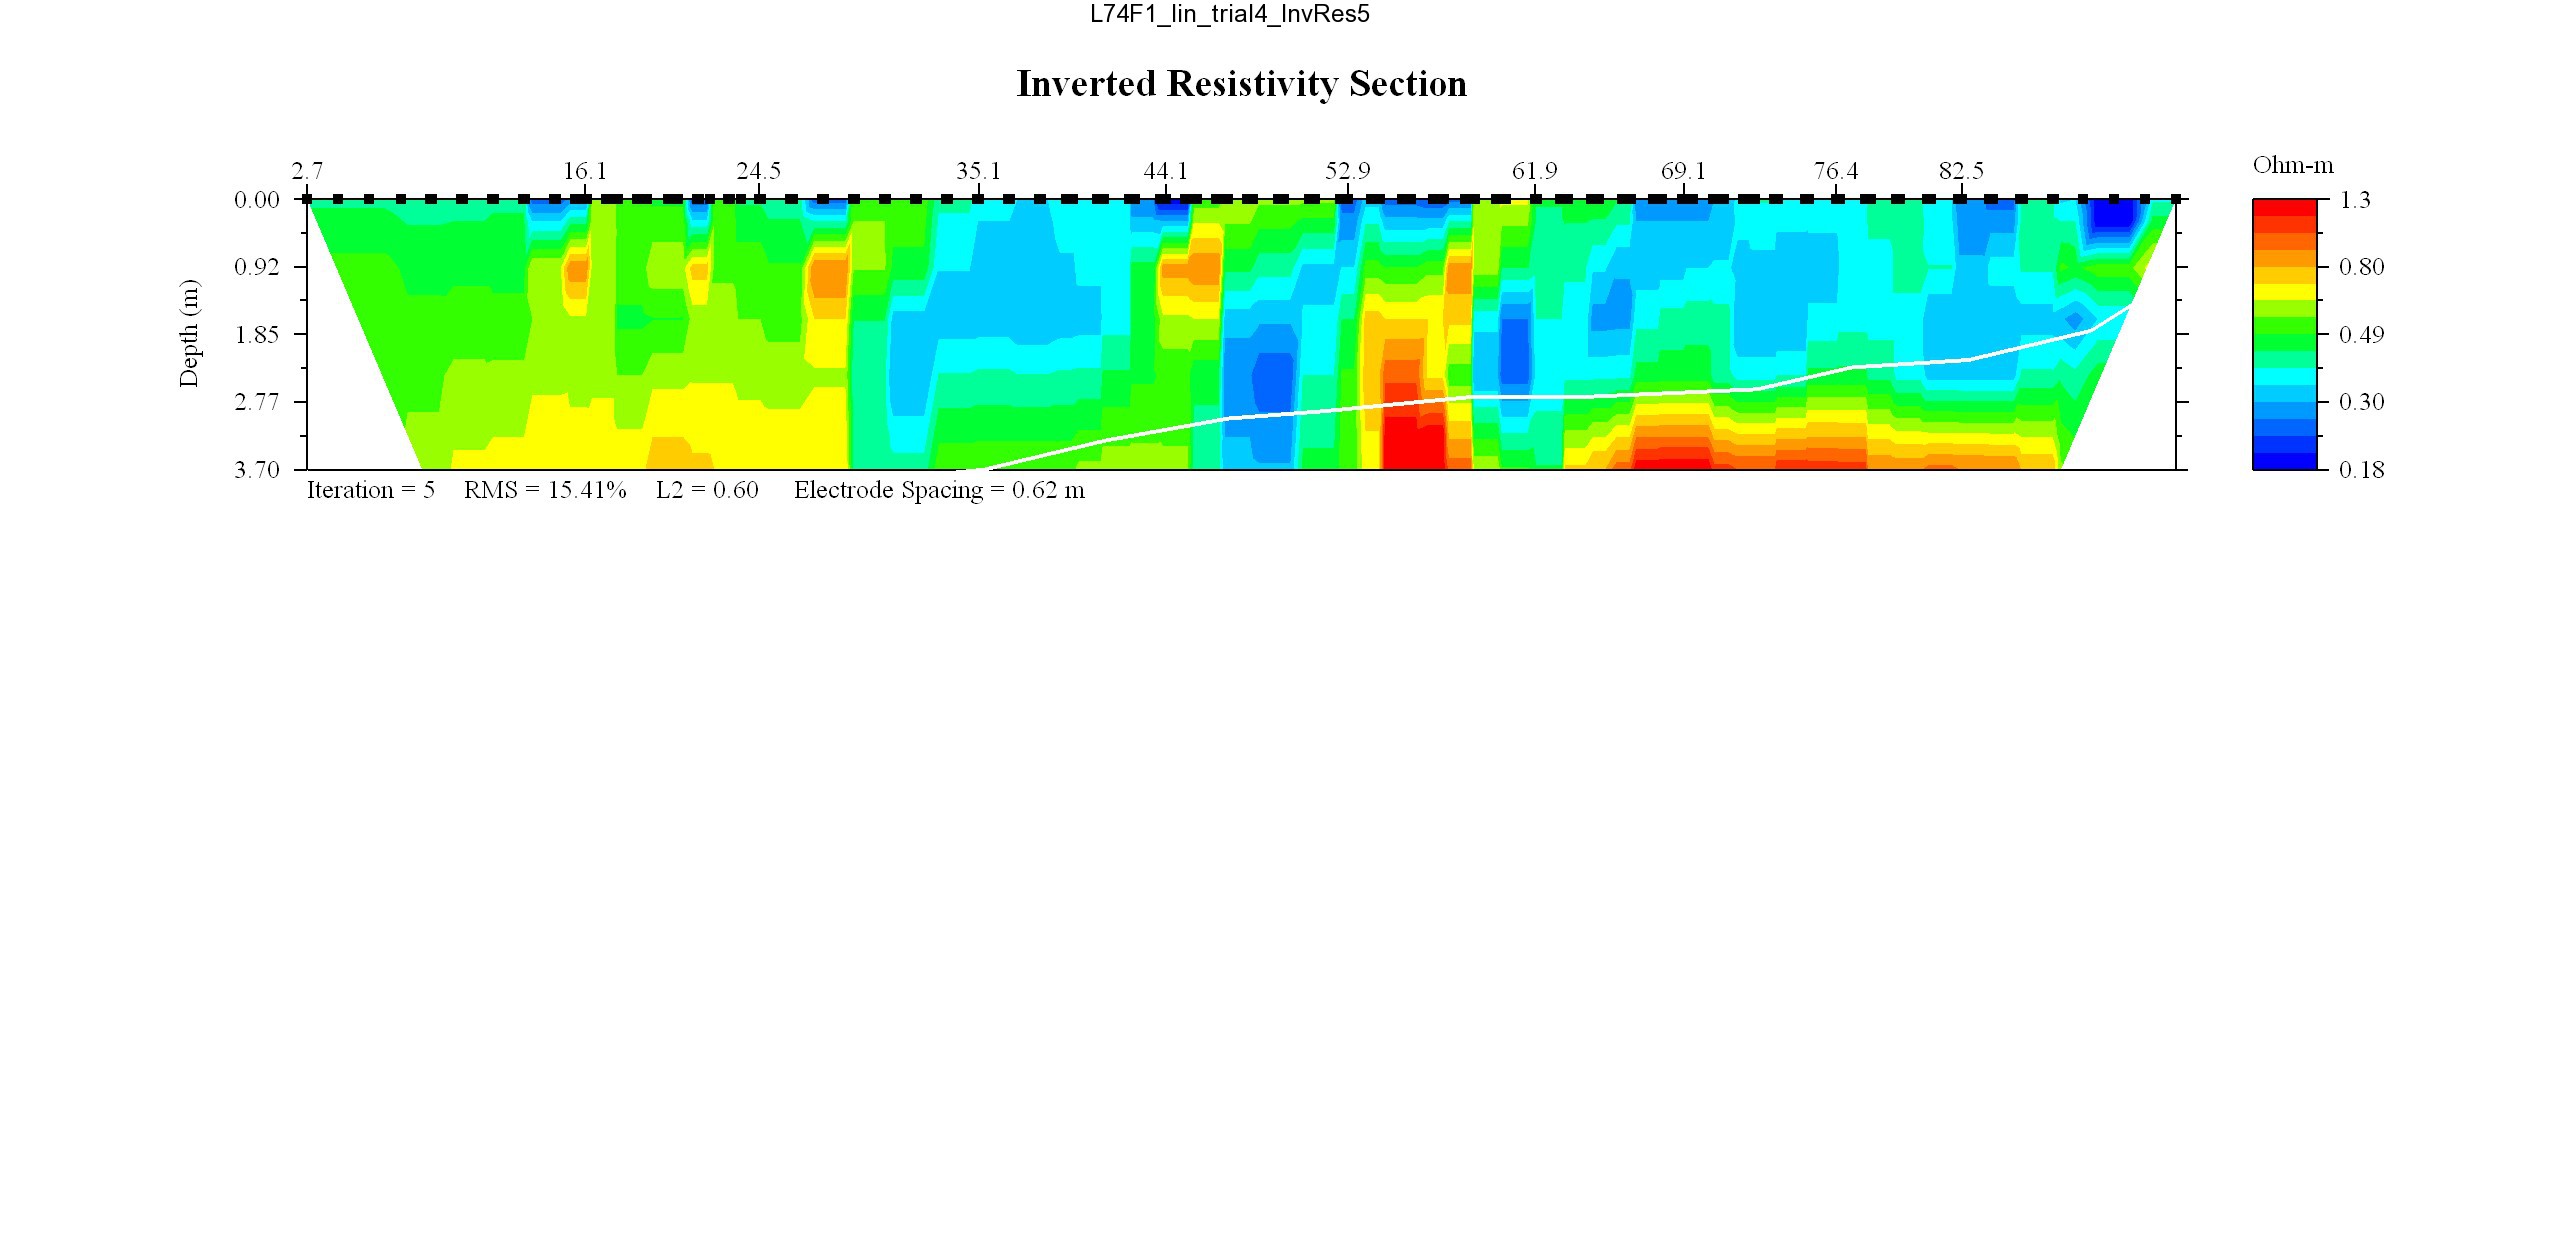
May 17, 2008: Line L75F1, WRES = 0.35
EarthImager thumbnail JPEG image of line 75 resistivity profile.
MATLAB thumbnail JPEG image of line 75 resistivity profile.
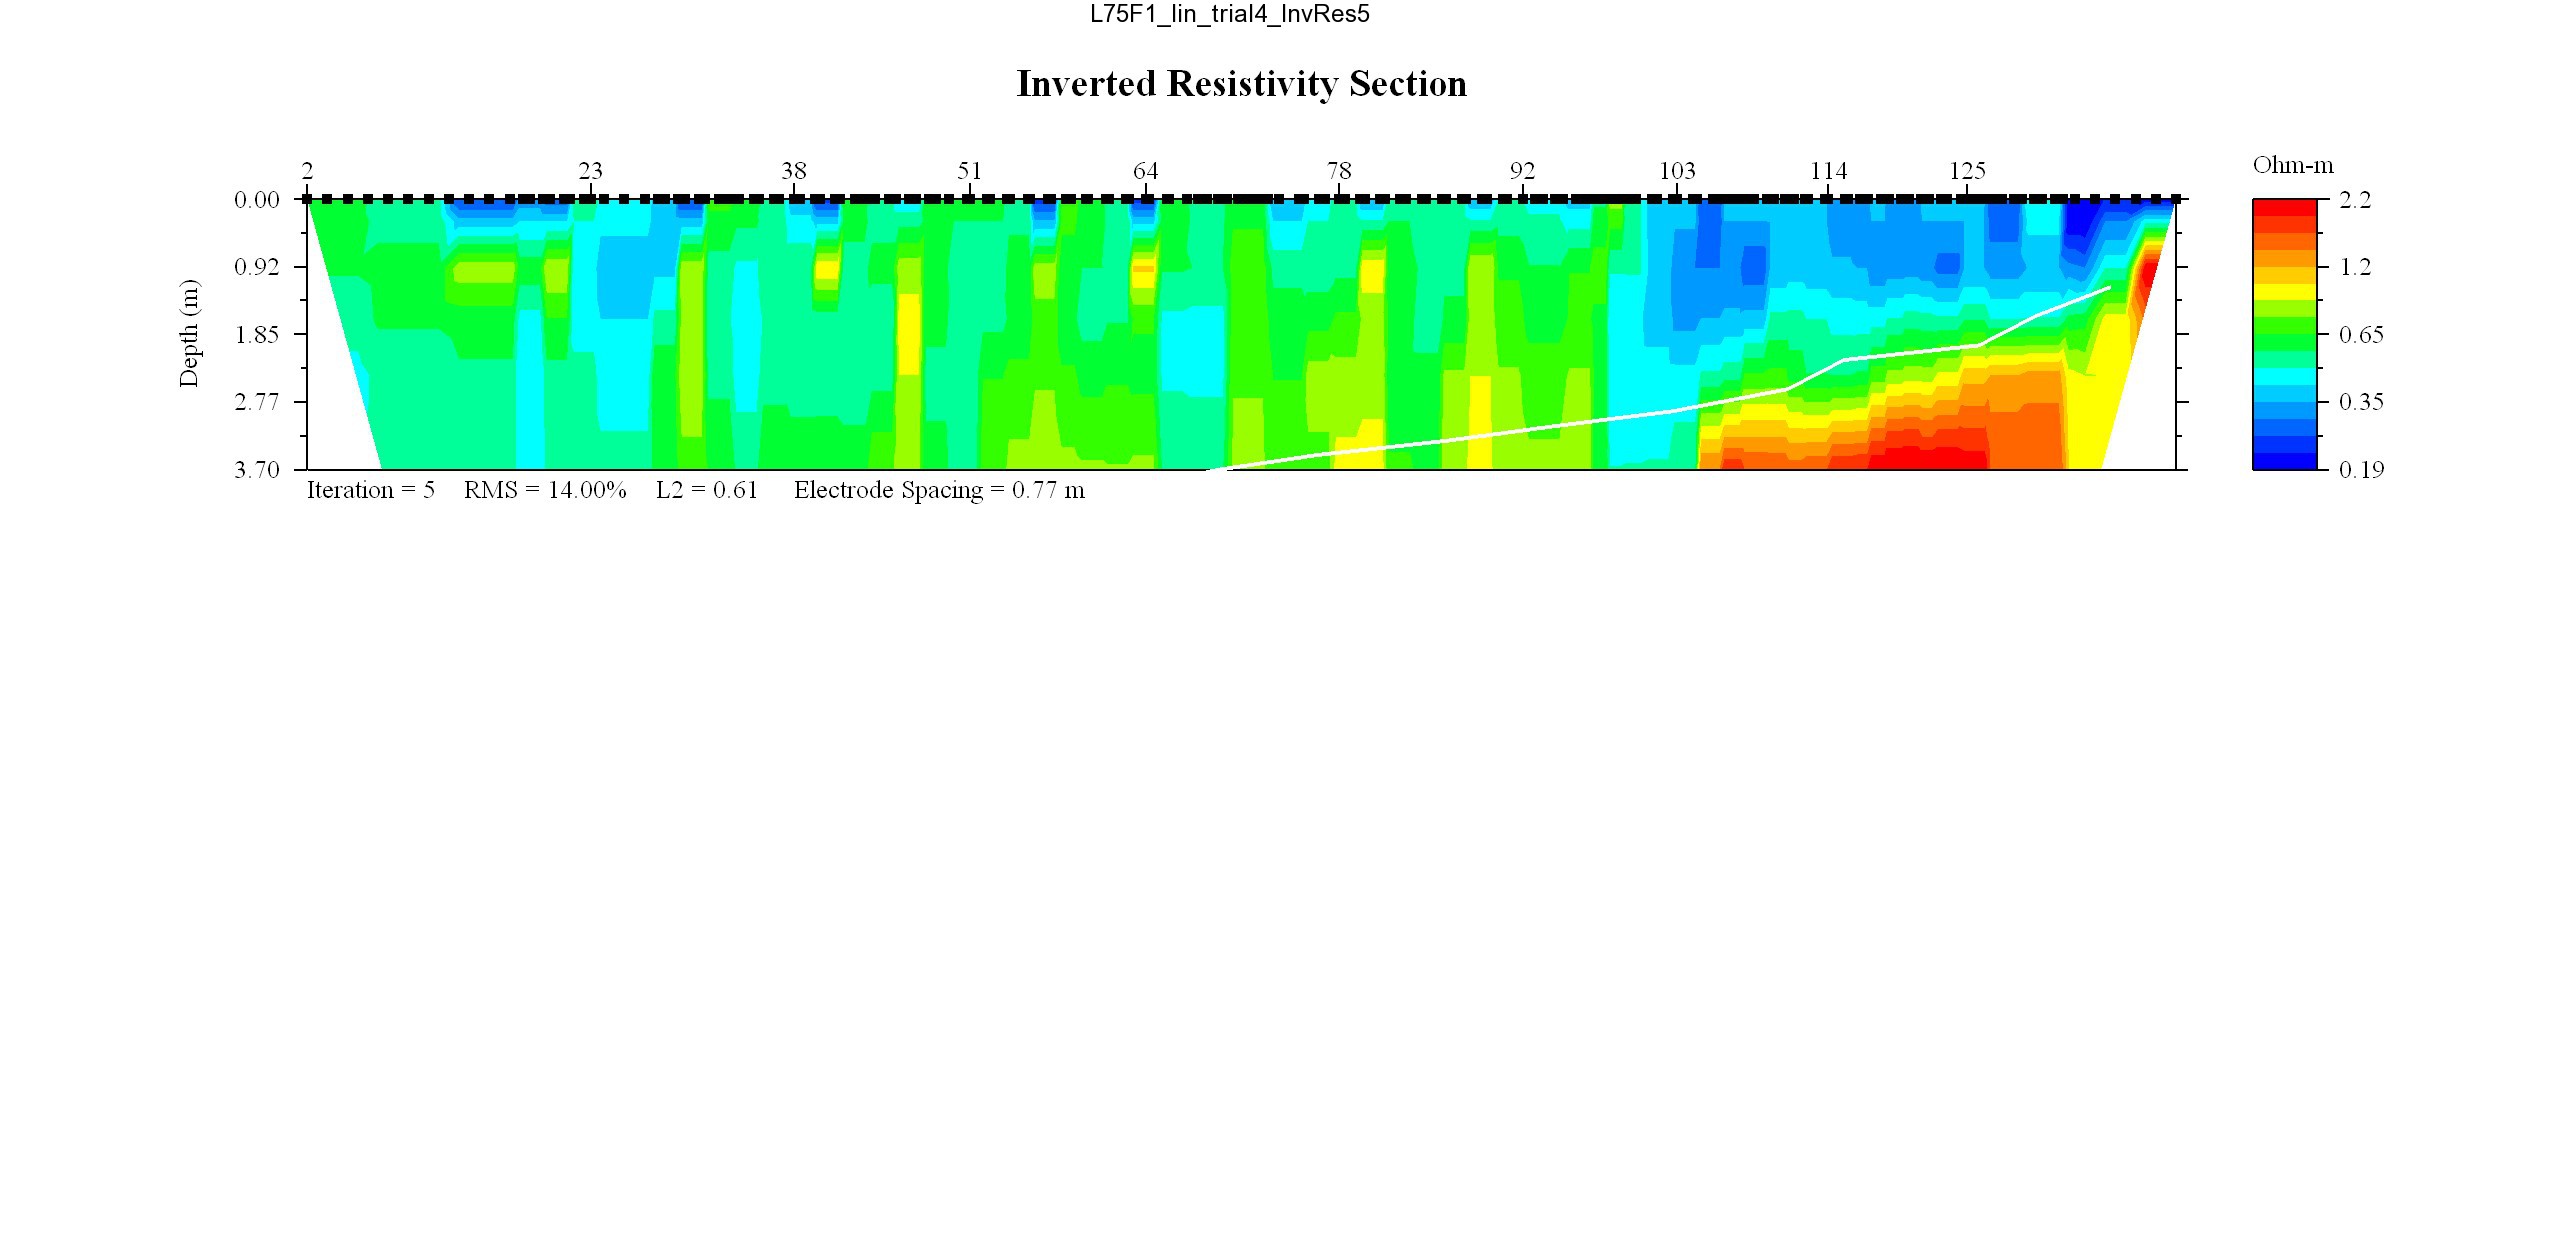
May 17, 2008: Line L76F1, WRES = 0.35
EarthImager thumbnail JPEG image of line 76 resistivity profile.
MATLAB thumbnail JPEG image of line 76 resistivity profile.
May 17, 2008: Line L77F1, WRES = 0.35
EarthImager thumbnail JPEG image of line 77 resistivity profile.
MATLAB thumbnail JPEG image of line 77 resistivity profile.
May 17, 2008: Line L78F1, WRES = 0.35
EarthImager thumbnail JPEG image of line 78 resistivity and temperature profile.
MATLAB thumbnail JPEG image of line 78 resistivity profile.
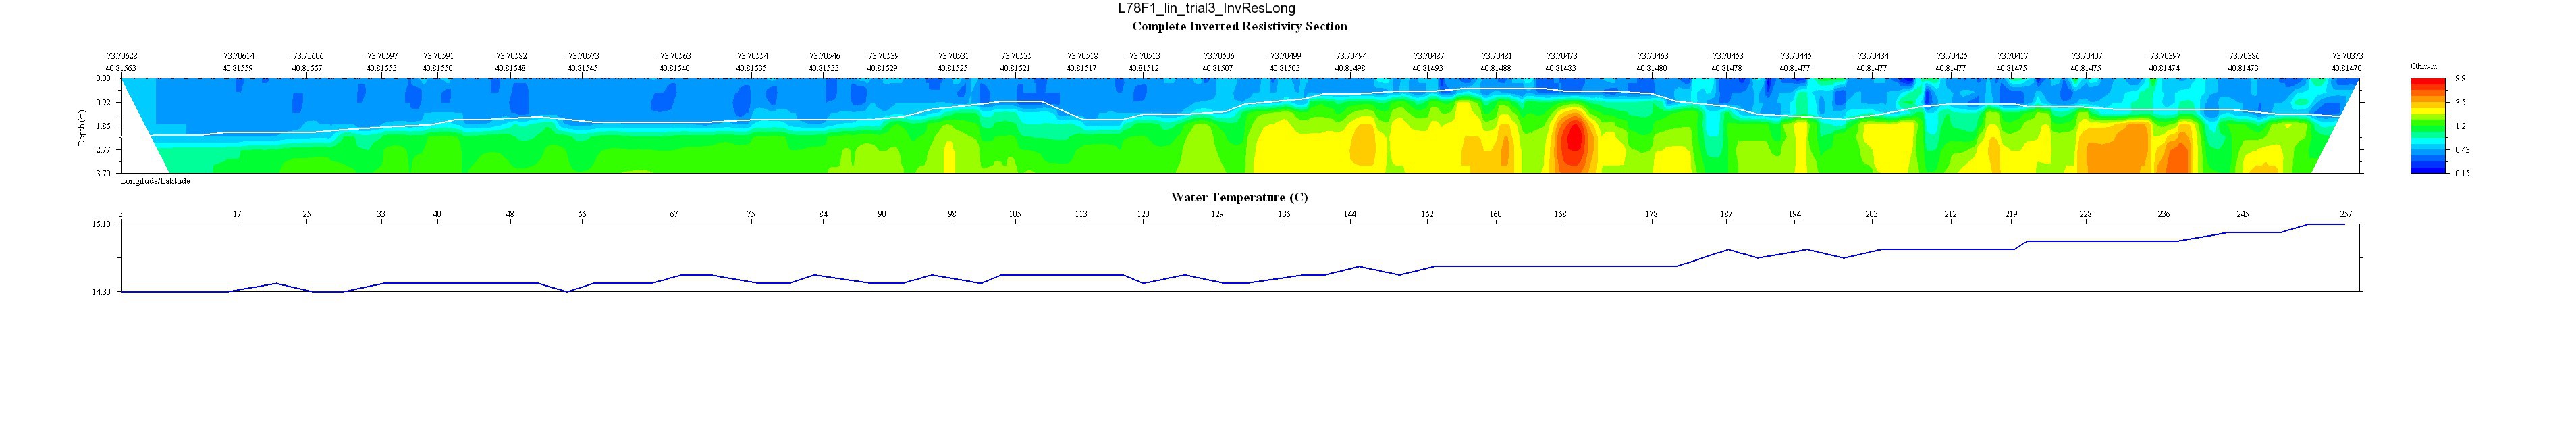
May 17, 2008: Line L79F1, WRES = 0.35
EarthImager thumbnail JPEG image of line 79 resistivity profile.
MATLAB thumbnail JPEG image of line 79 resistivity profile.
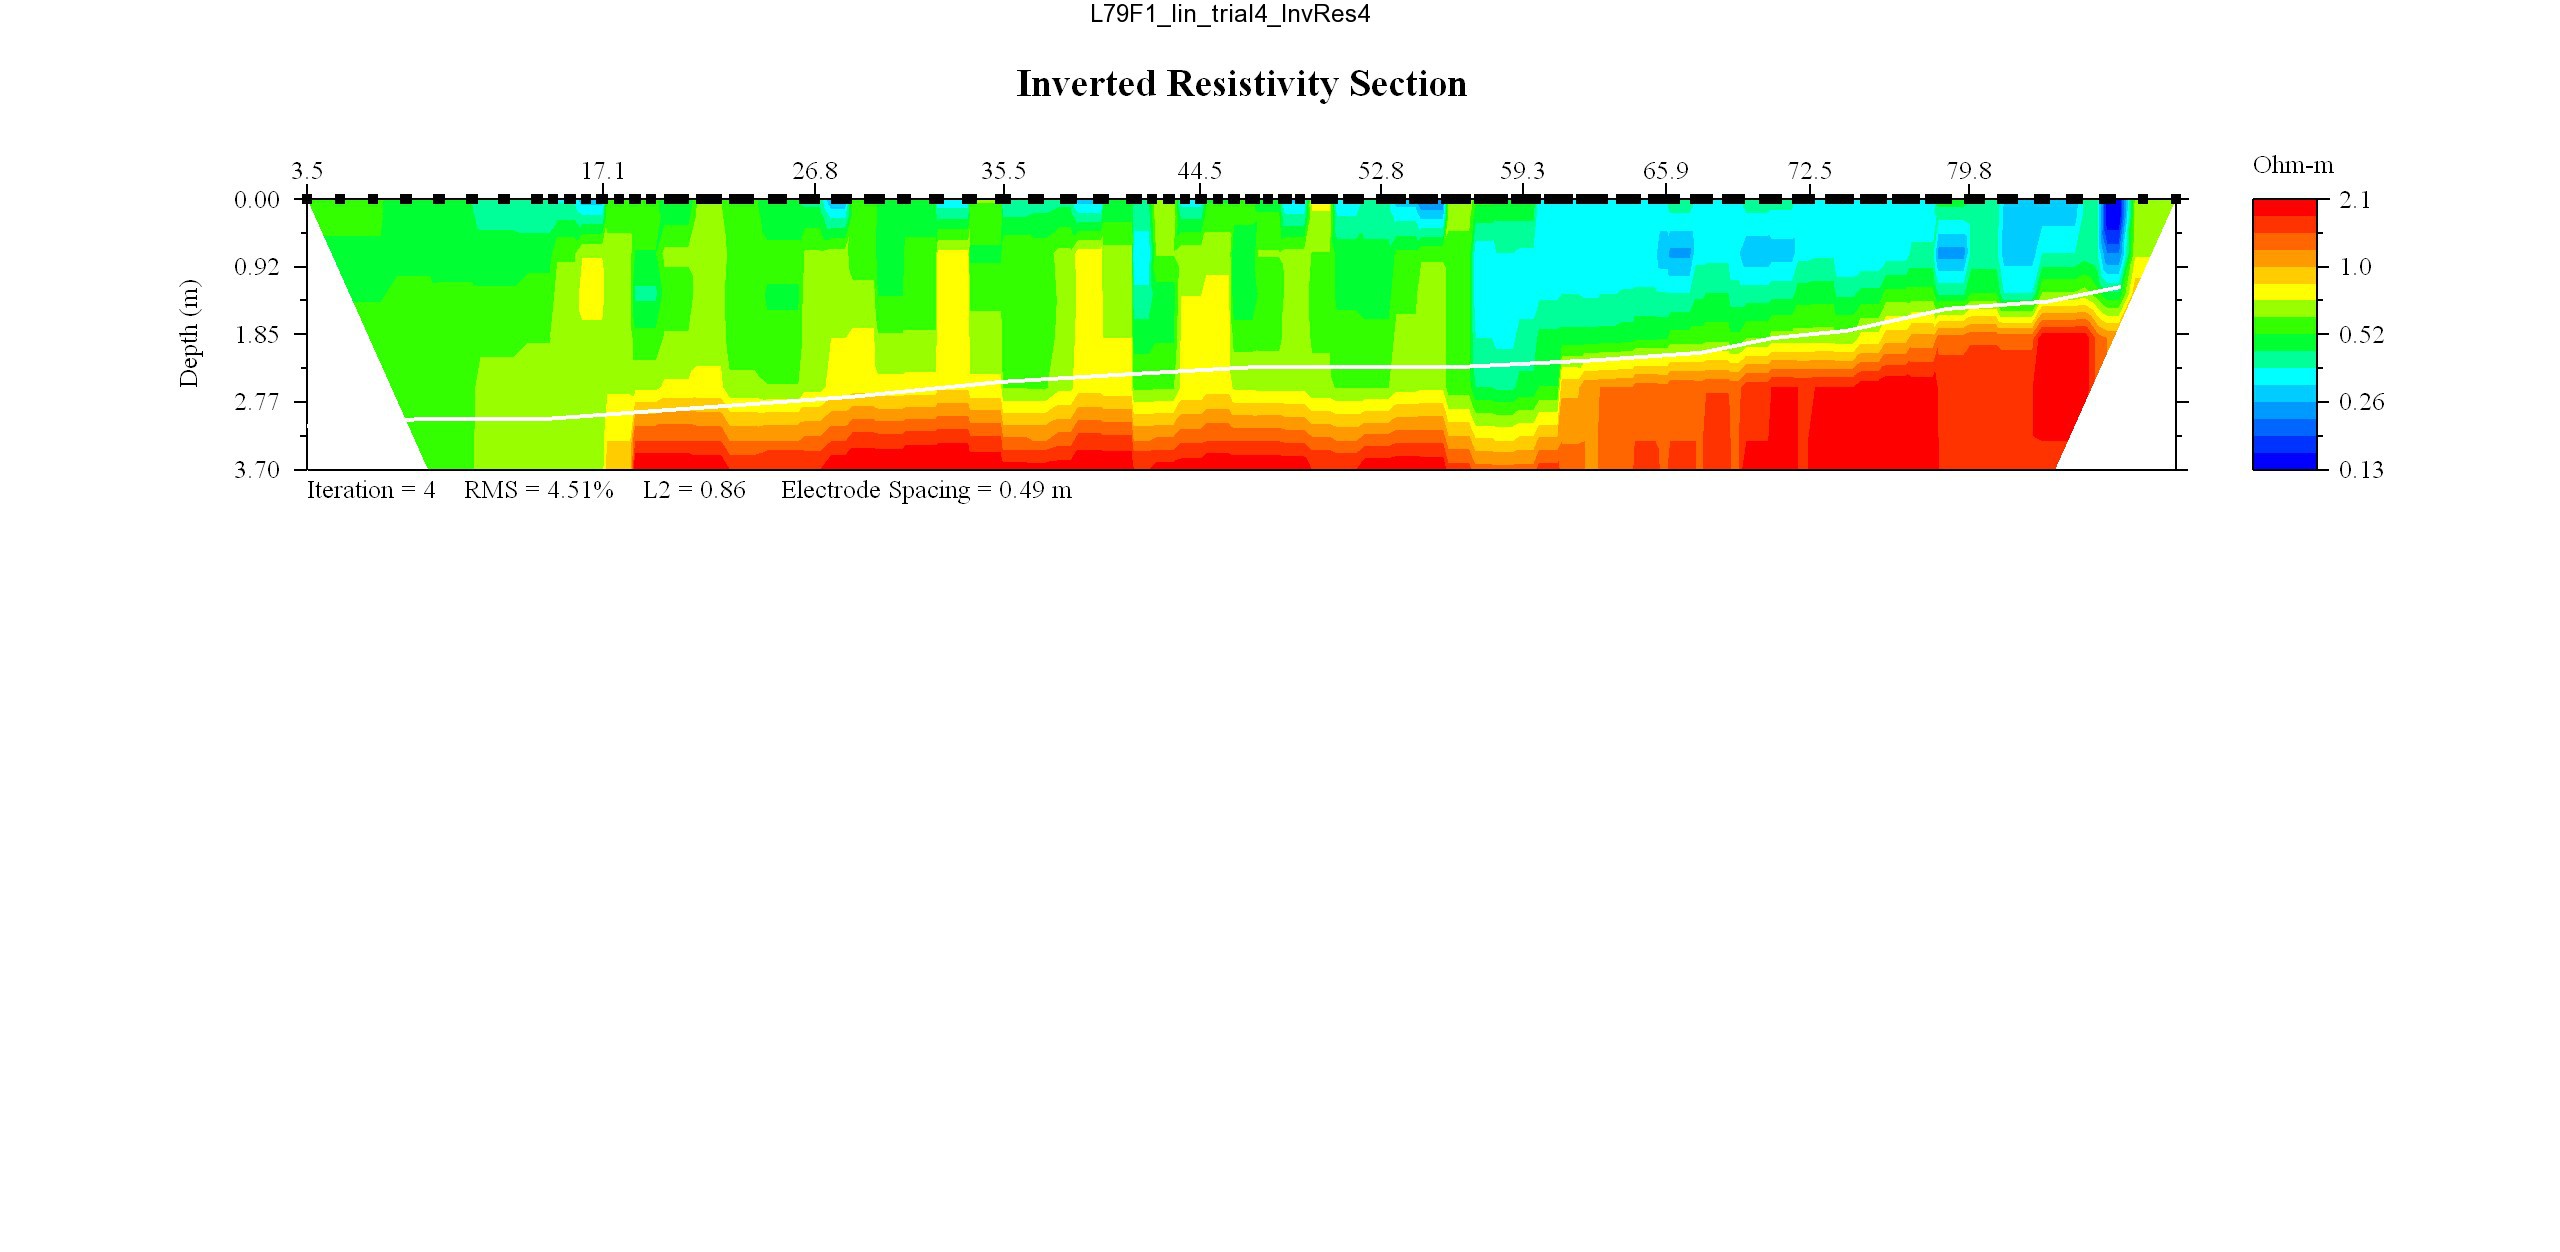
May 17, 2008: Line L80F1, WRES = 0.35
EarthImager thumbnail JPEG image of line 80 resistivity profile.
MATLAB thumbnail JPEG image of line 80 resistivity profile.
May 17, 2008: Line L81F1, WRES = 0.35
EarthImager thumbnail JPEG image of line 81 resistivity profile.
MATLAB thumbnail JPEG image of line 81 resistivity profile.
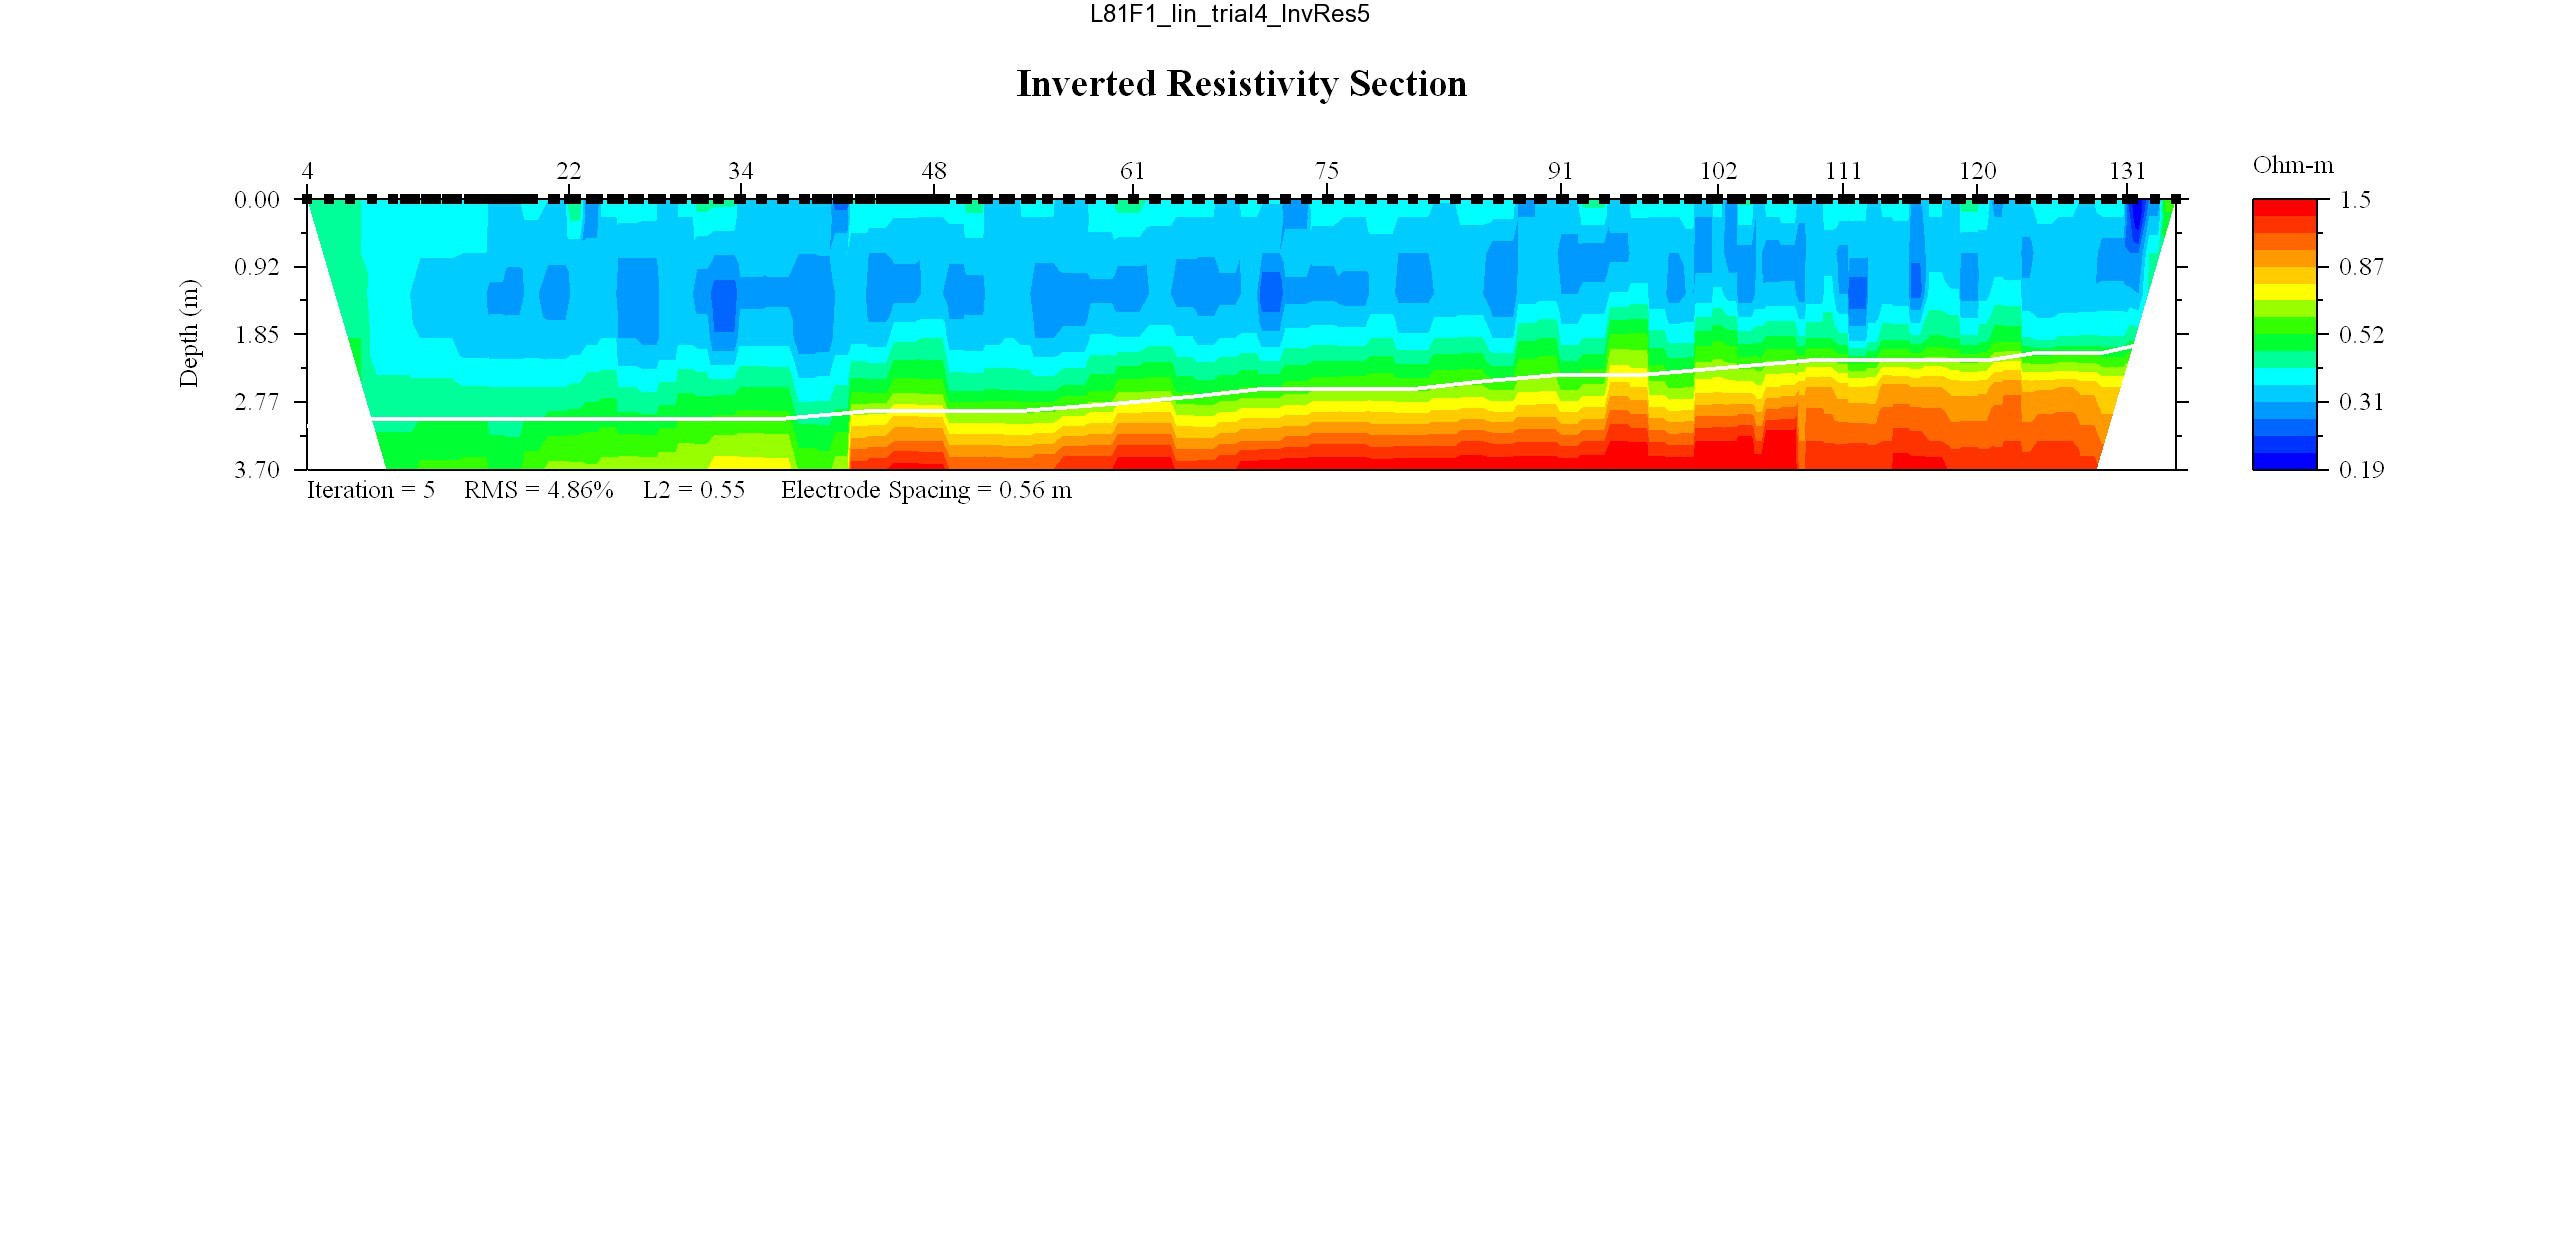
May 17, 2008: Line L82F1, WRES = 0.35
EarthImager thumbnail JPEG image of line 82 resistivity profile.
MATLAB thumbnail JPEG image of line 82 resistivity profile.
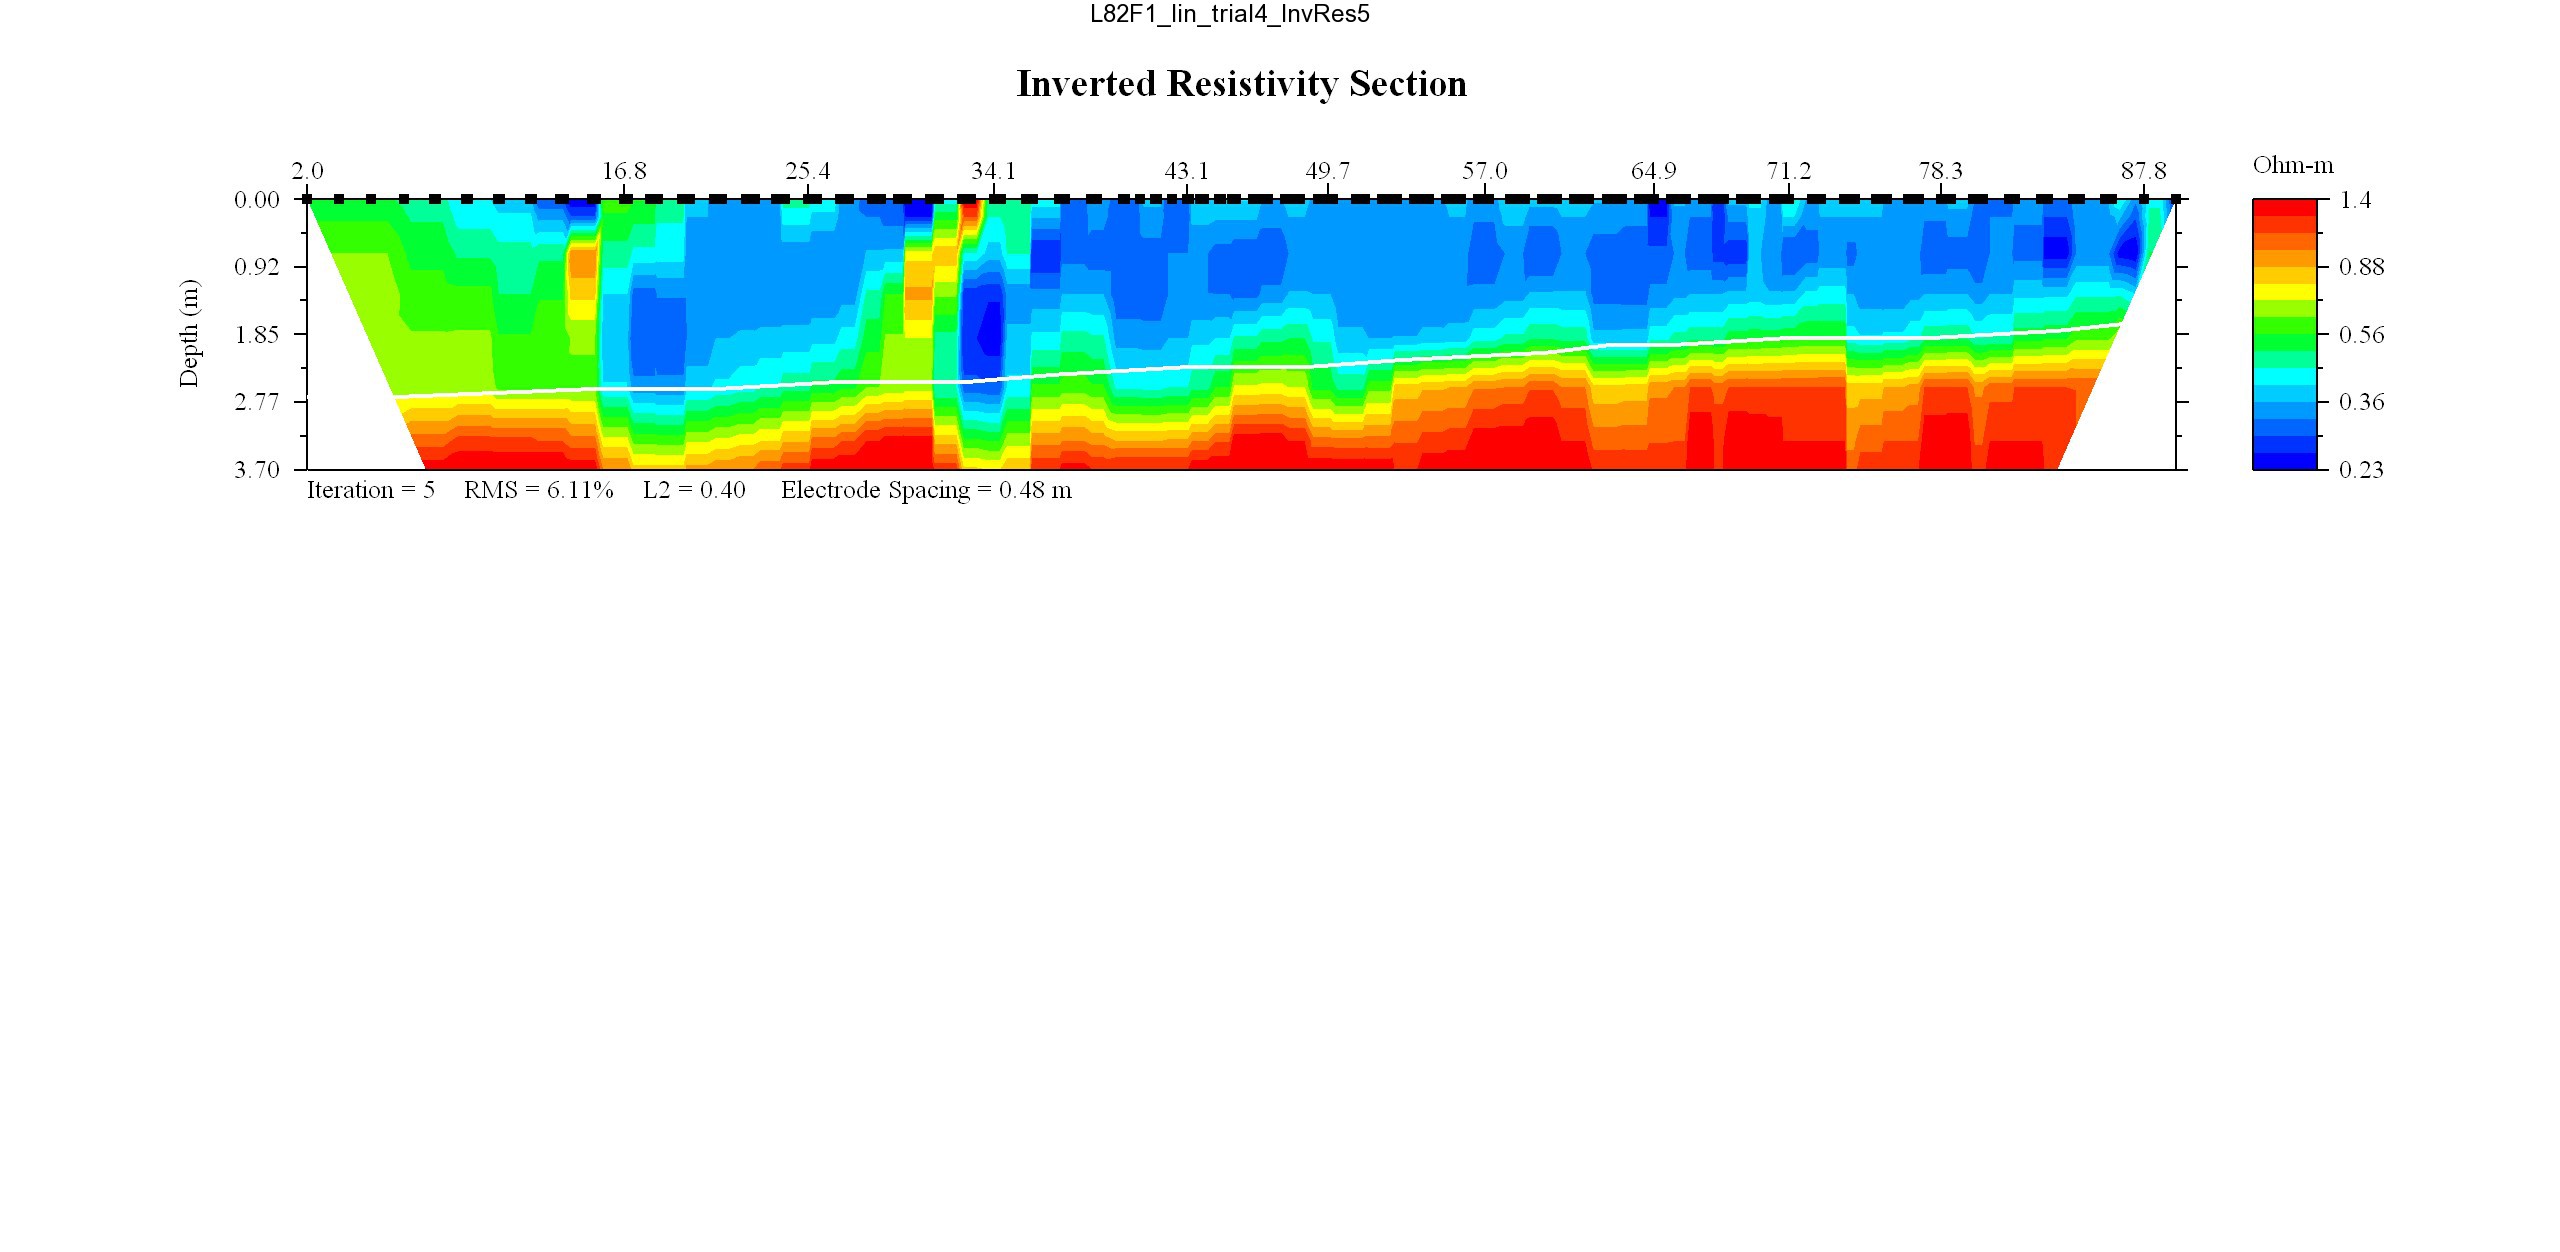
May 17, 2008: Line L83F1, WRES = 0.35
EarthImager thumbnail JPEG image of line 83 resistivity profile.
MATLAB thumbnail JPEG image of line 83 resistivity profiley.
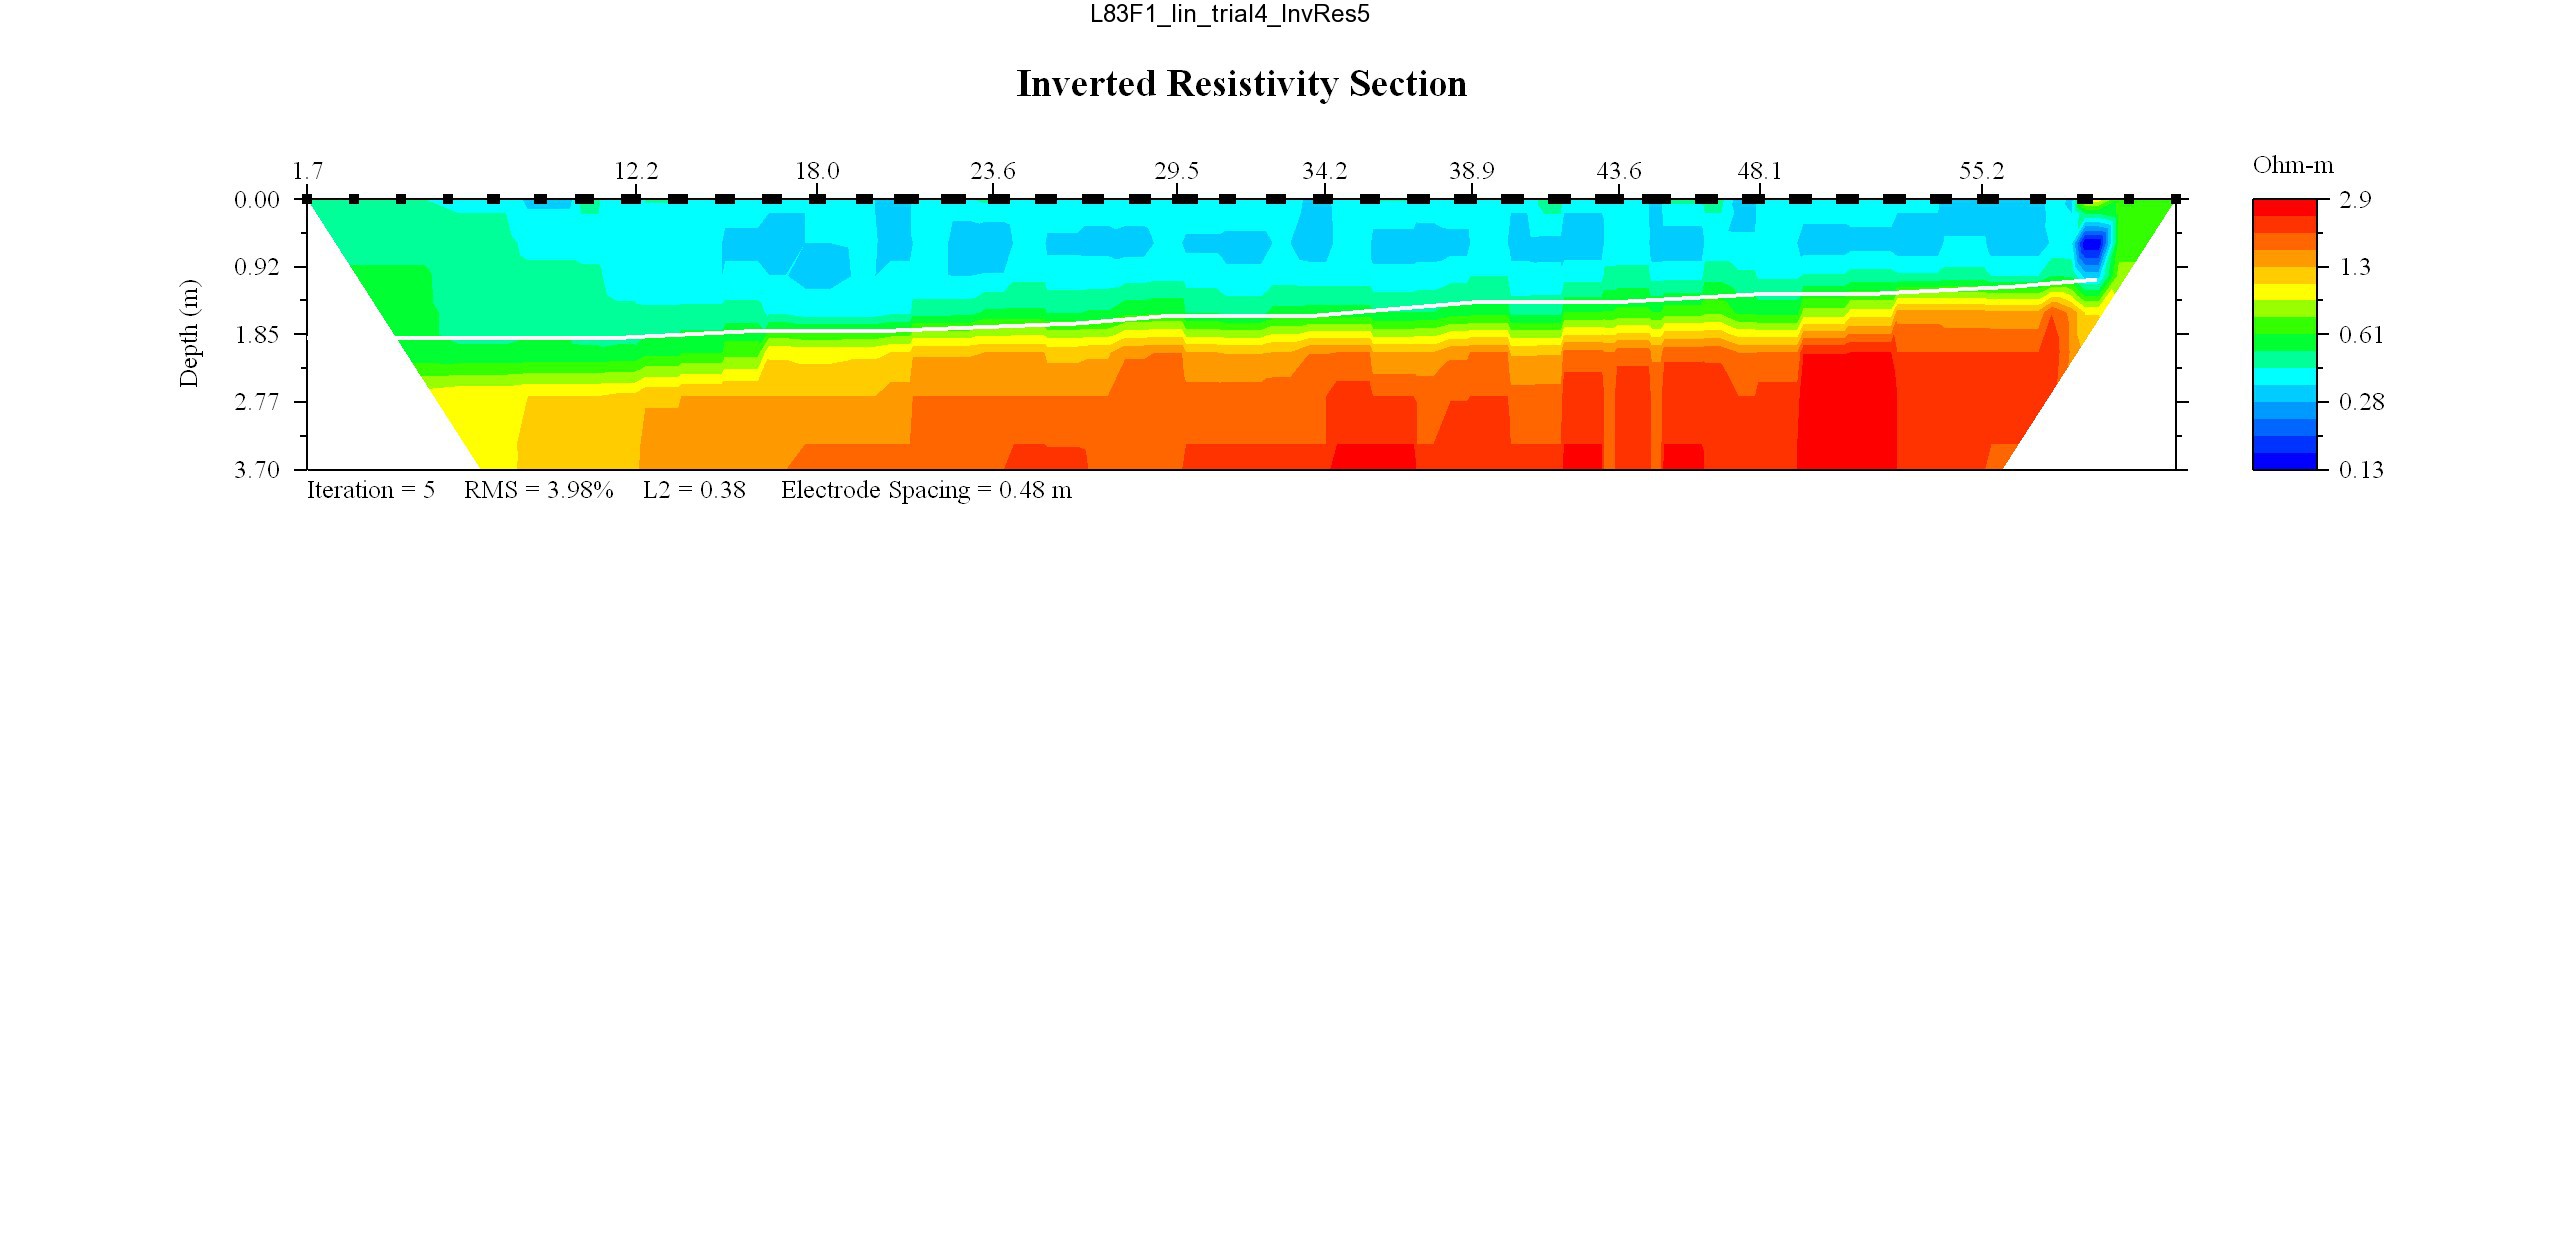
May 17, 2008: Line L84F1, WRES = 0.35
EarthImager thumbnail JPEG image of line 84 resistivity profile.
MATLAB thumbnail JPEG image of line 84 resistivity profile.
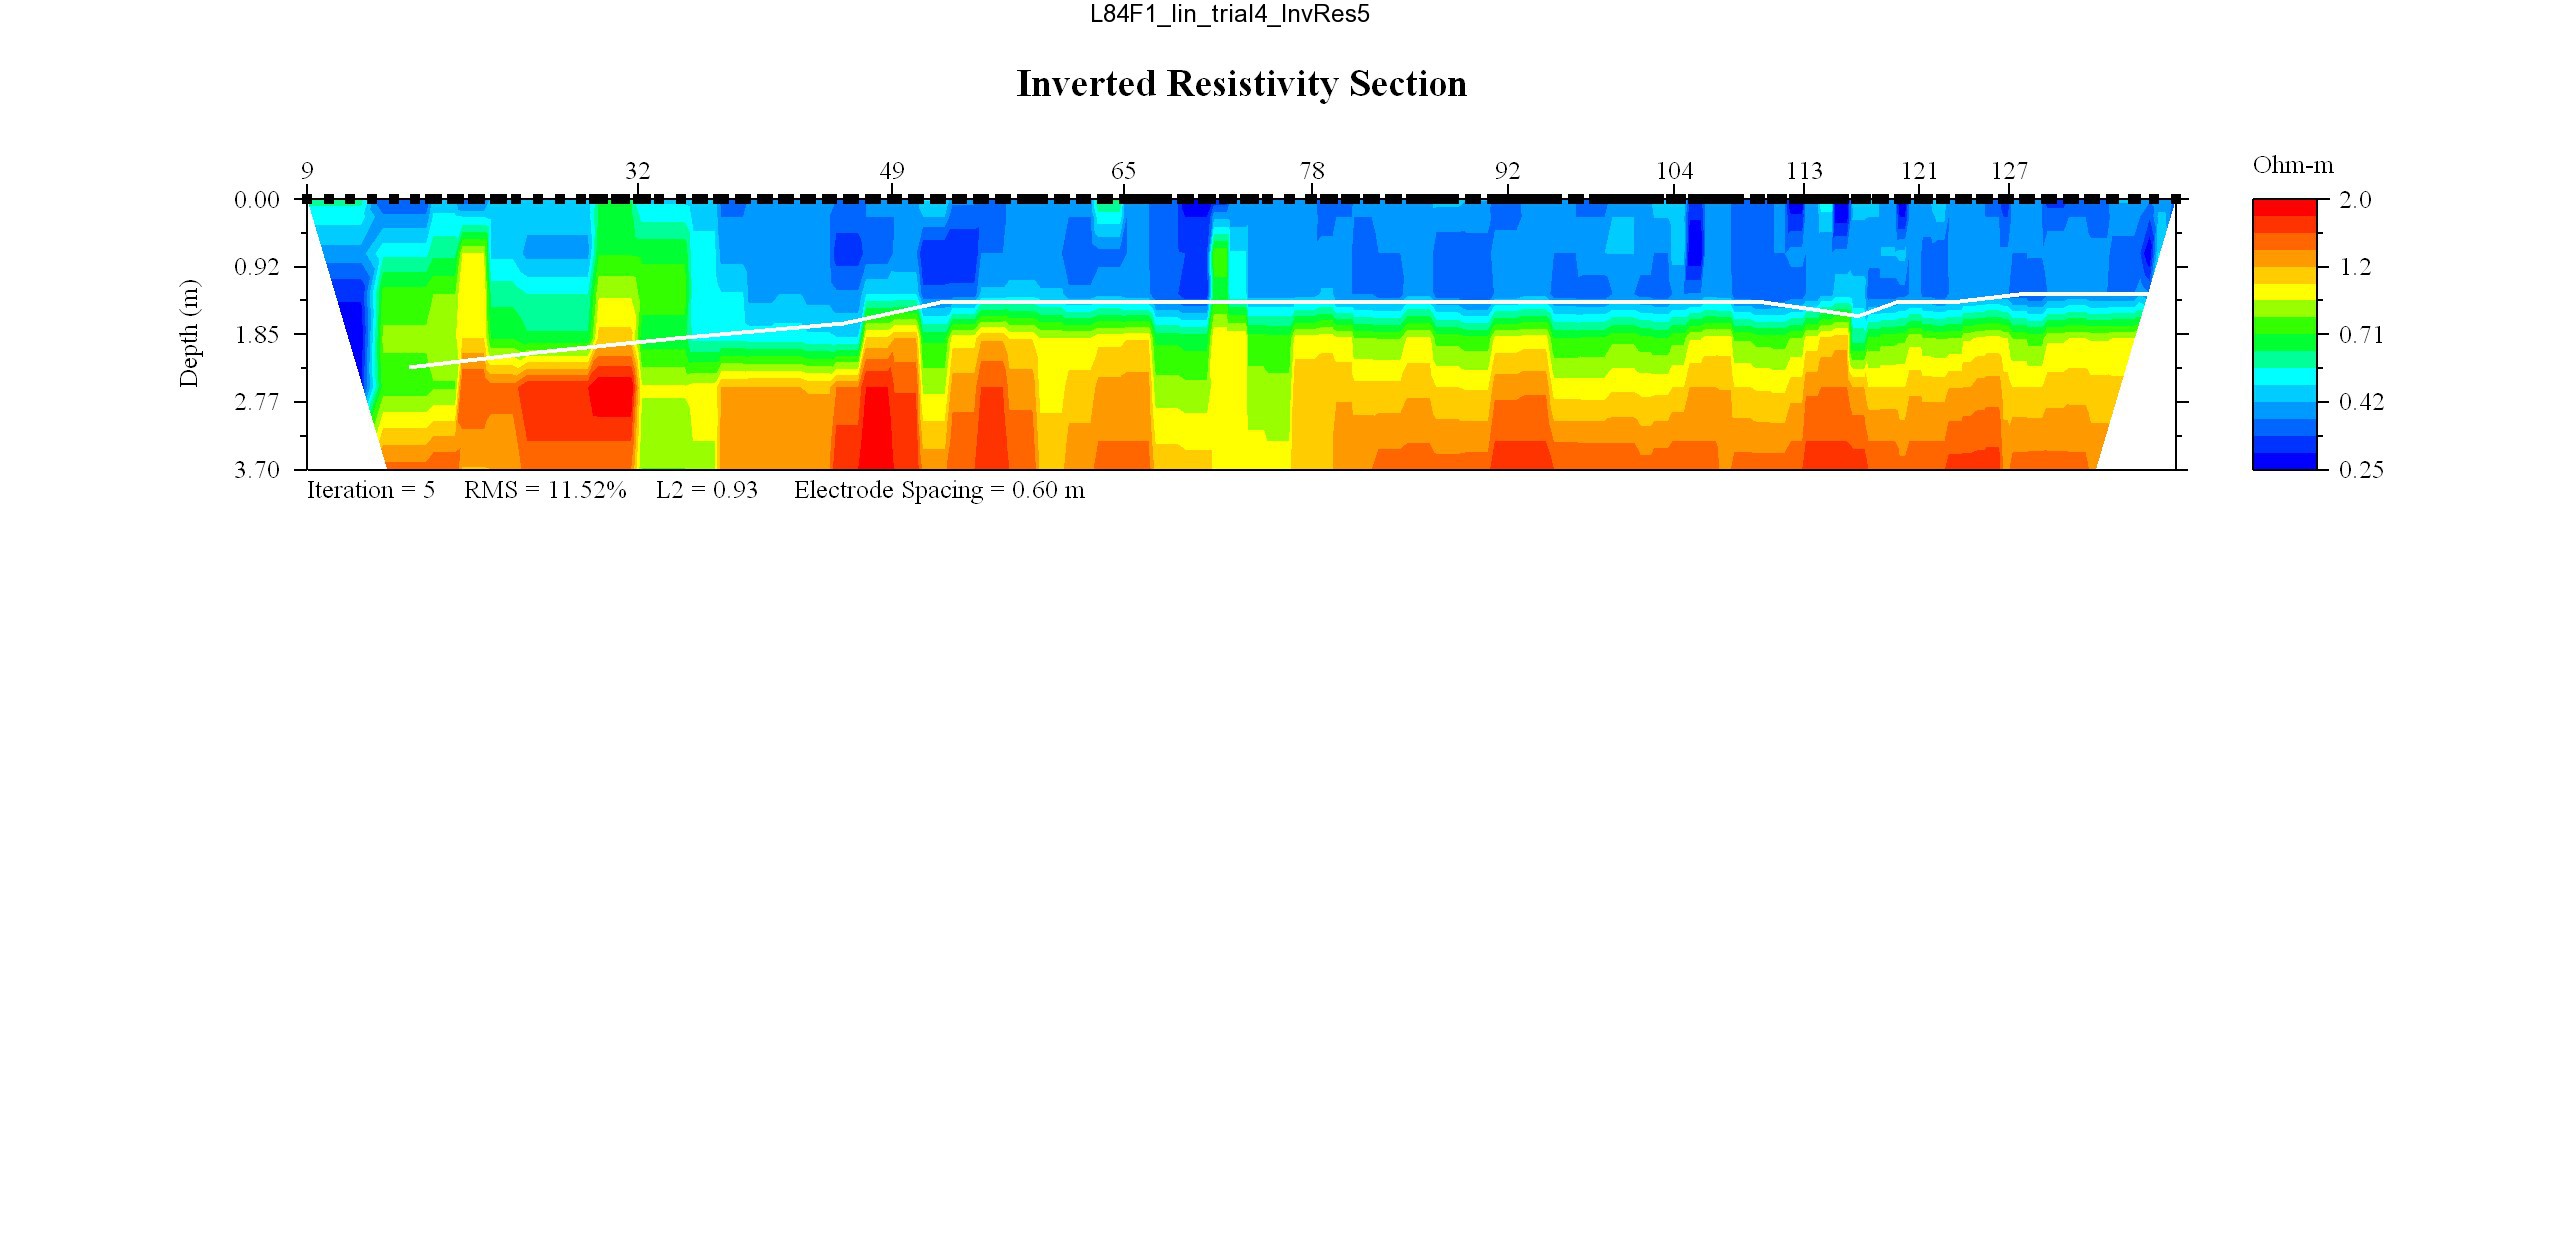
May 17, 2008: Line L85F1, WRES = 0.35
EarthImager thumbnail JPEG image of line 85 resistivity profile.
MATLAB thumbnail JPEG image of line 85 resistivity profile.
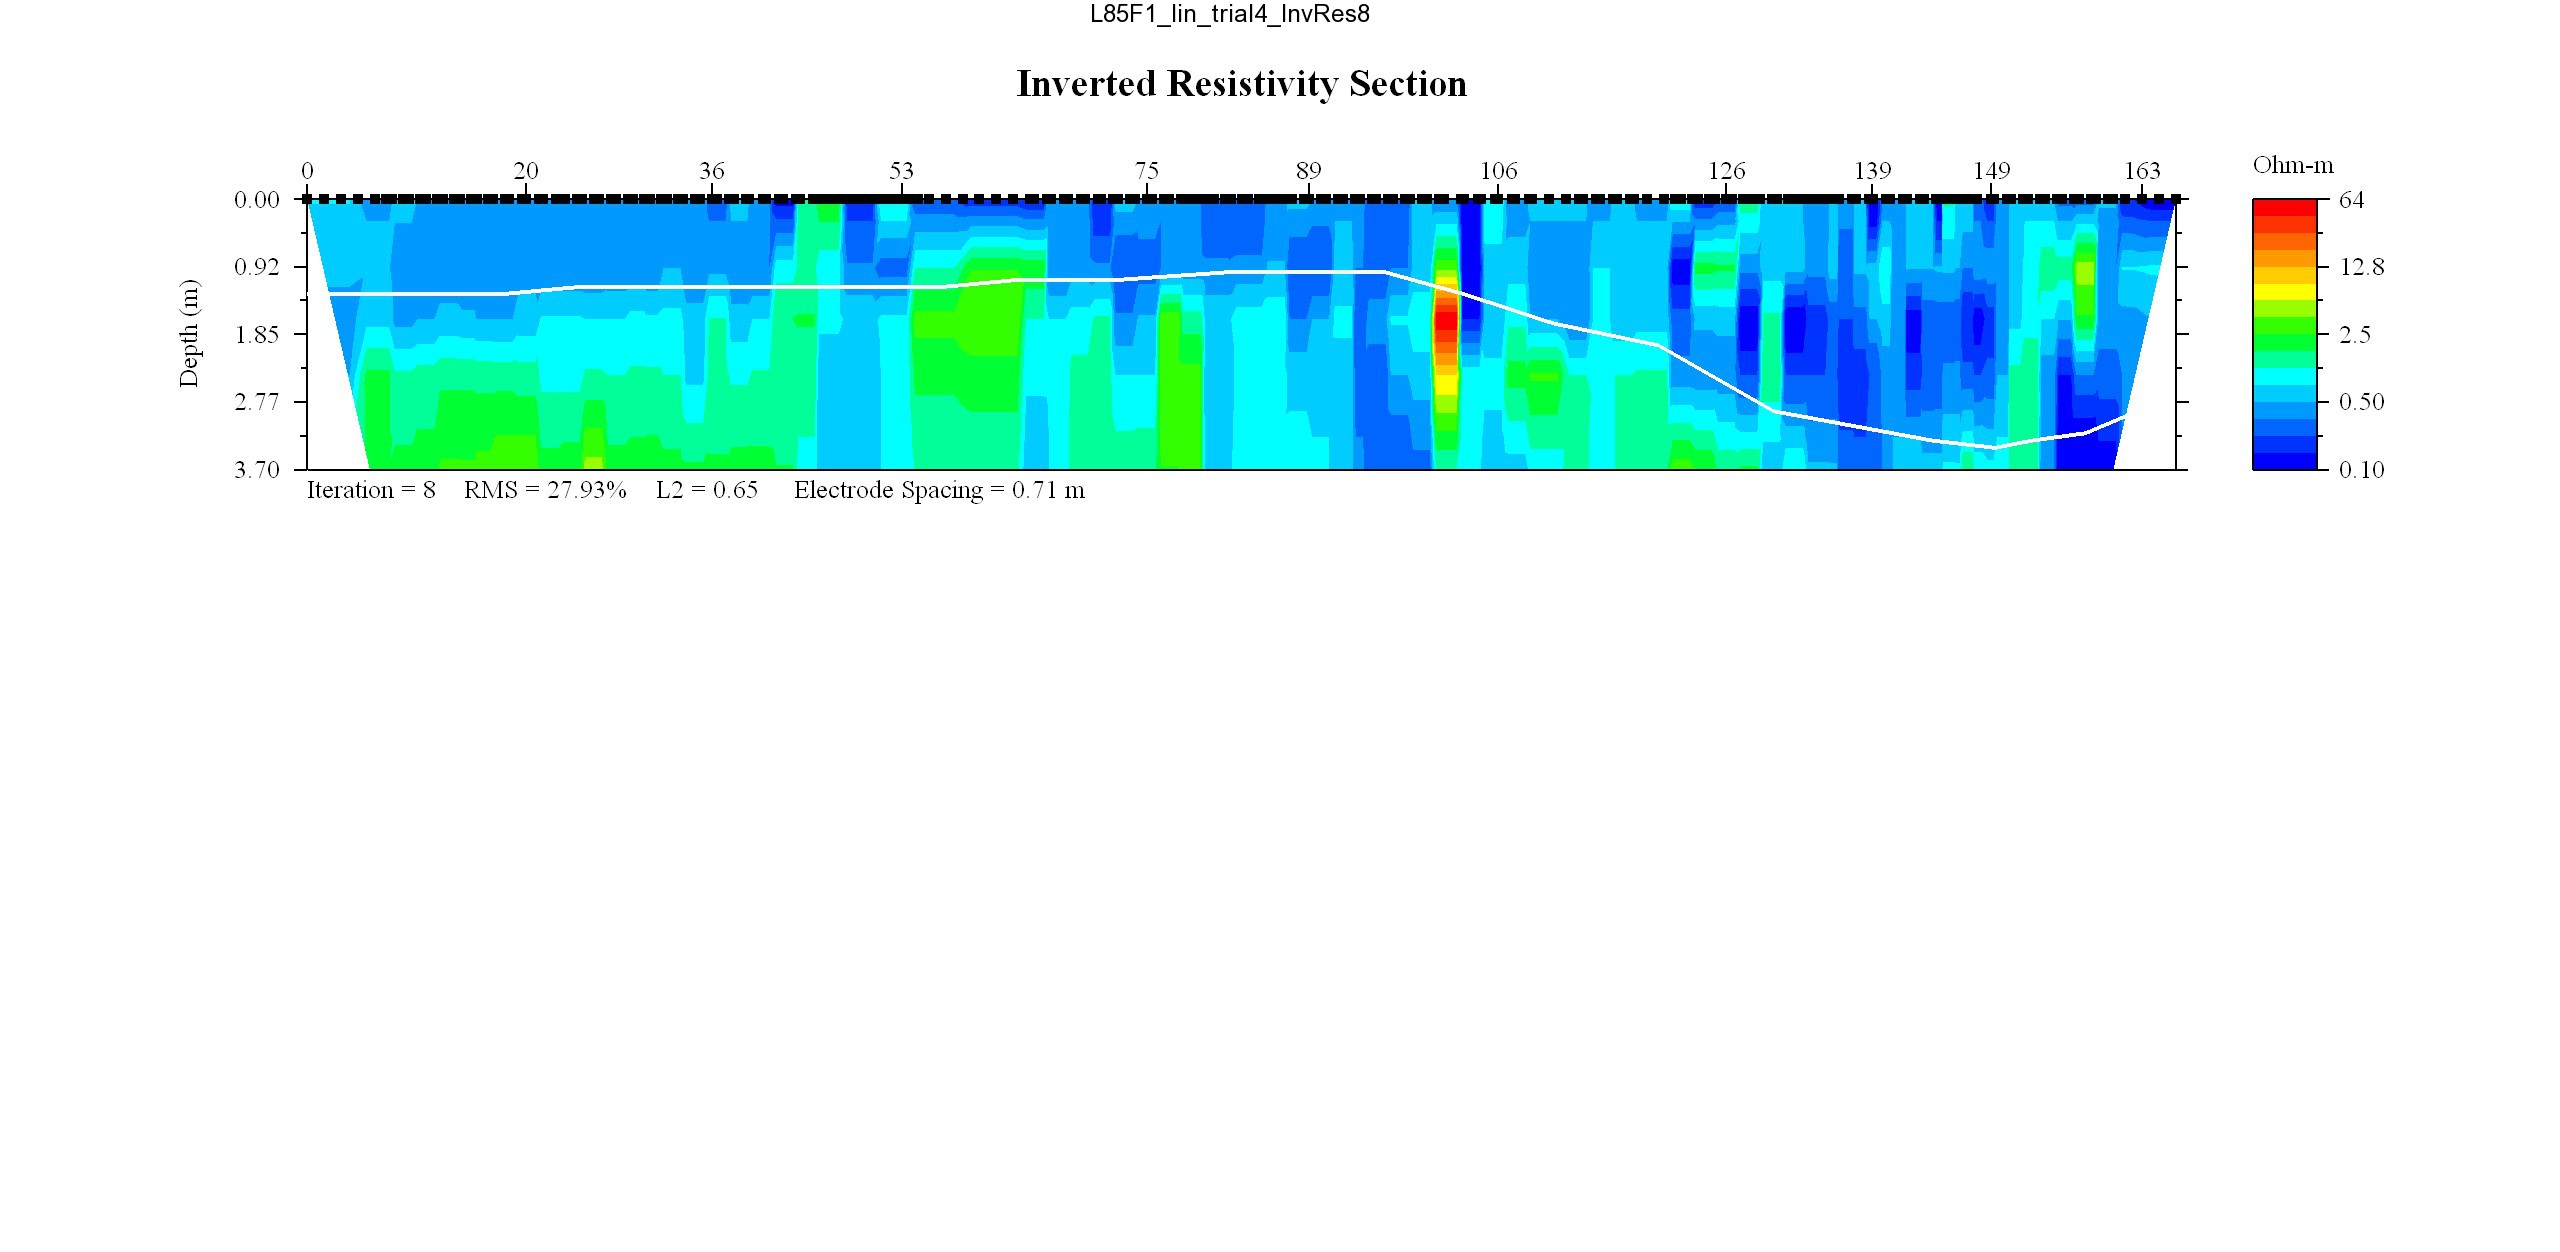
May 17, 2008: Line L86F1, WRES = 0.35
EarthImager thumbnail JPEG image of line 86 resistivity profile.
MATLAB thumbnail JPEG image of line 86 resistivity profile.
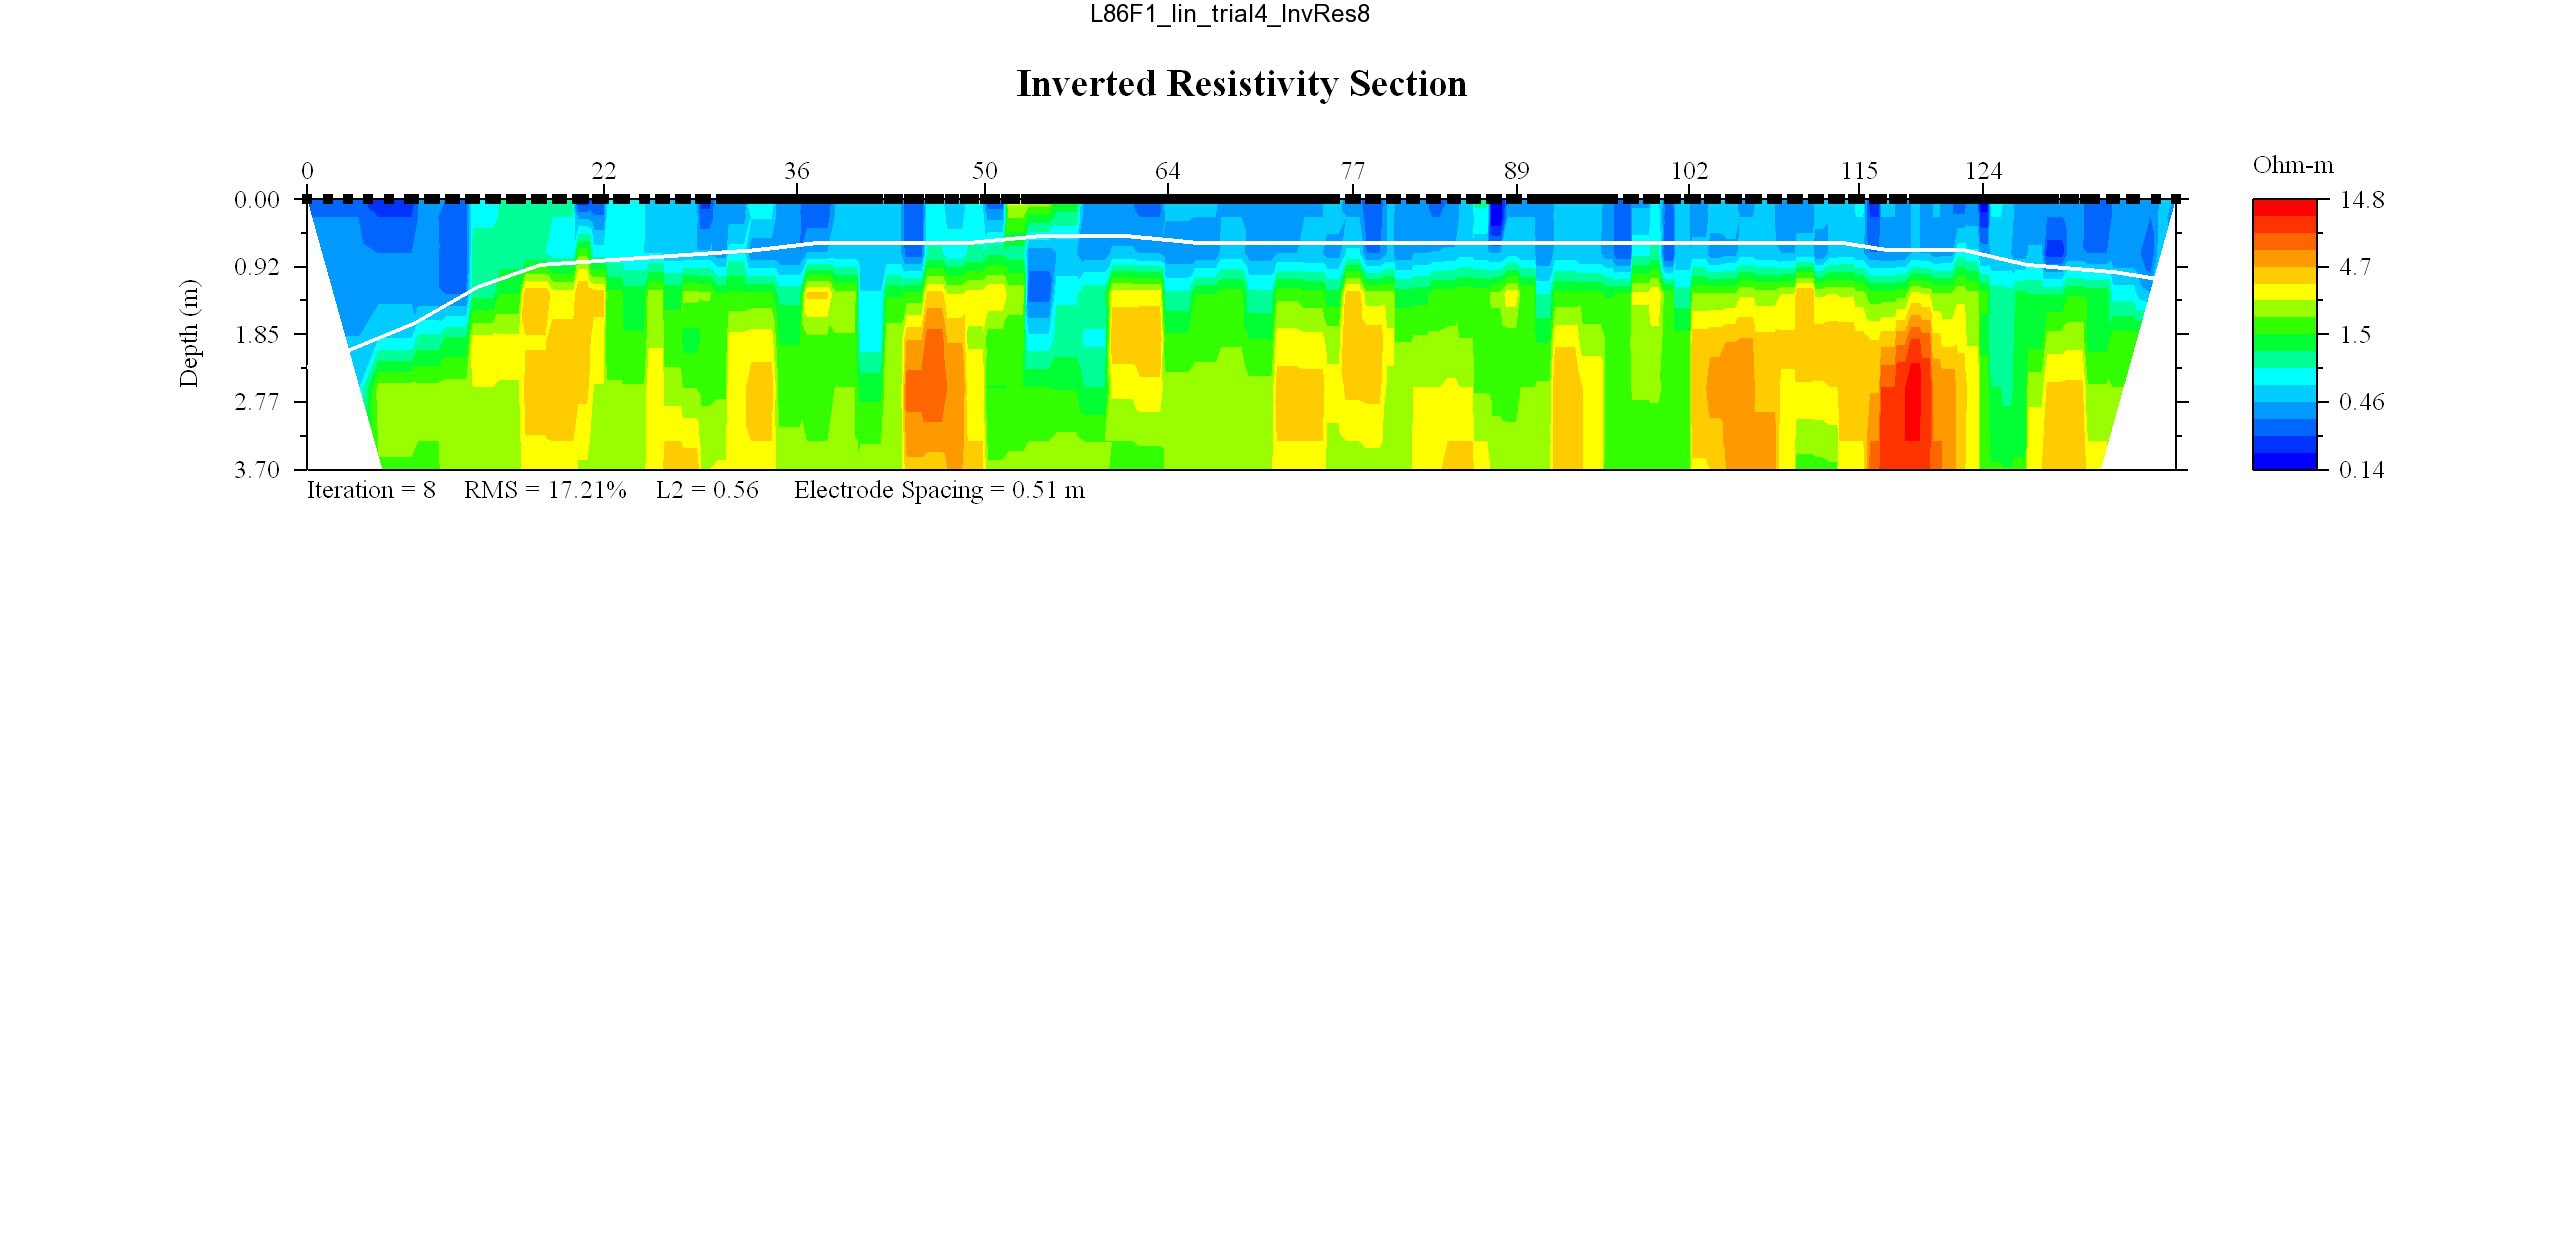
May 17, 2008: Line L87F1, WRES = 0.35
EarthImager thumbnail JPEG image of line 87 resistivity profile.
MATLAB thumbnail JPEG image of line 87 resistivity profile.
May 17, 2008: Line L88F1, WRES = 0.35
EarthImager thumbnail JPEG image of line 88 resistivity and temperature profile.
MATLAB thumbnail JPEG image of line 88 resistivity profile.
May 17, 2008: Line L89F1, WRES = 0.35
EarthImager thumbnail JPEG image of line 89 resistivity profile.
MATLAB thumbnail JPEG image of line 89 resistivity profile.
May 17, 2008: Line L90F1, WRES = 0.35
EarthImager thumbnail JPEG image of line 90 resistivity profile.
MATLAB thumbnail JPEG image of line 90 resistivity profile.
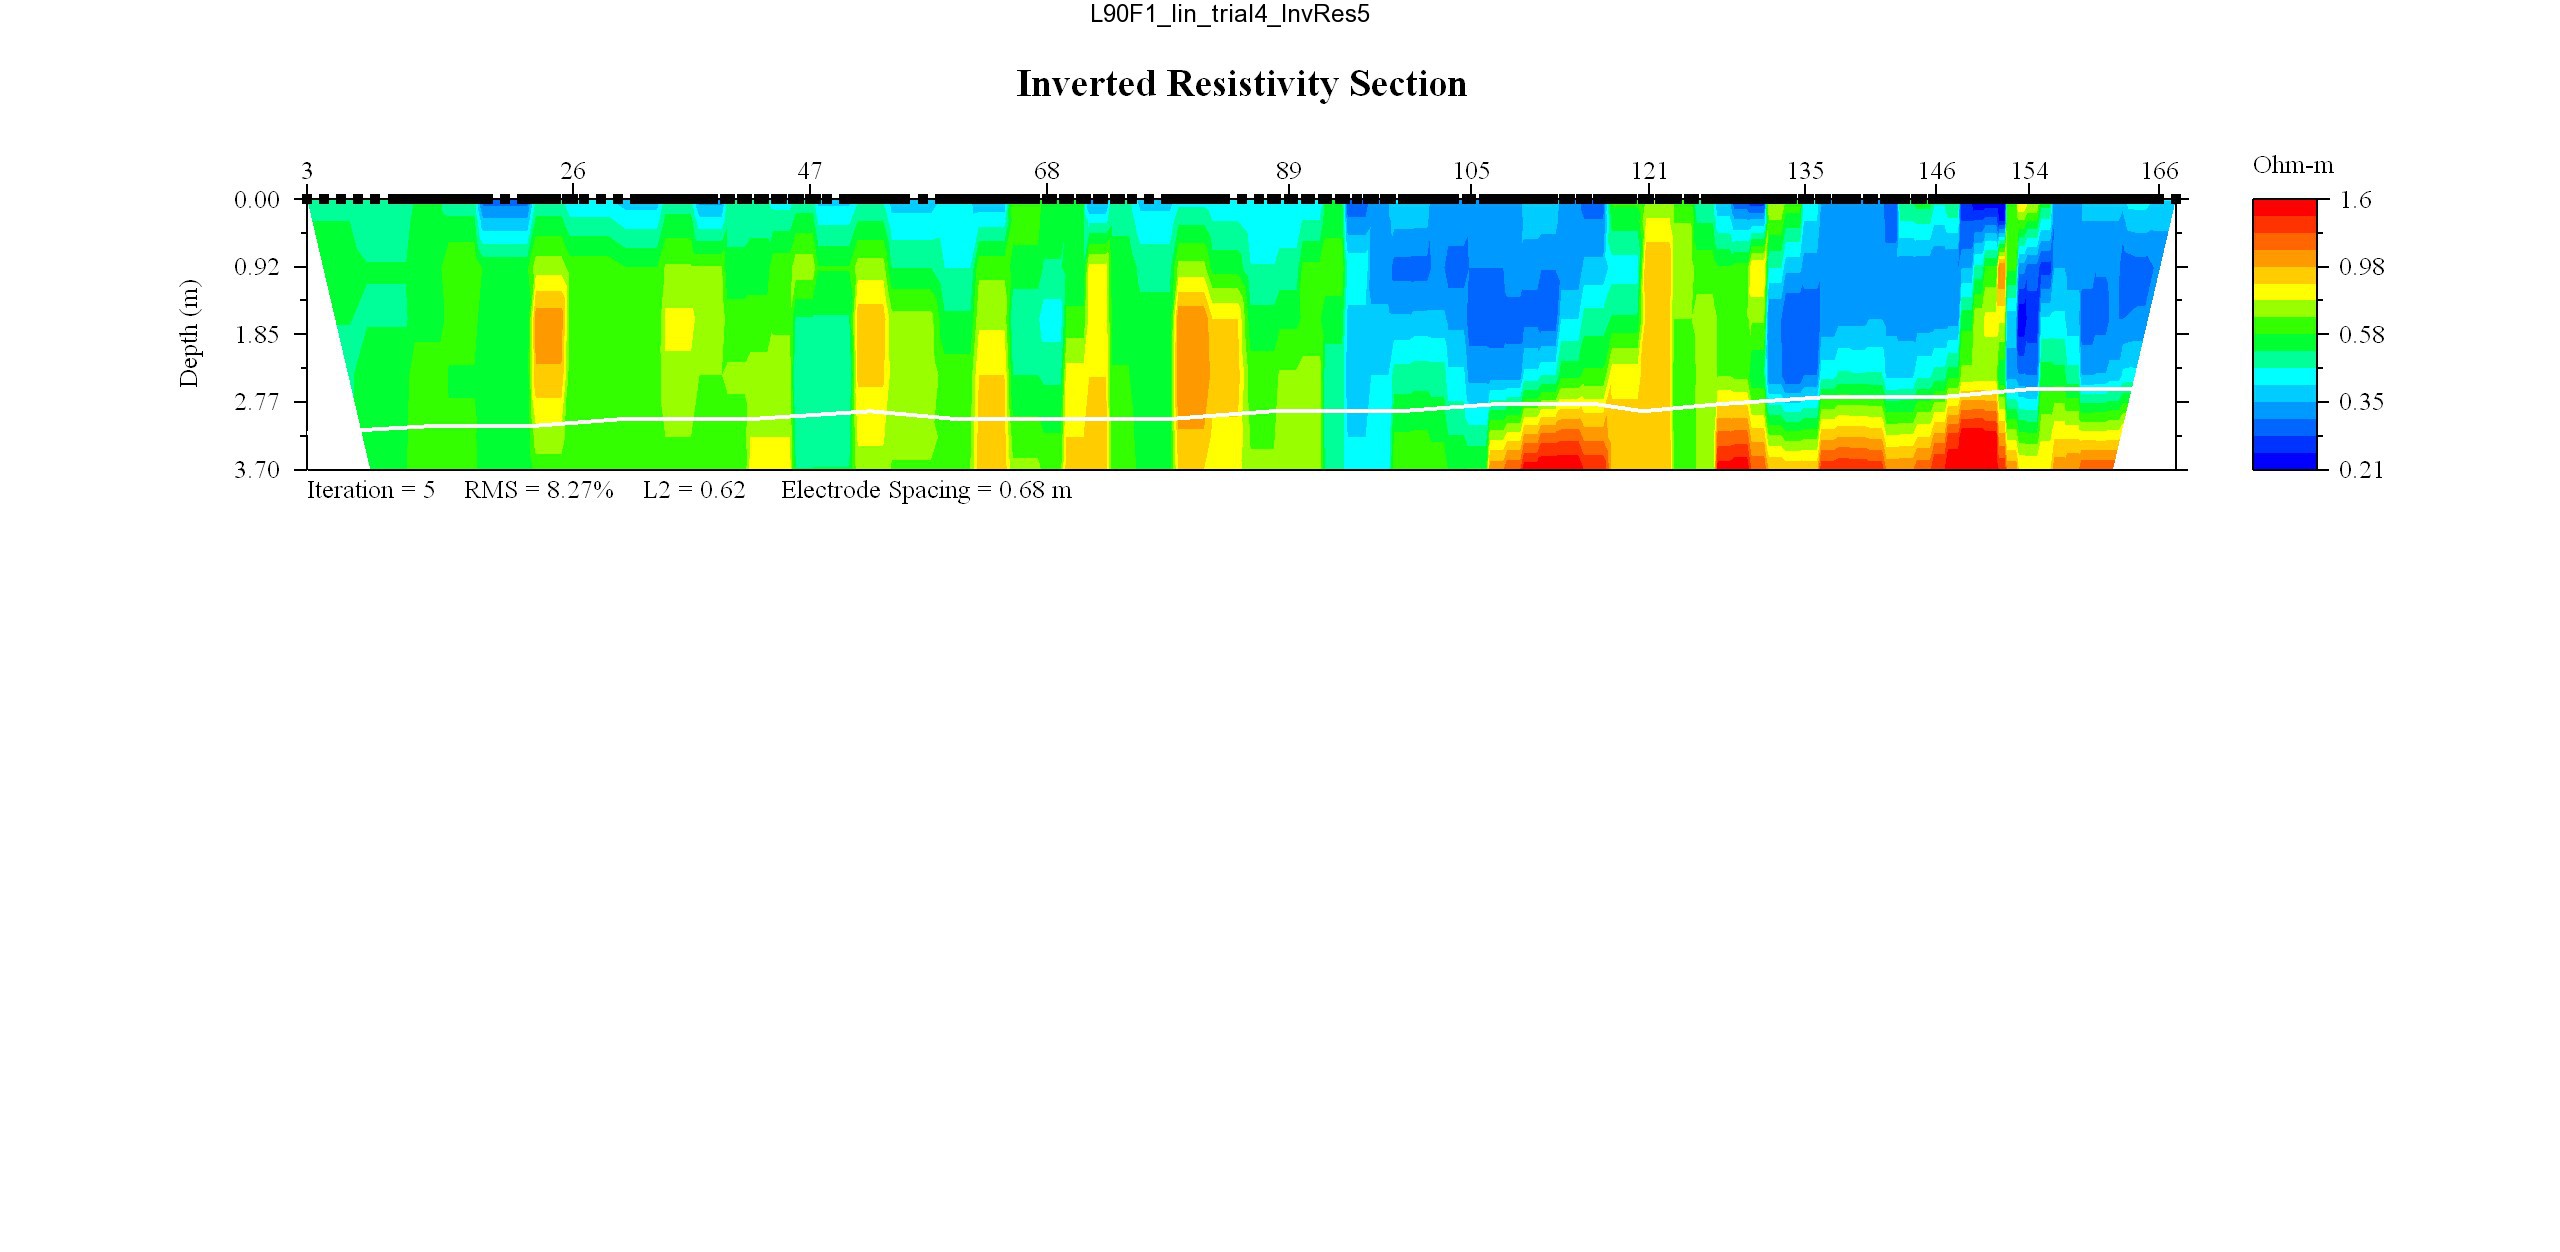
May 17, 2008: Line L91F1, WRES = 0.35
EarthImager thumbnail JPEG image of line 91 resistivity profile with repaired bathymetry.
MATLAB thumbnail JPEG image of line 91 resistivity profile.
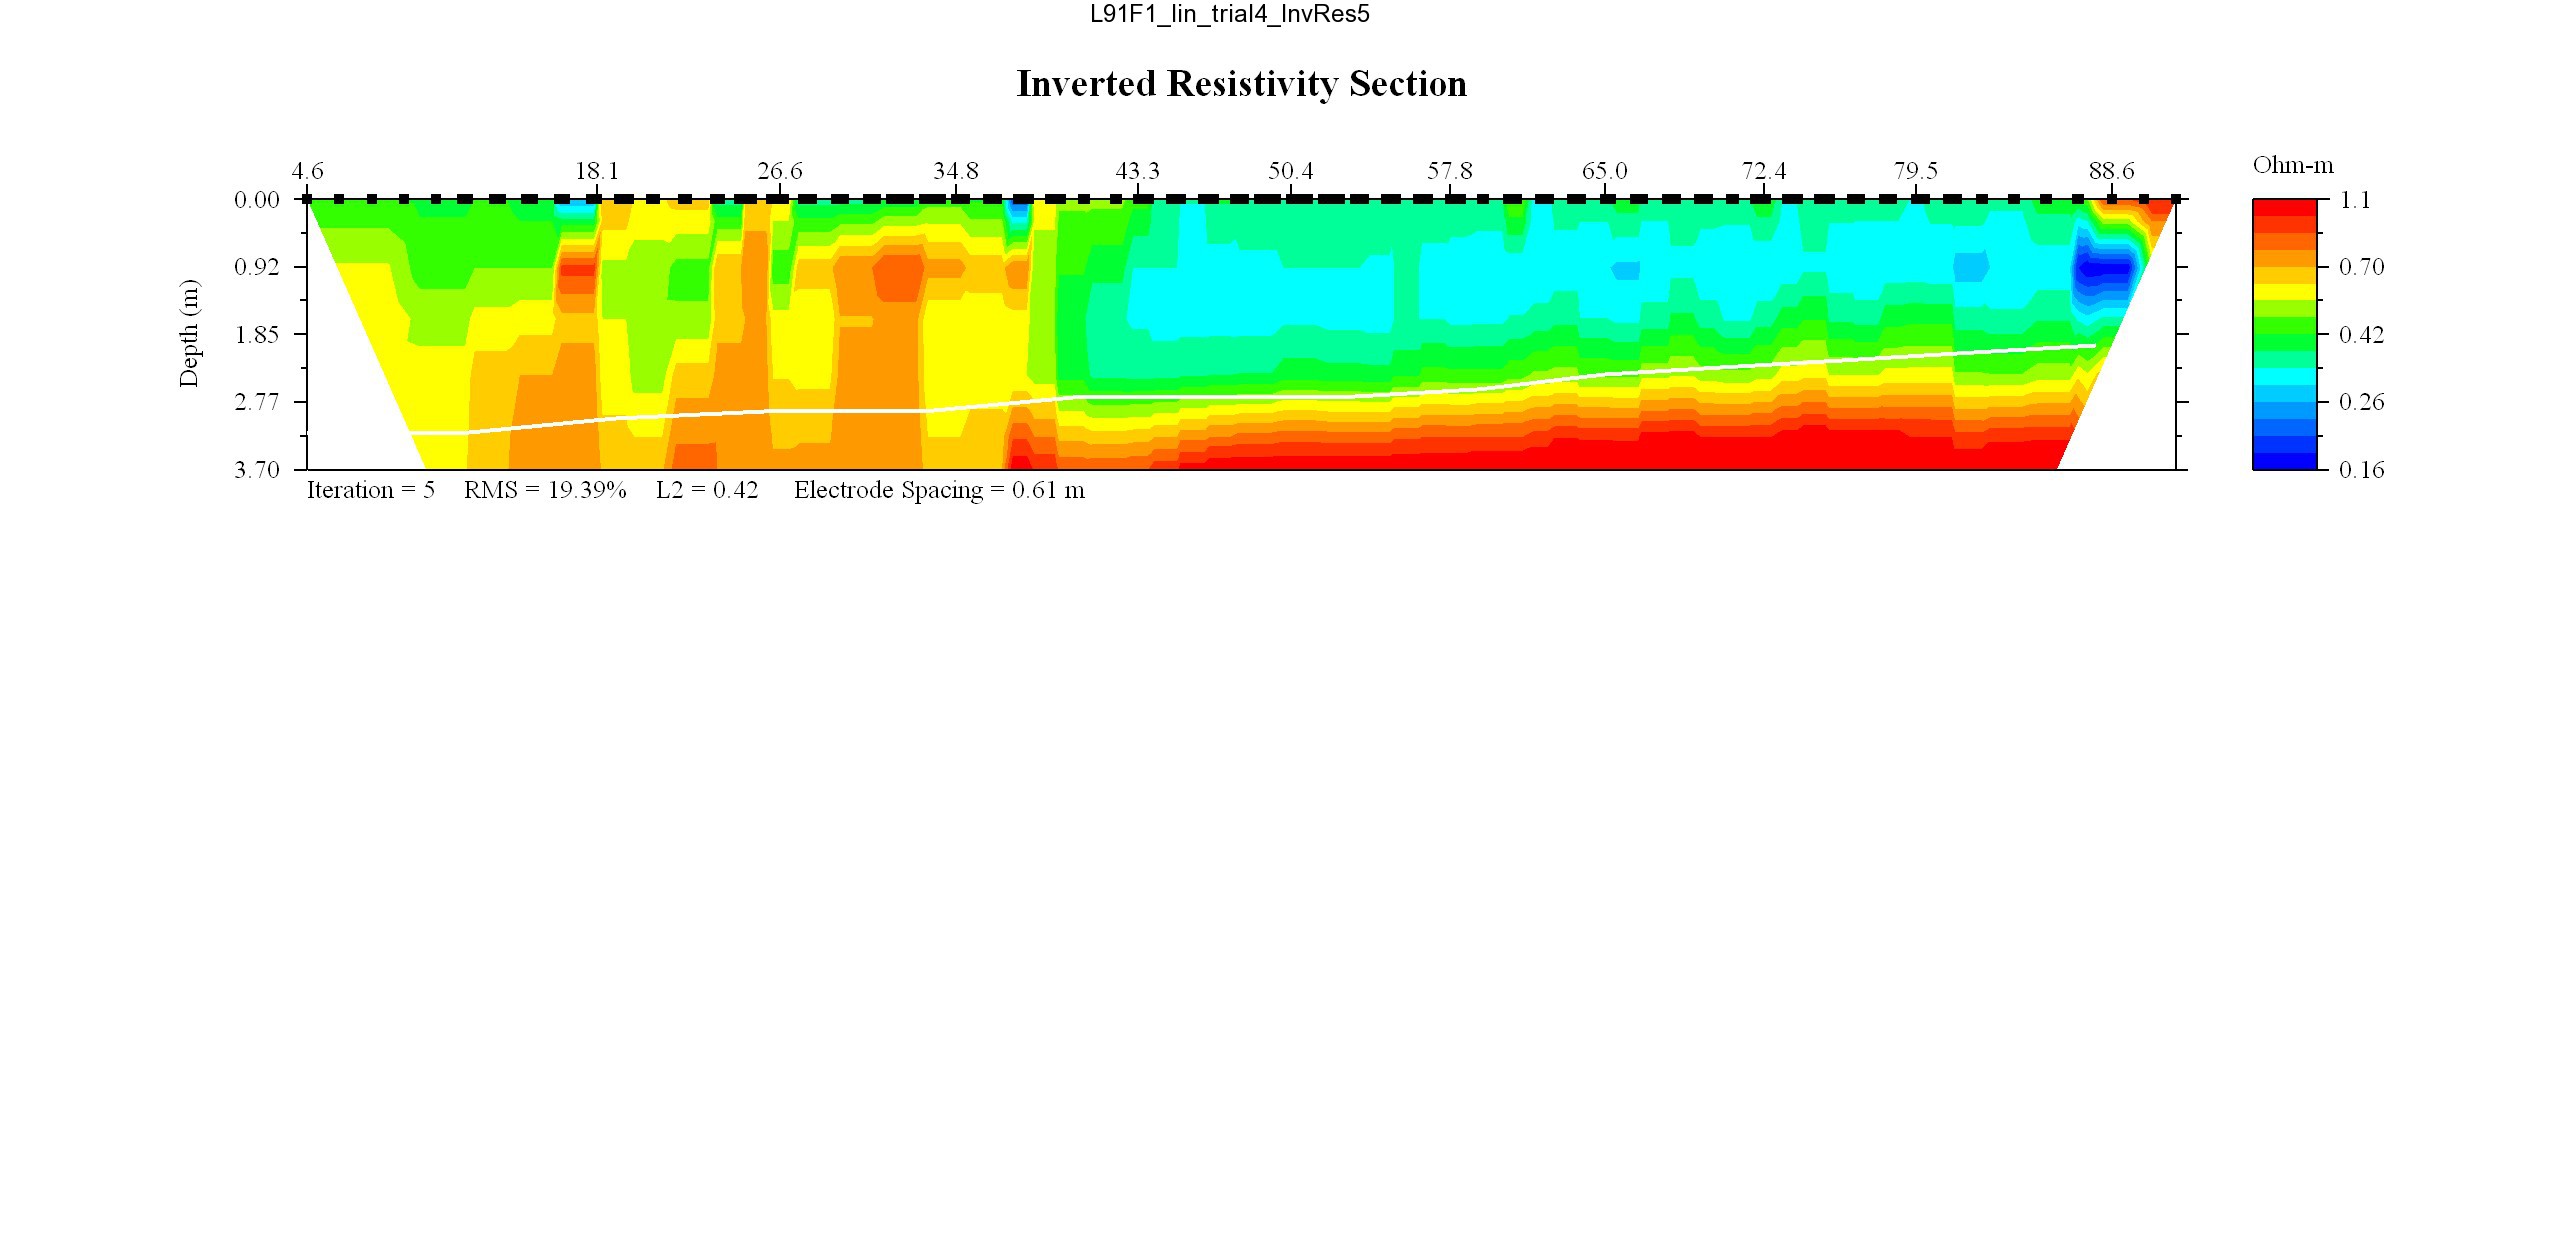
May 17, 2008: Line L92F1, WRES = 0.35
EarthImager thumbnail JPEG image of line 92 resistivity profile.
MATLAB thumbnail JPEG image of line 92 resistivity profile.
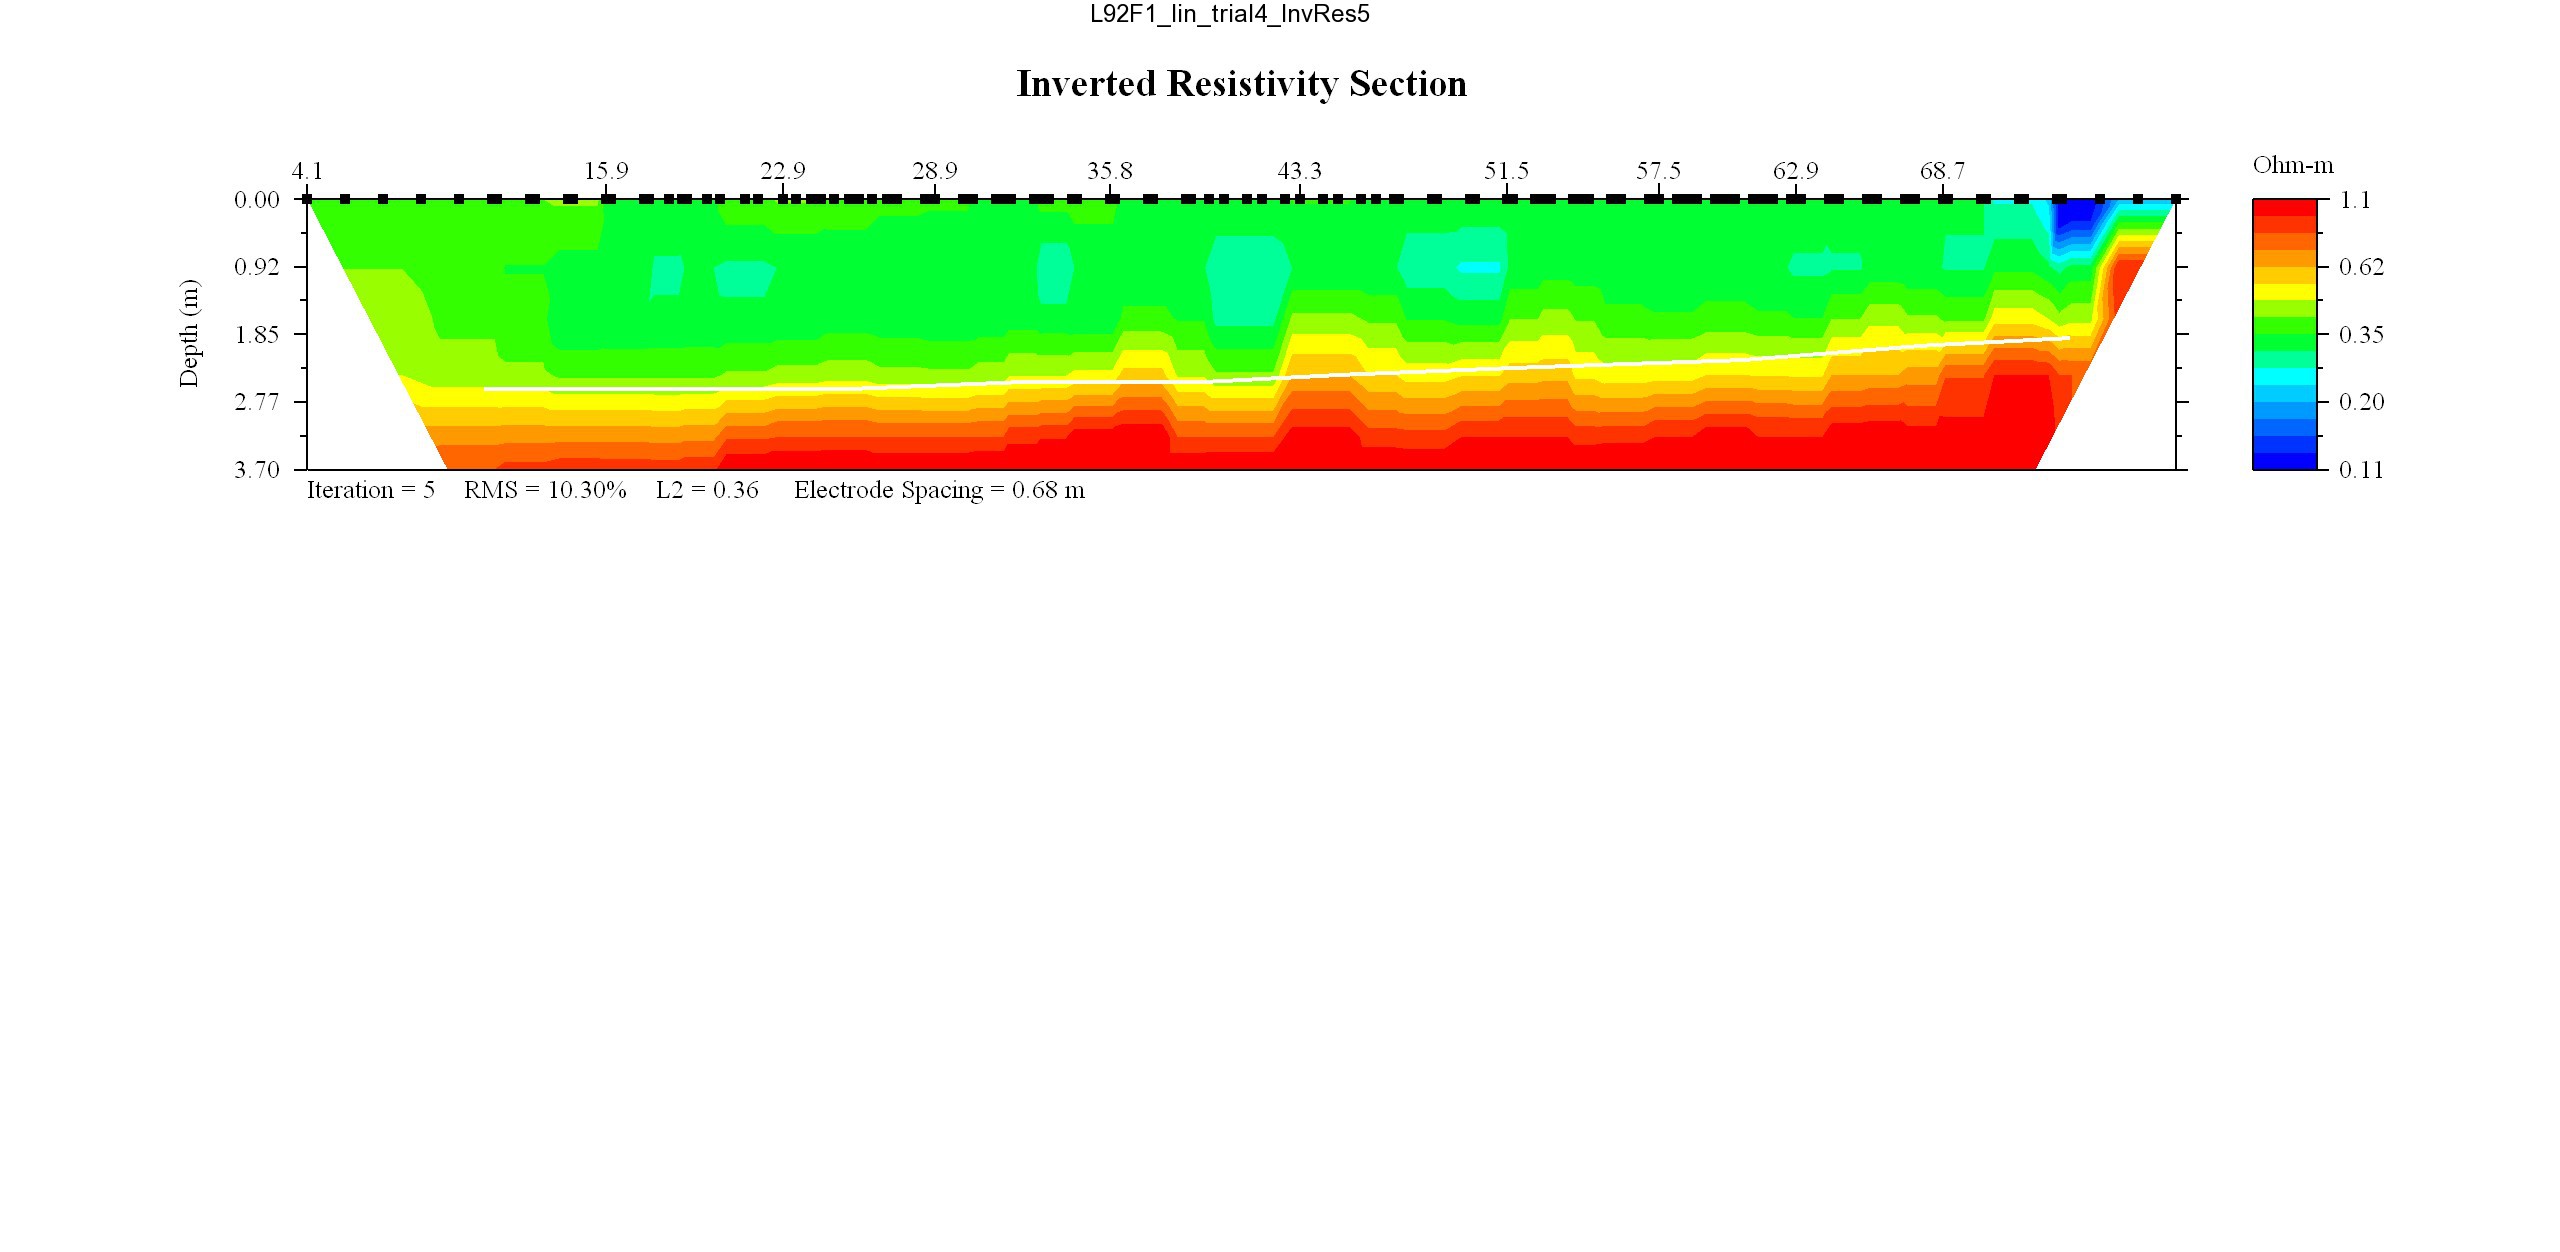
May 17, 2008: Line L93F1, WRES = 0.35
EarthImager thumbnail JPEG image of line 93 resistivity profile.
MATLAB thumbnail JPEG image of line 93 resistivity profile.
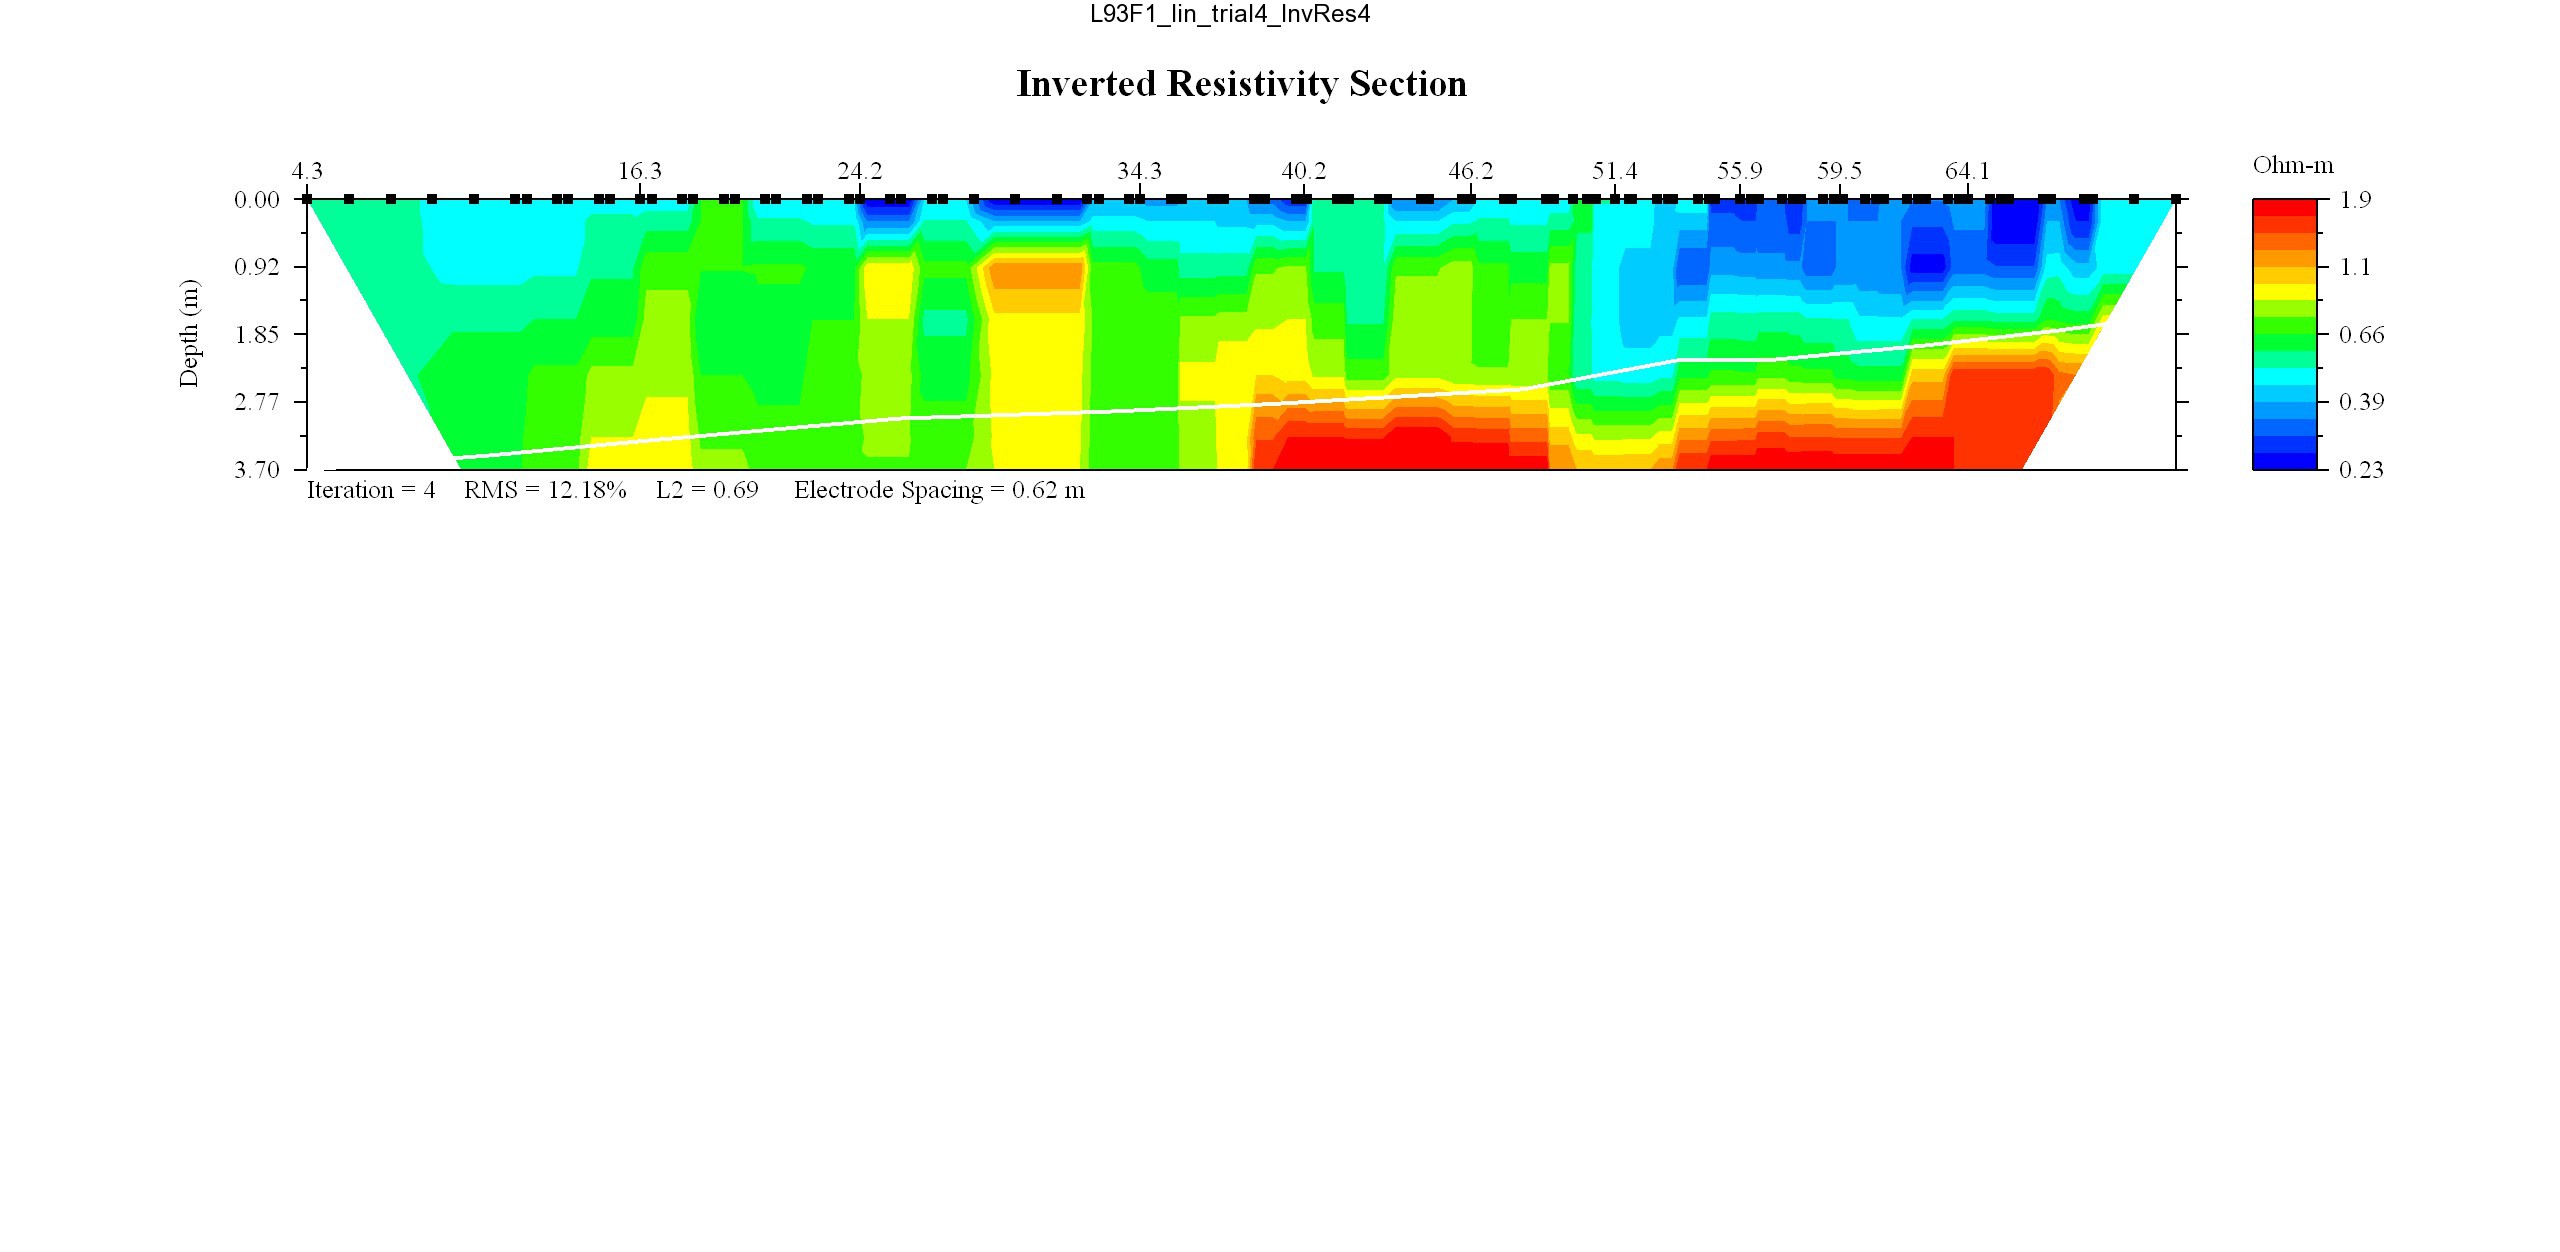
May 17, 2008: Line L94F1, WRES = 0.35
EarthImager thumbnail JPEG image of line 94 resistivity profile.
MATLAB thumbnail JPEG image of line 94 resistivity profile.
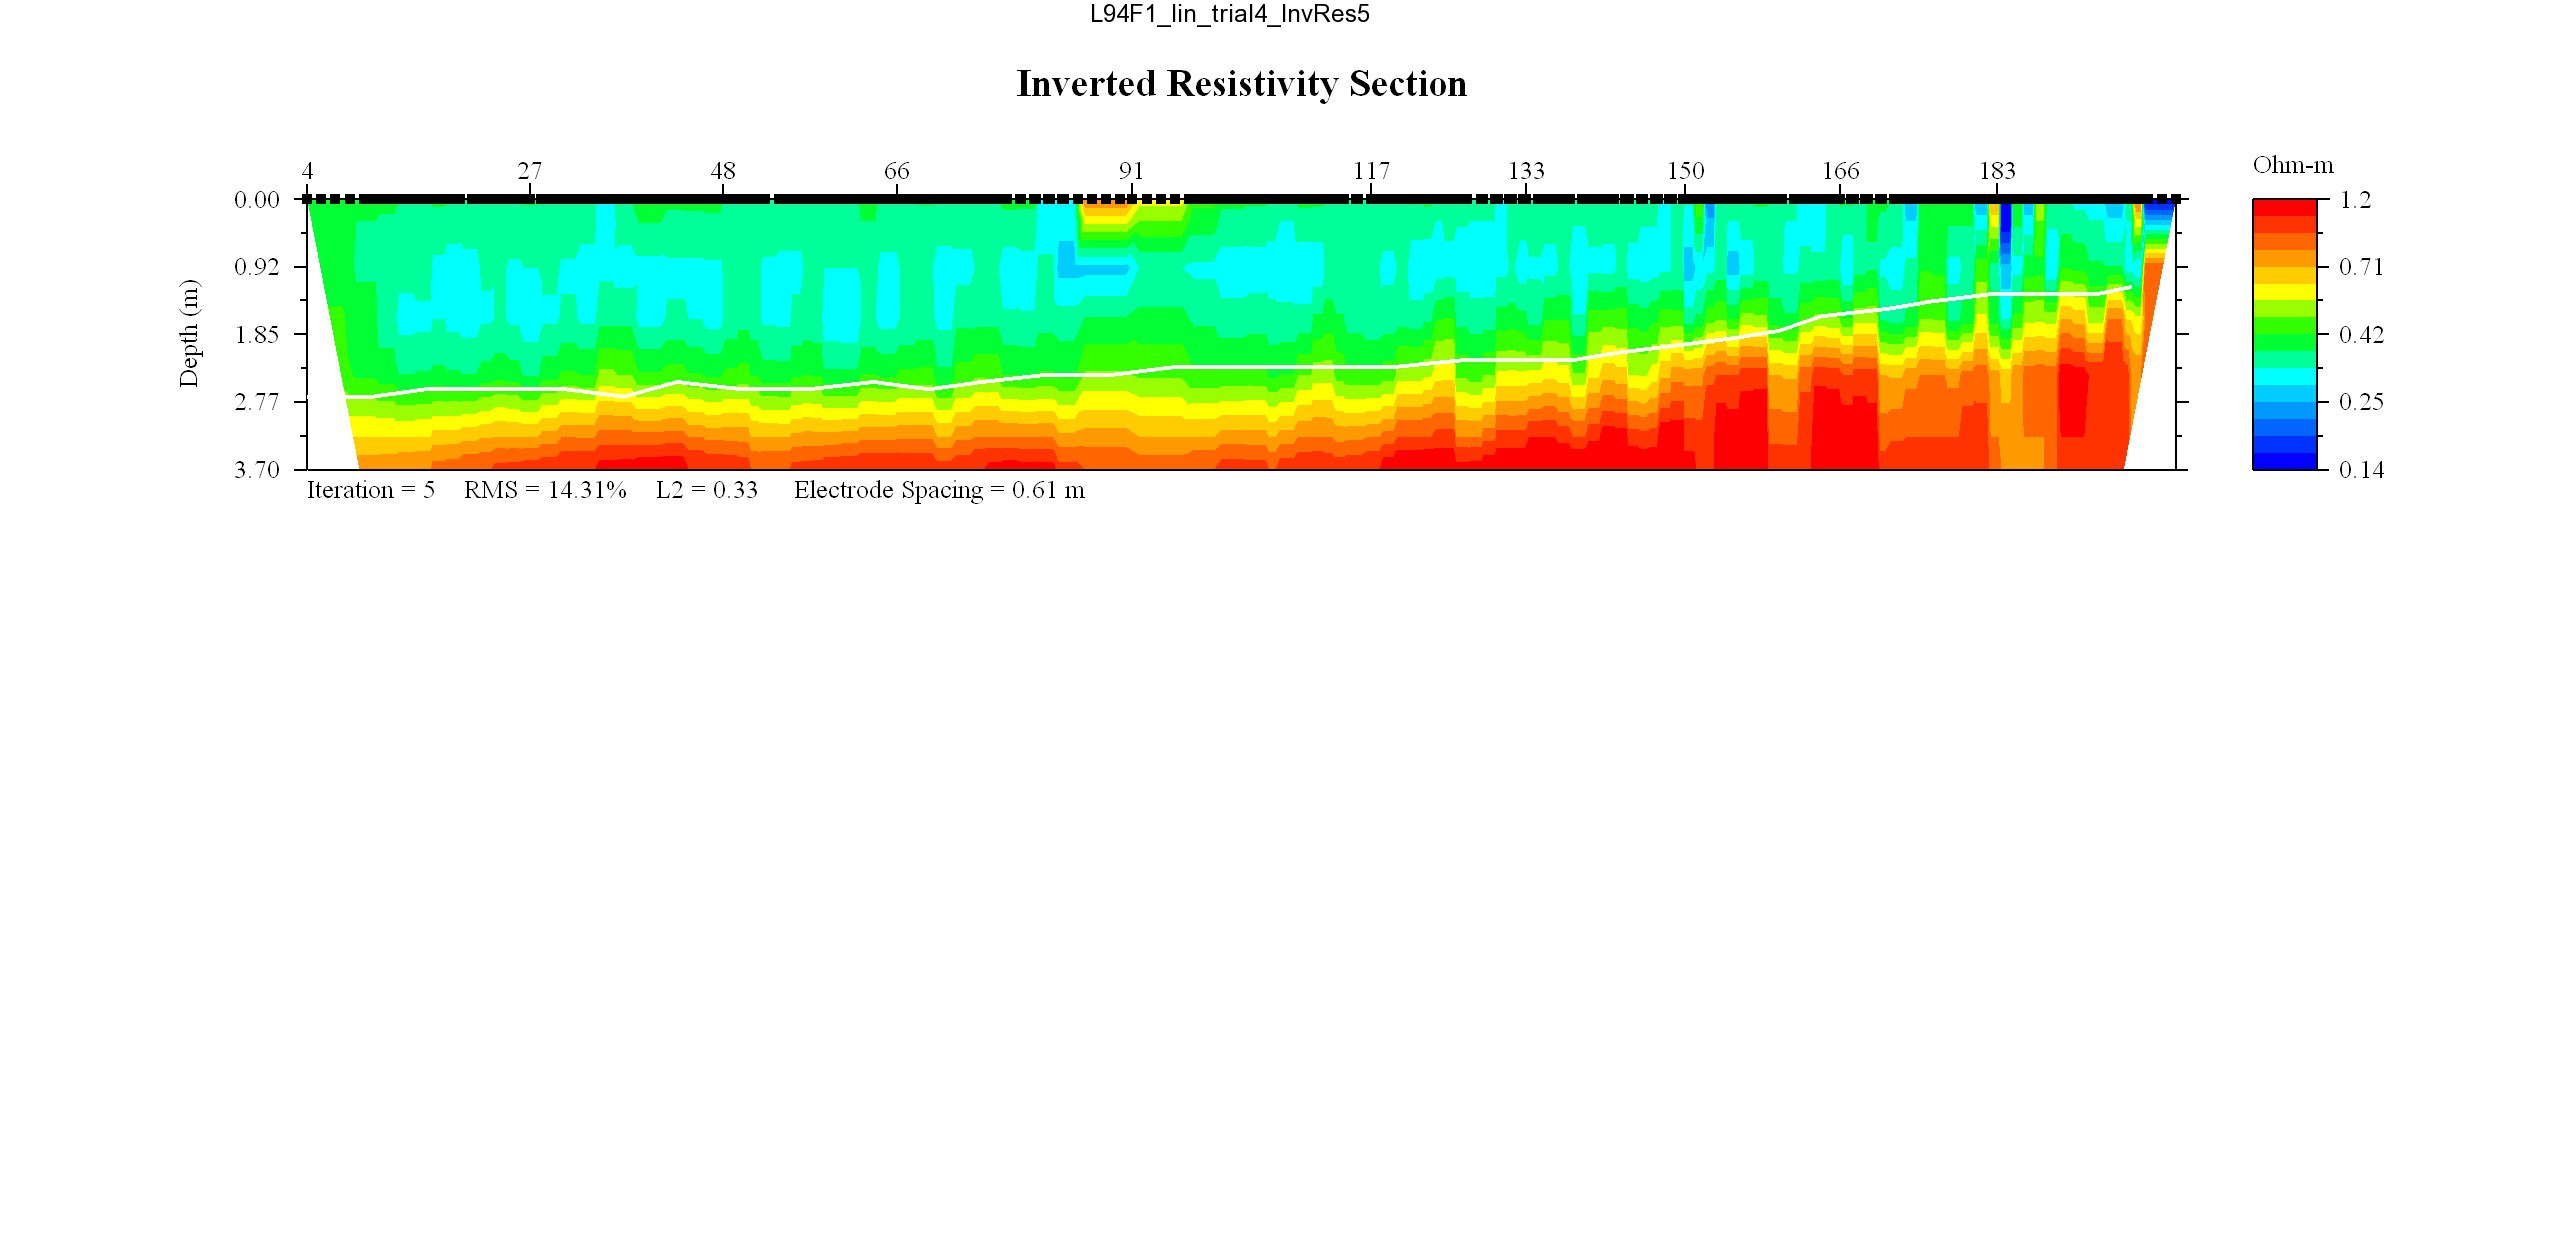
May 17, 2008: Line L95F1, WRES = 0.35
EarthImager thumbnail JPEG image of line 95 resistivity profile.
MATLAB thumbnail JPEG image of line 95 resistivity profile.
May 17, 2008: Line L96F1, WRES = 0.35
EarthImager thumbnail JPEG image of line 96 resistivity profile.
MATLAB thumbnail JPEG image of line 96 resistivity profile.
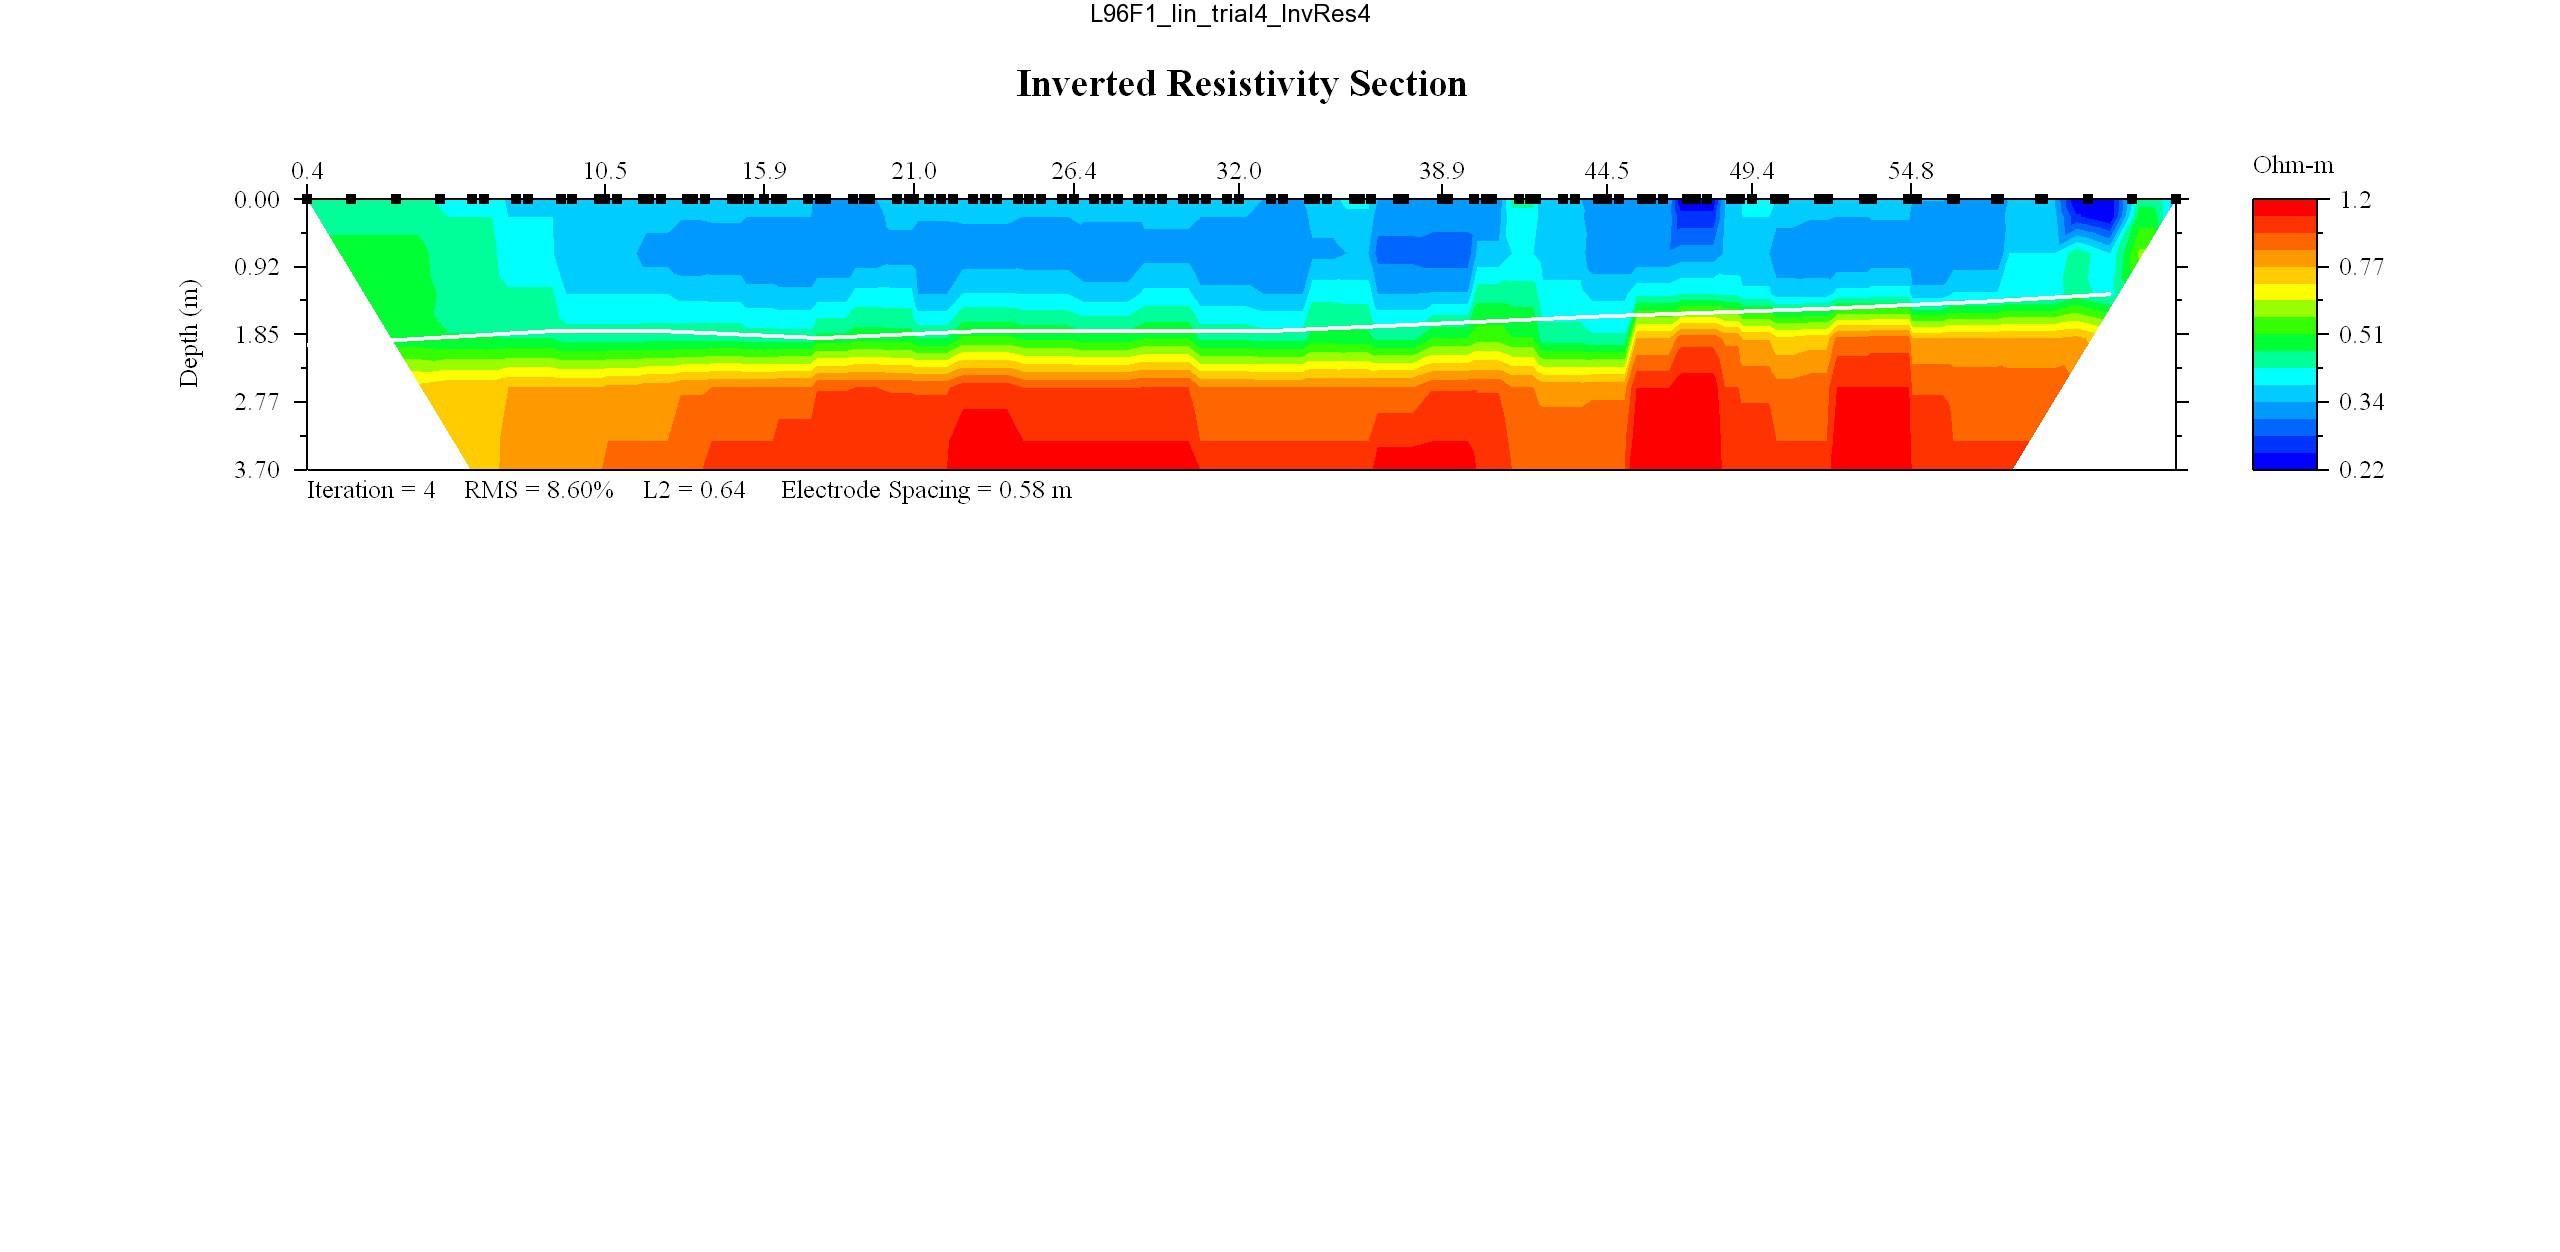
May 17, 2008: Line L97F1, WRES = 0.35
EarthImager thumbnail JPEG image of line 97 resistivity profile.
MATLAB thumbnail JPEG image of line 97 resistivity profile.
May 17, 2008: Line L98F1, WRES = 0.35
EarthImager thumbnail JPEG image of line 98 resistivity profile.
MATLAB thumbnail JPEG image of line 98 resistivity profile.
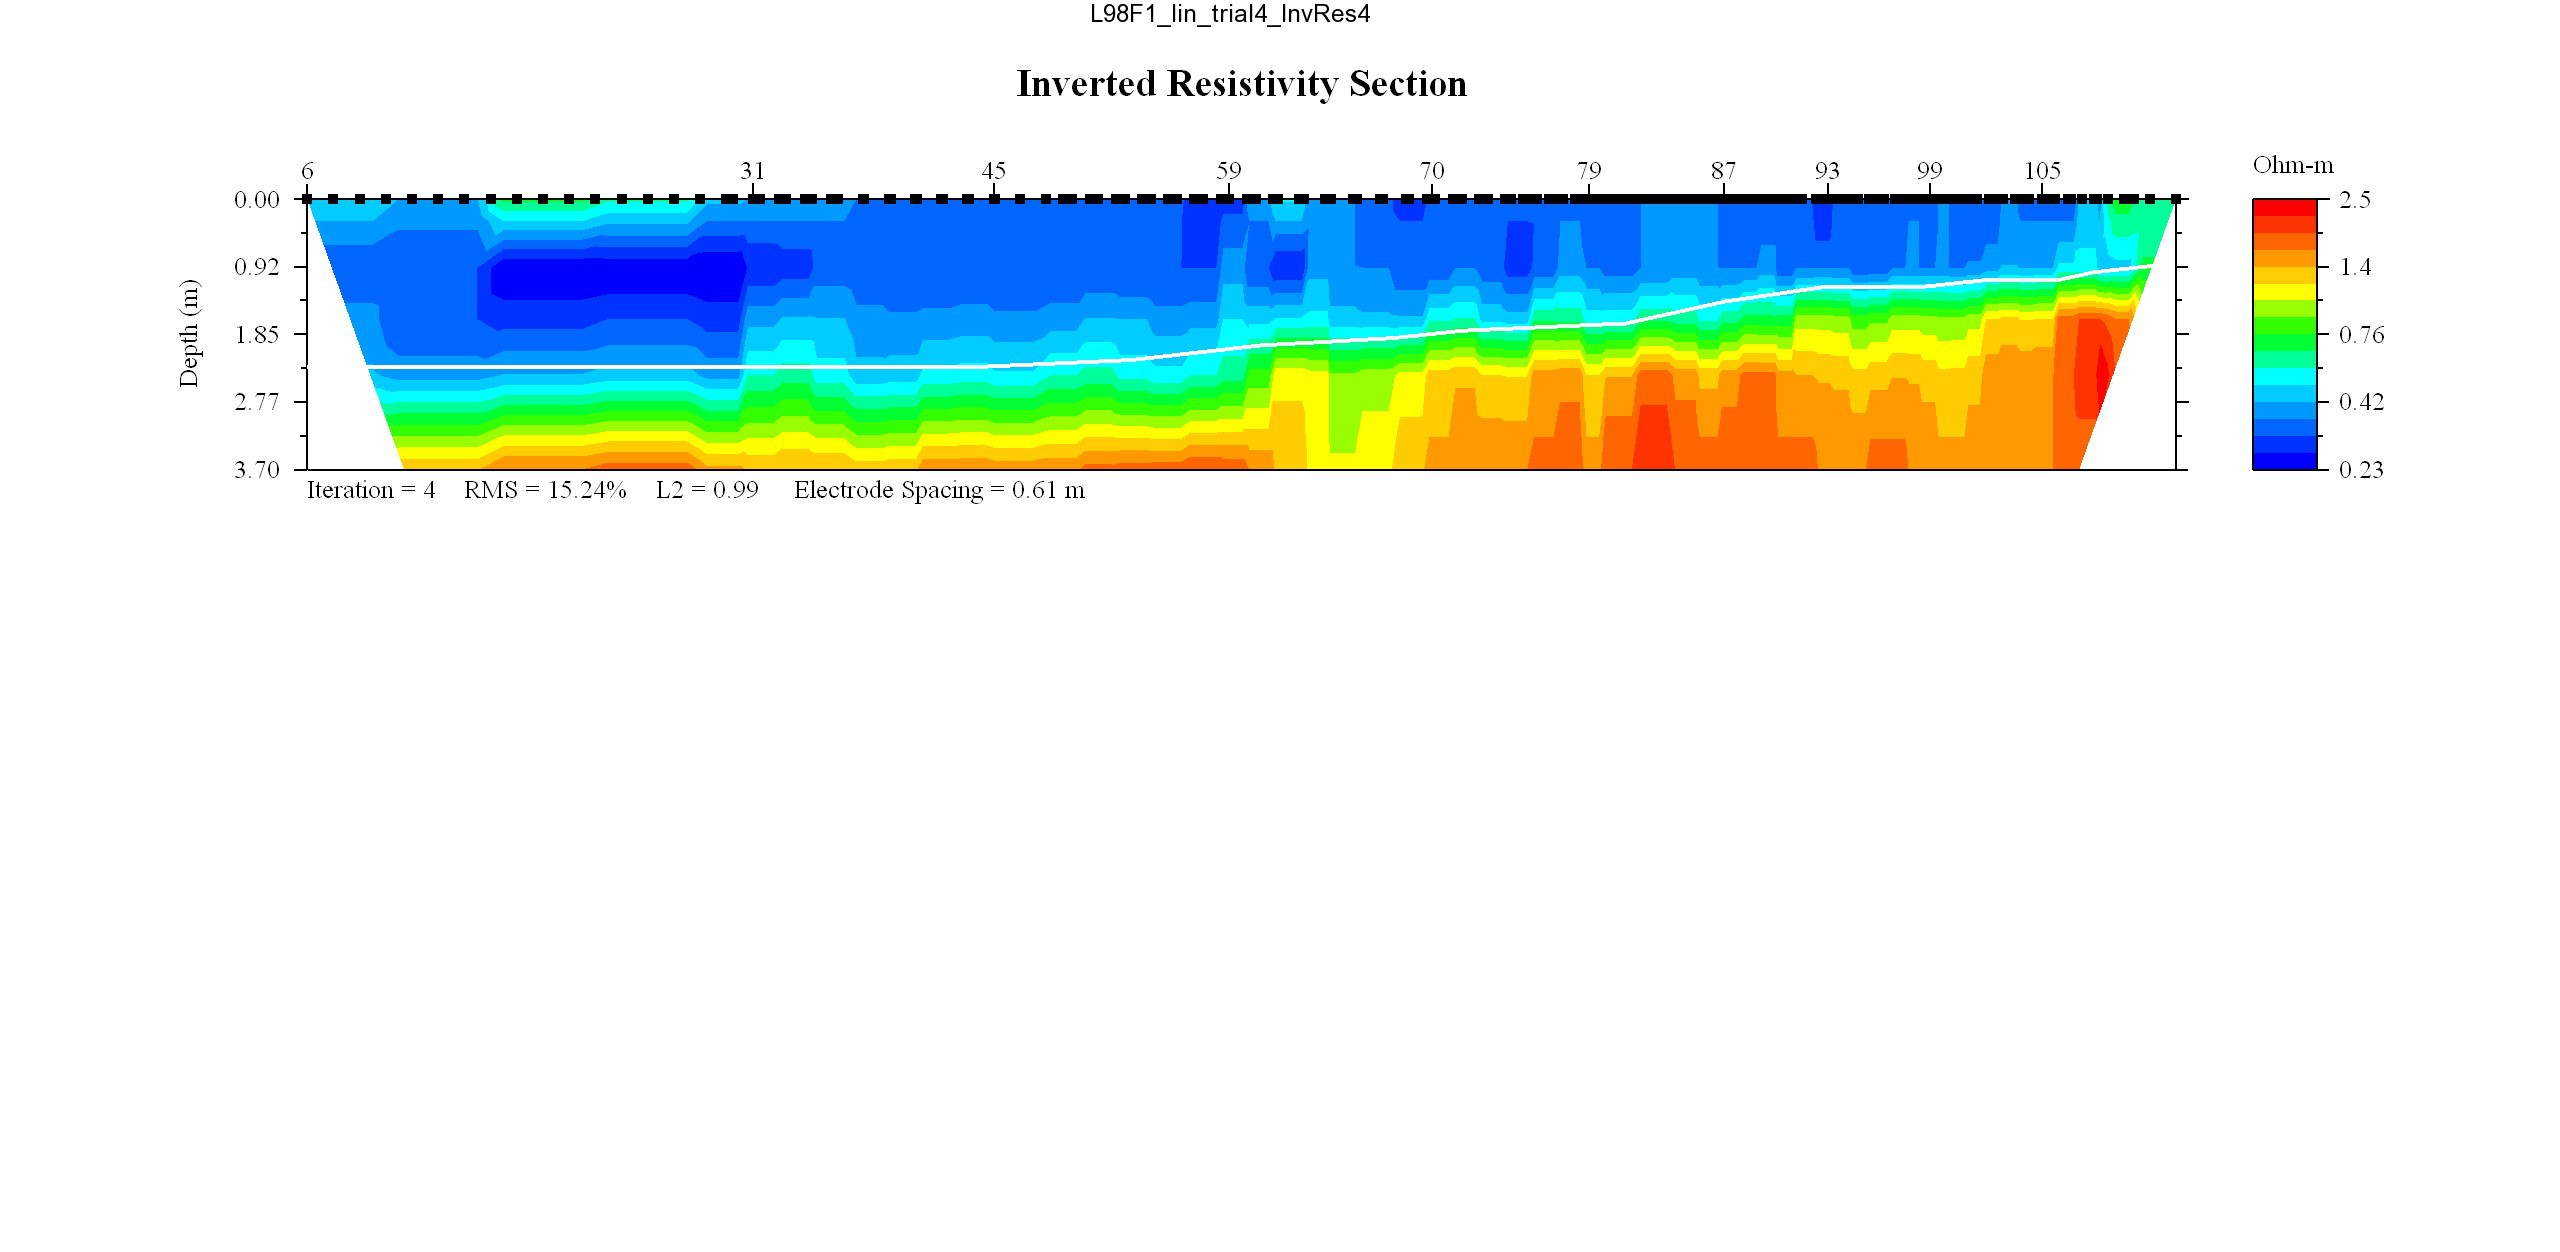
May 17, 2008: Line L99F1, WRES = 0.35
EarthImager thumbnail JPEG image of line 99 resistivity profile.
MATLAB thumbnail JPEG image of line 99 resistivity profile.
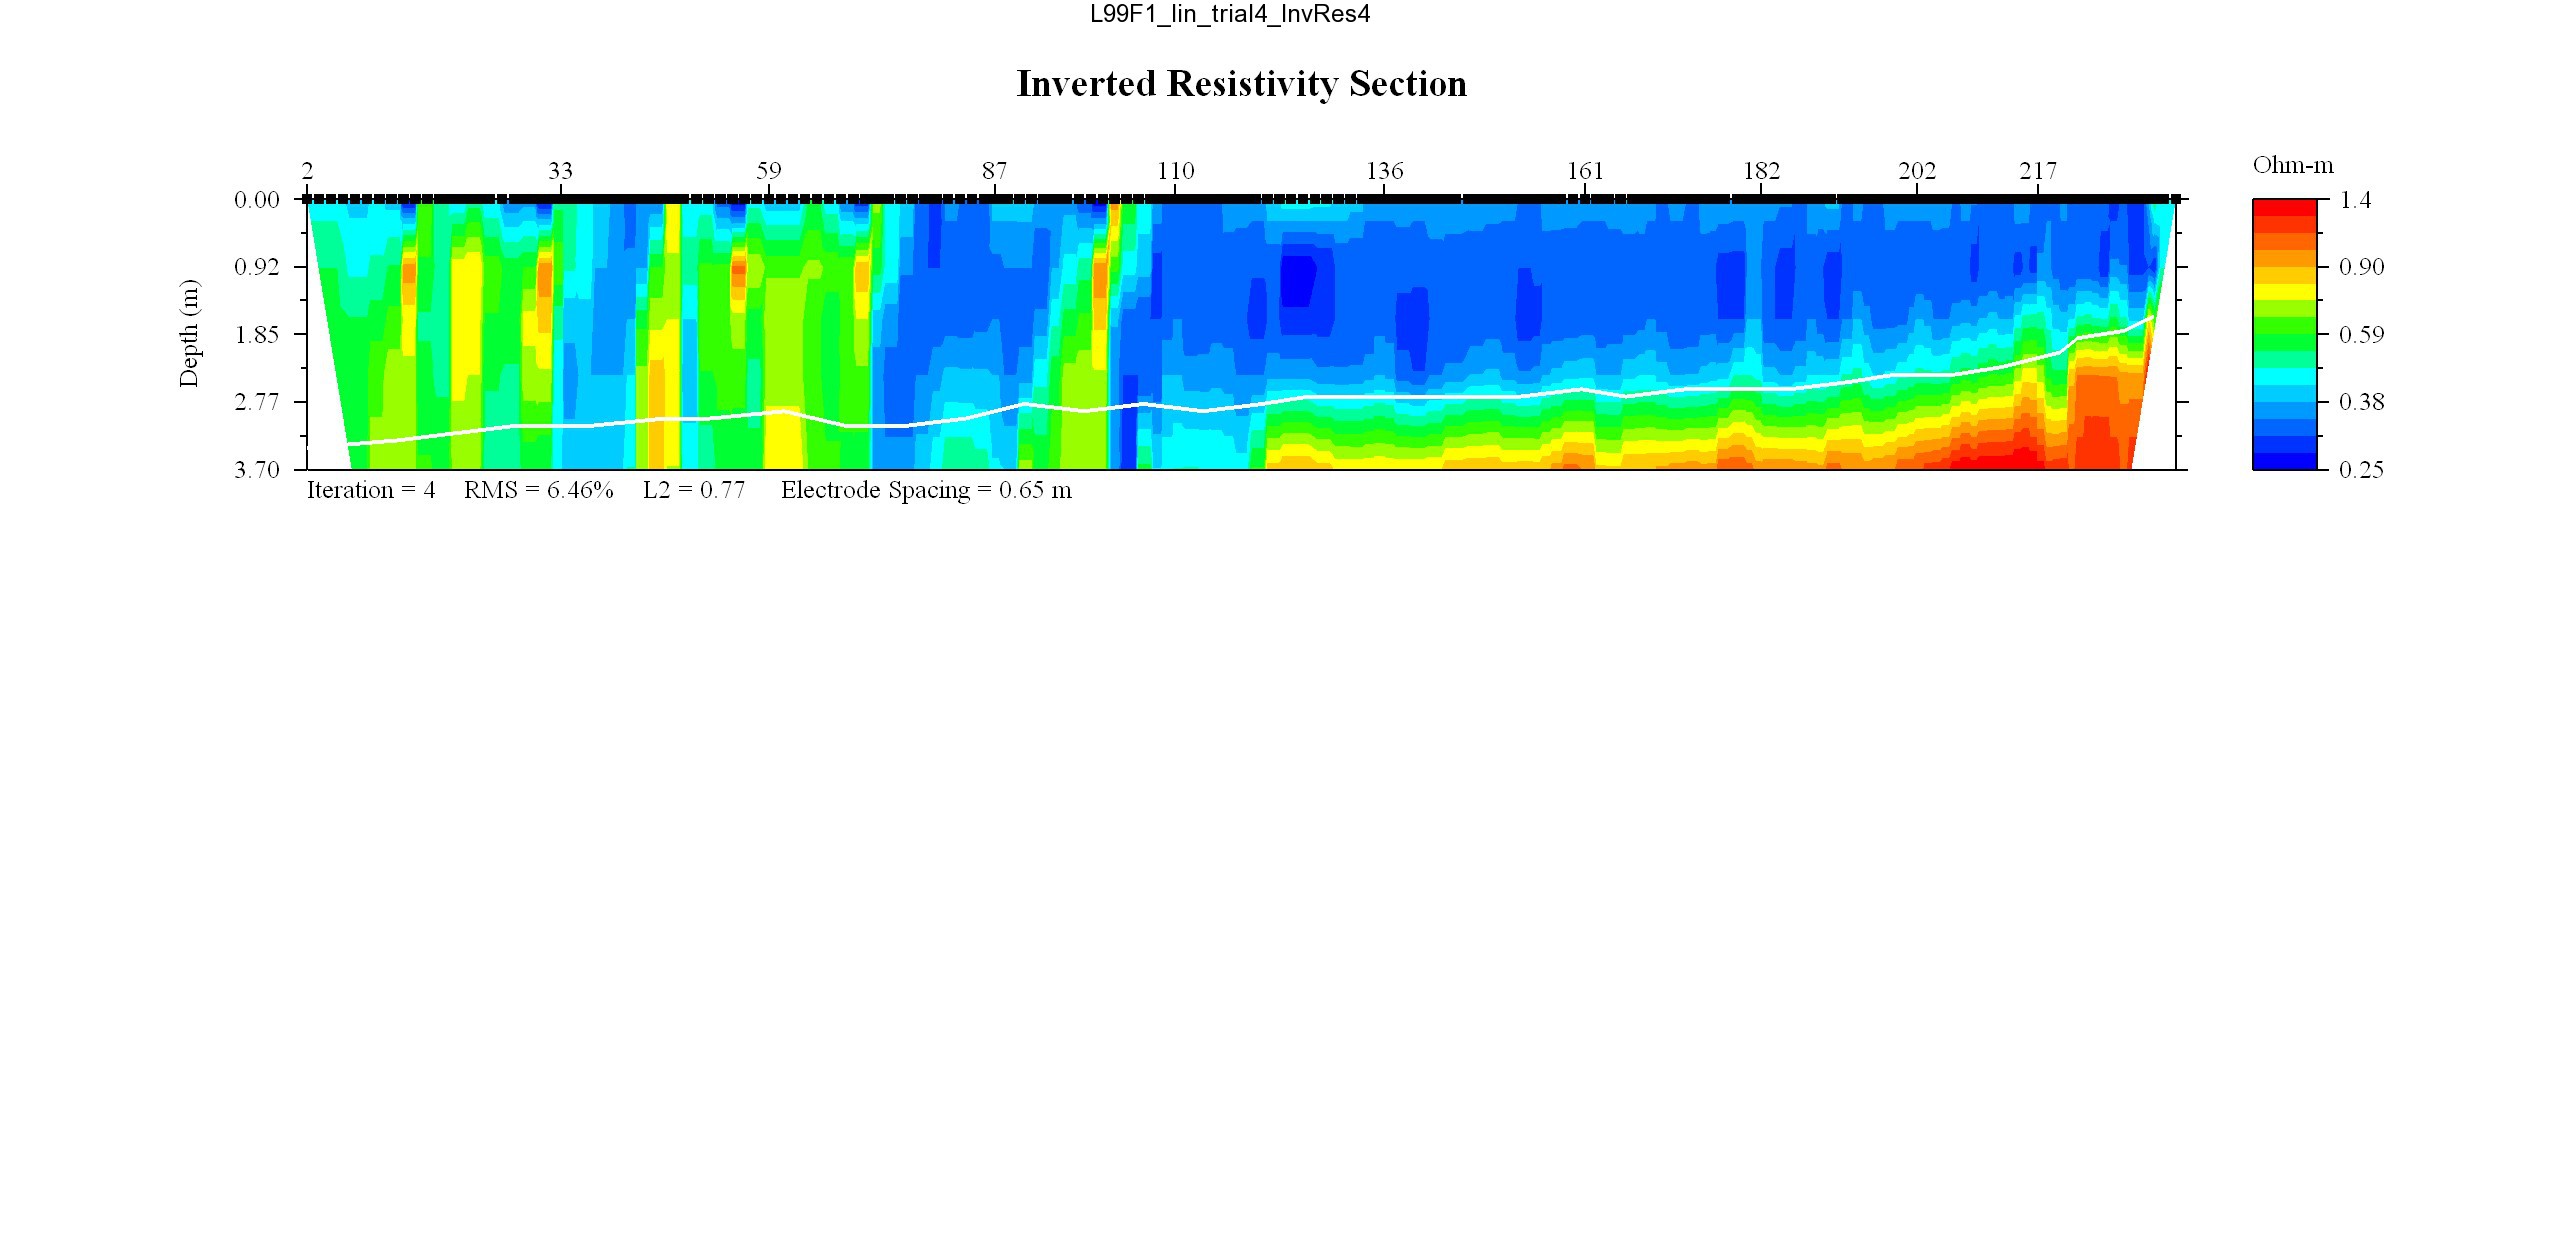
May 17, 2008: Line L100F1, WRES = 0.35
EarthImager thumbnail JPEG image of line 100 resistivity profile.
MATLAB thumbnail JPEG image of line 100 resistivity profile.
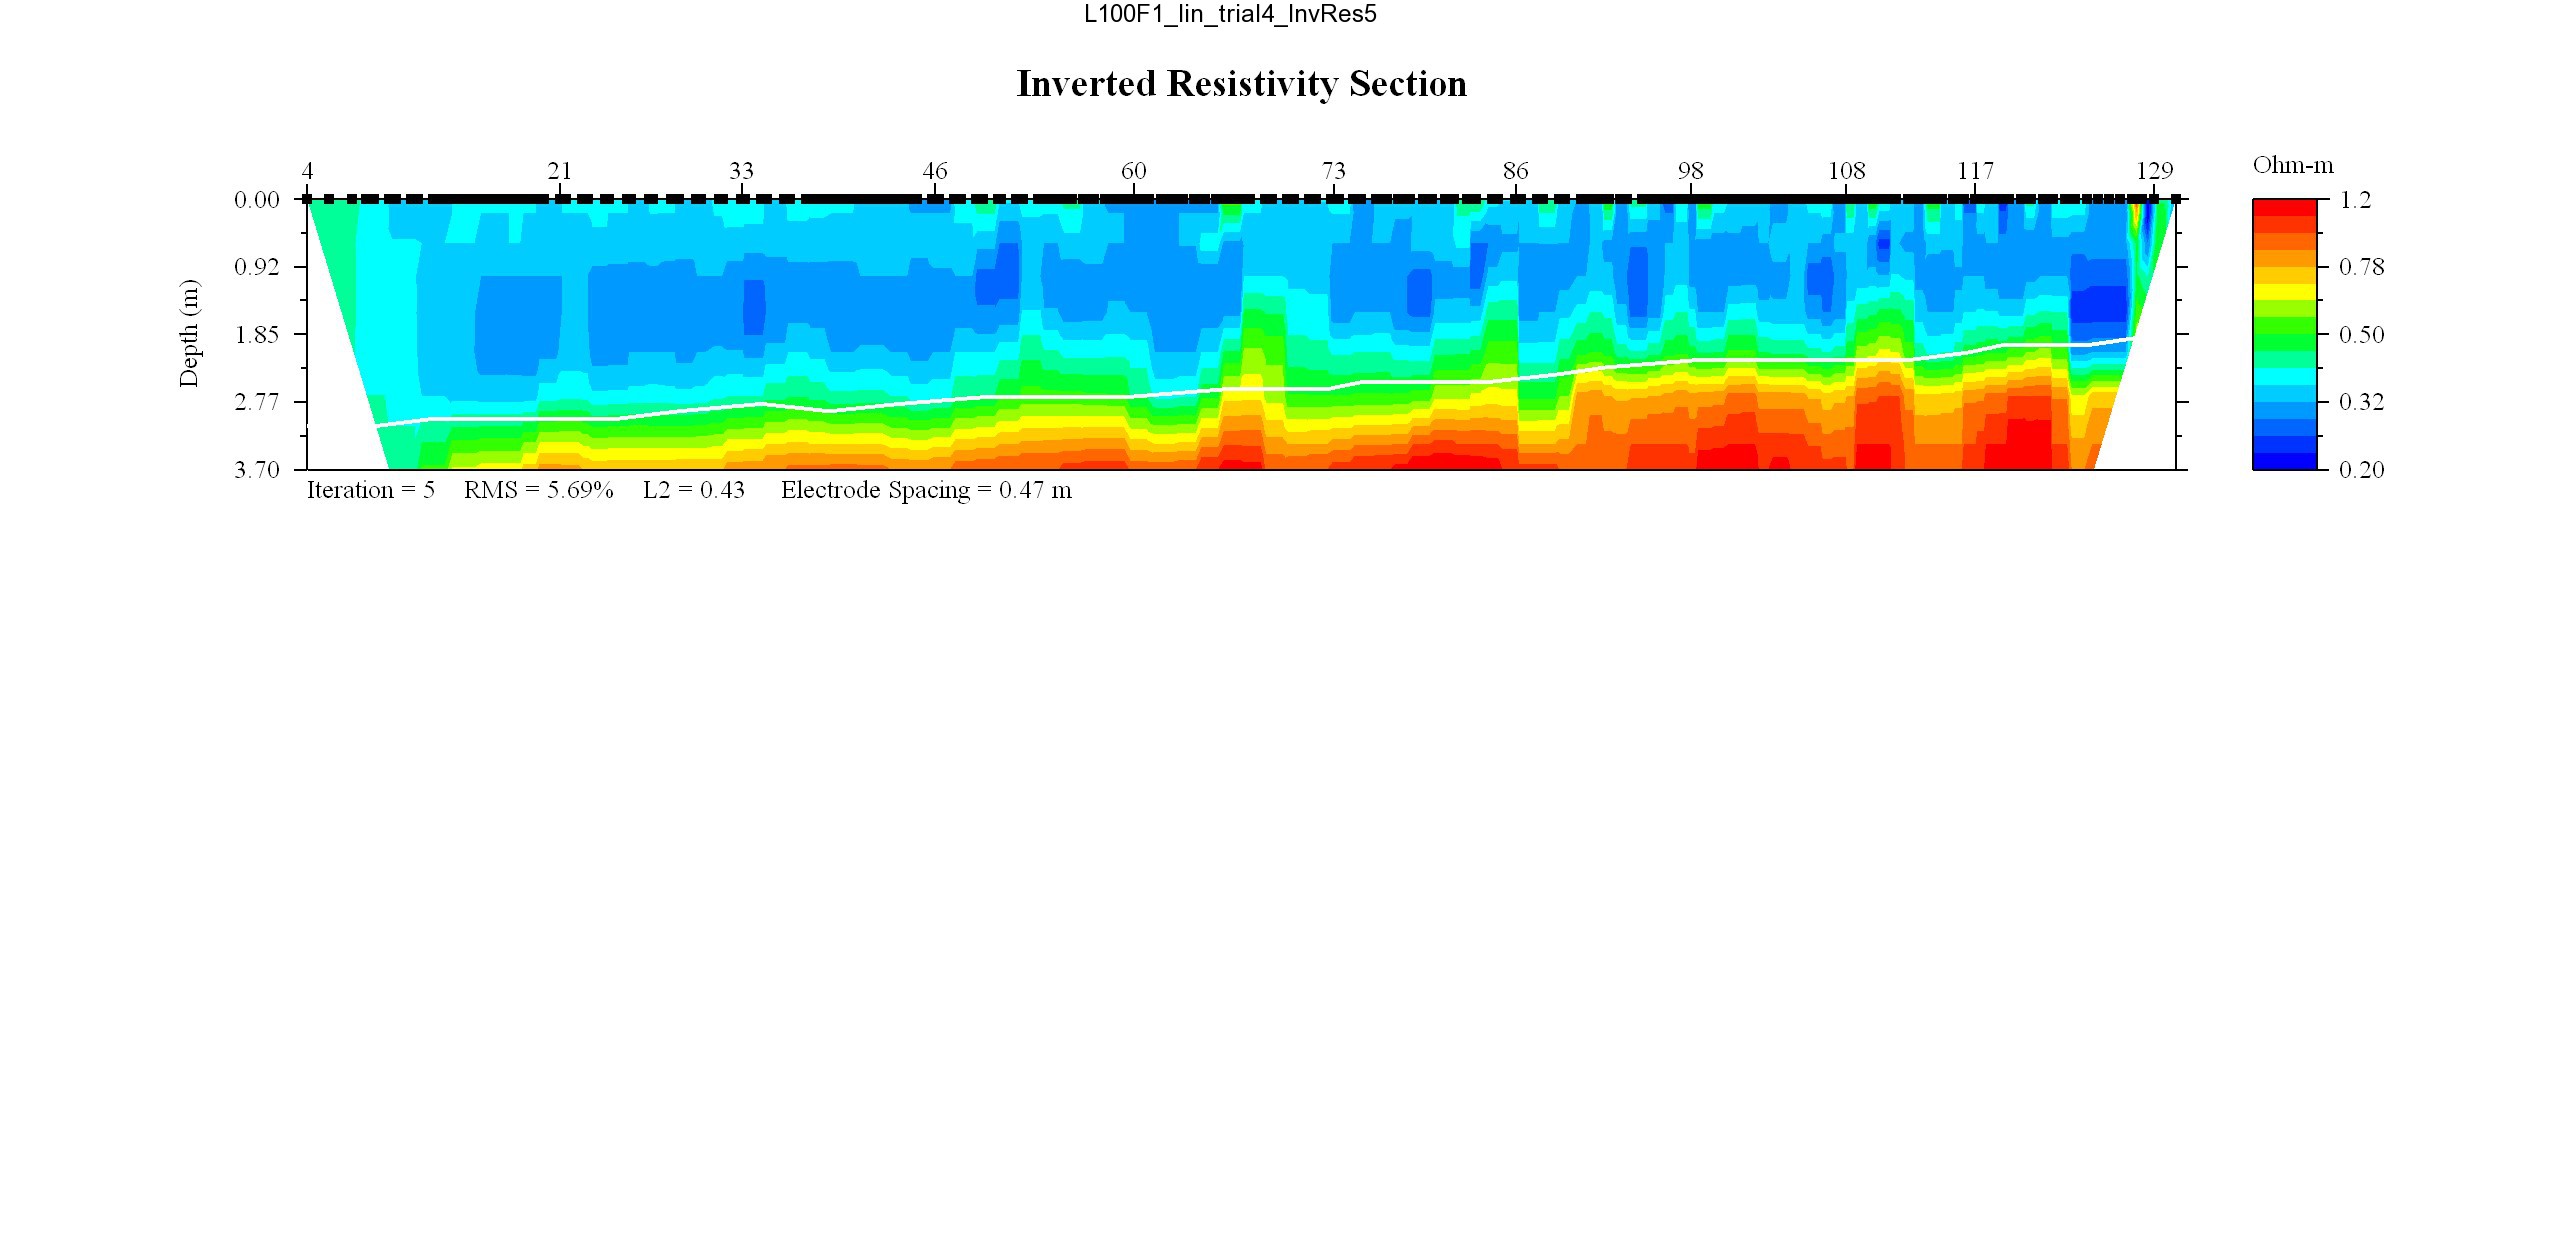
May 17, 2008: Line L101F1, WRES = 0.35
EarthImager thumbnail JPEG image of line 101 resistivity profile.
MATLAB thumbnail JPEG image of line 101 resistivity profile.
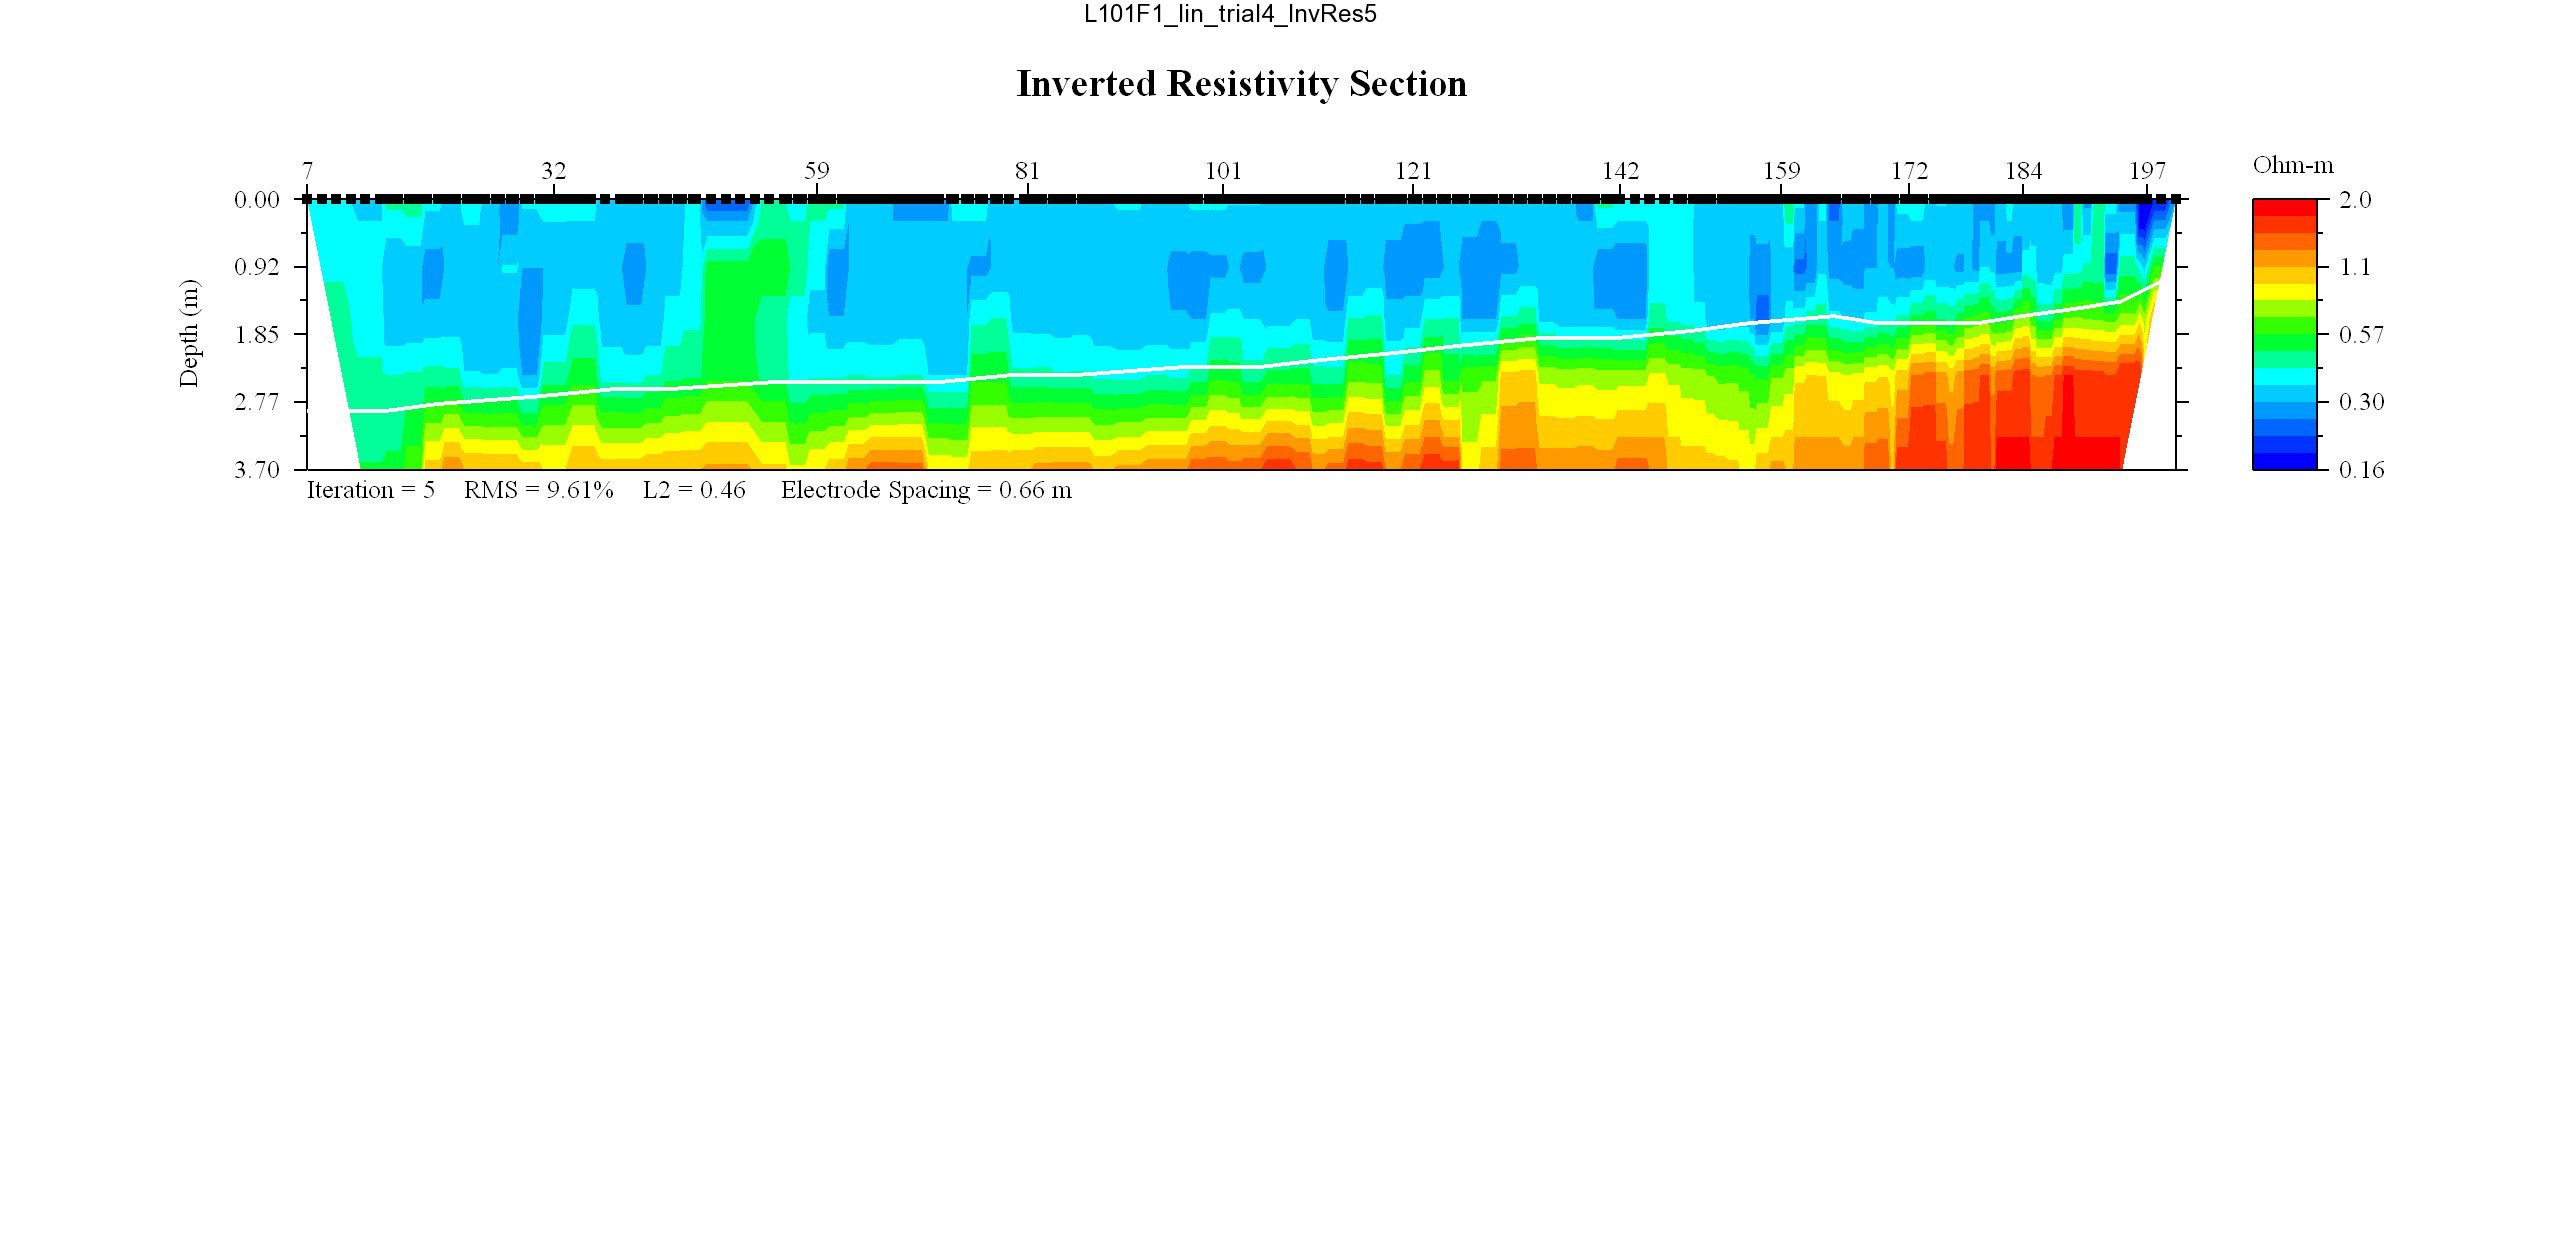
May 17, 2008: Line L102F1, WRES = 0.35
EarthImager thumbnail JPEG image of line 102 resistivity profile.
MATLAB thumbnail JPEG image of line 102 resistivity profile.
May 17, 2008: Line L103F1, WRES = 0.35
EarthImager thumbnail JPEG image of line 103 resistivity profile.
MATLAB thumbnail JPEG image of line 103 resistivity profile.
May 17, 2008: Line L104F1, WRES = 0.35
EarthImager thumbnail JPEG image of line 104 resistivity profile.
MATLAB thumbnail JPEG image of line 104 resistivity profile.
May 17, 2008: Line L105F1, WRES = 0.35
EarthImager thumbnail JPEG image of line 105 resistivity profile.
MATLAB thumbnail JPEG image of line 105 resistivity profile.
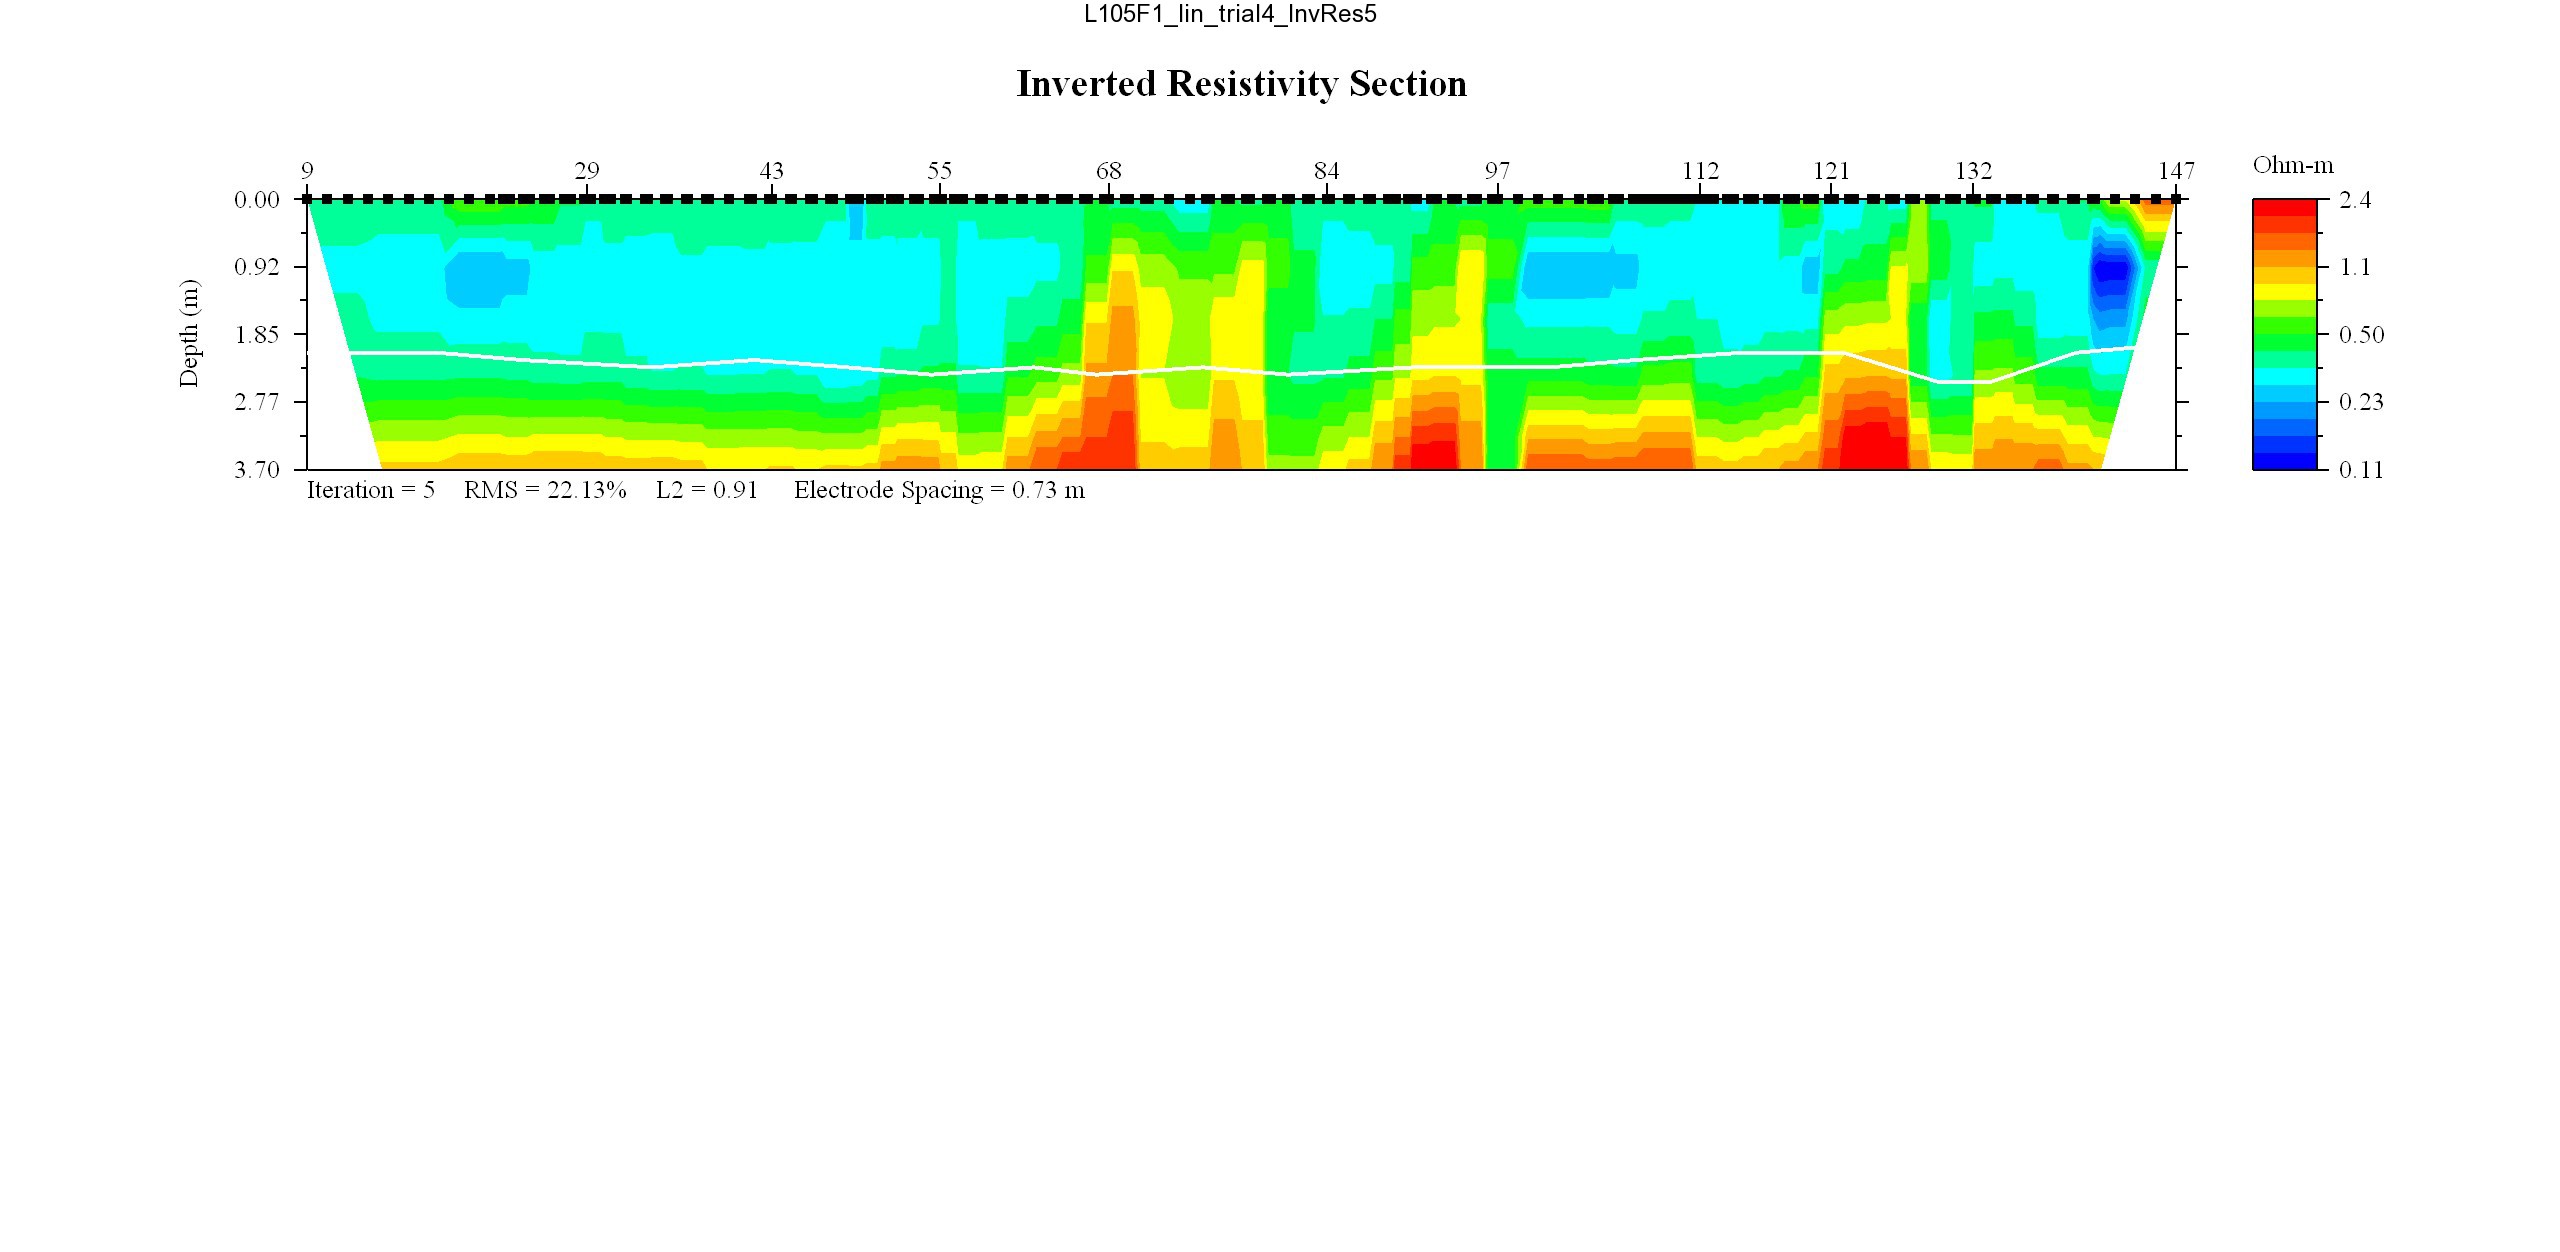
May 17, 2008: Line L106F1, WRES = 0.35
EarthImager thumbnail JPEG image of line 106 resistivity profile.
MATLAB thumbnail JPEG image of line 106 resistivity profile.
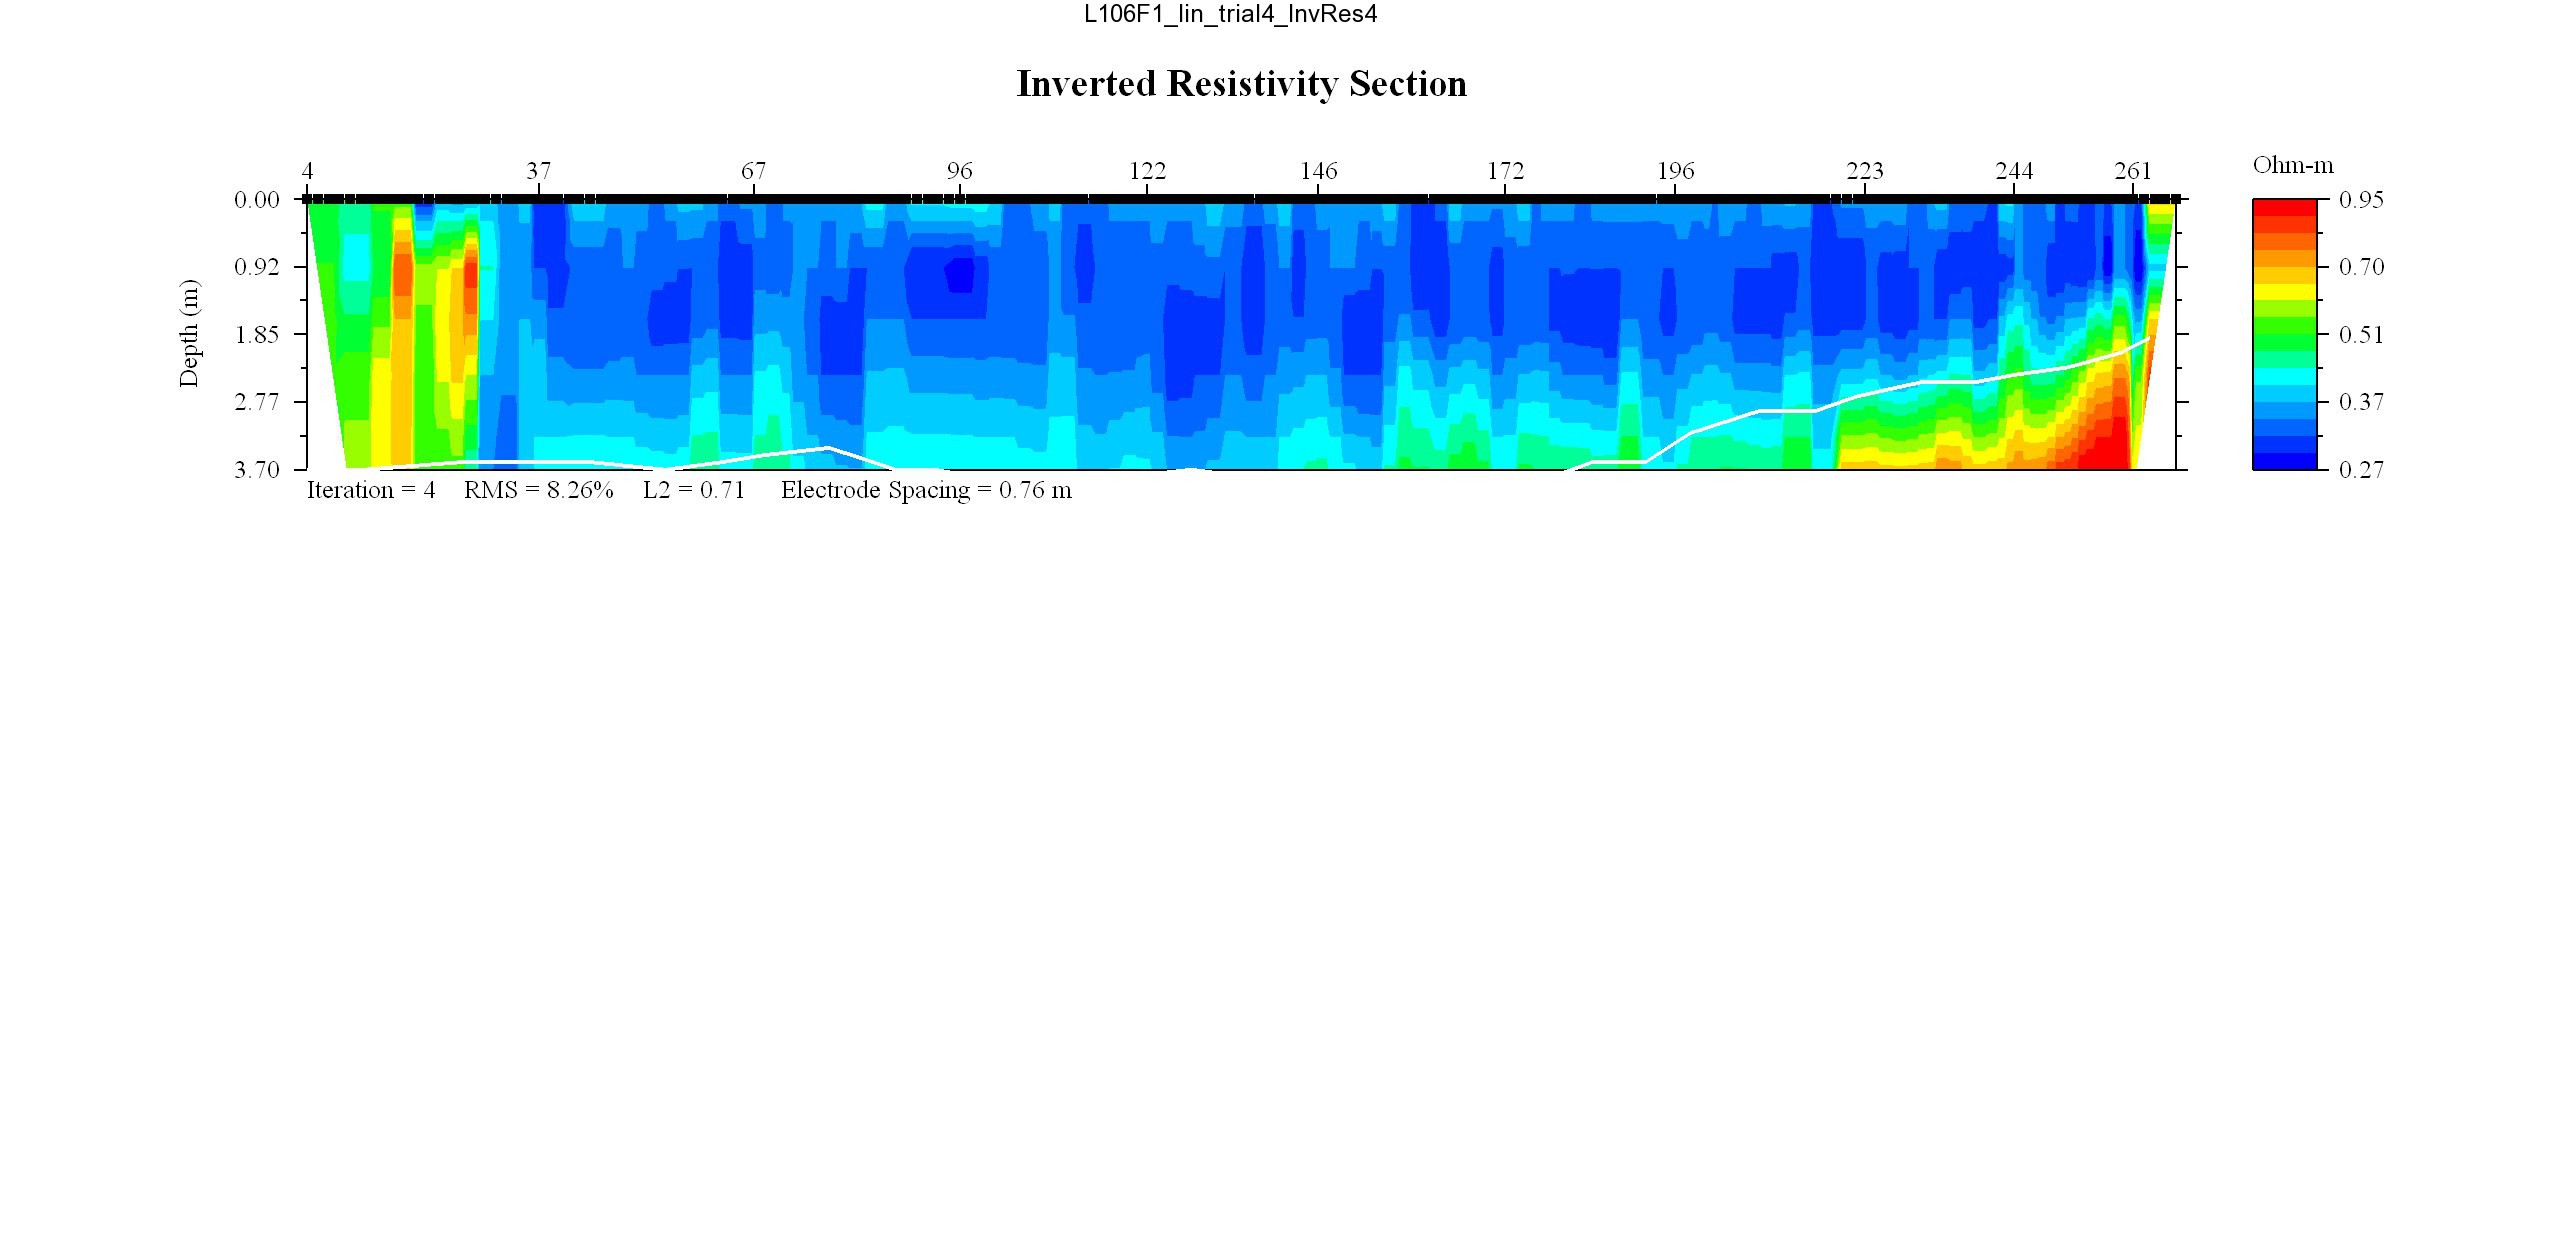
May 17, 2008: Line L107F1, WRES = 0.35
EarthImager thumbnail JPEG image of line 107 resistivity profile.
MATLAB thumbnail JPEG image of line 107 resistivity profile.
May 17, 2008: Line 4108F1, WRES = 0.35
EarthImager thumbnail JPEG image of line 108 resistivity profile.
MATLAB thumbnail JPEG image of line 108 resistivity profile.
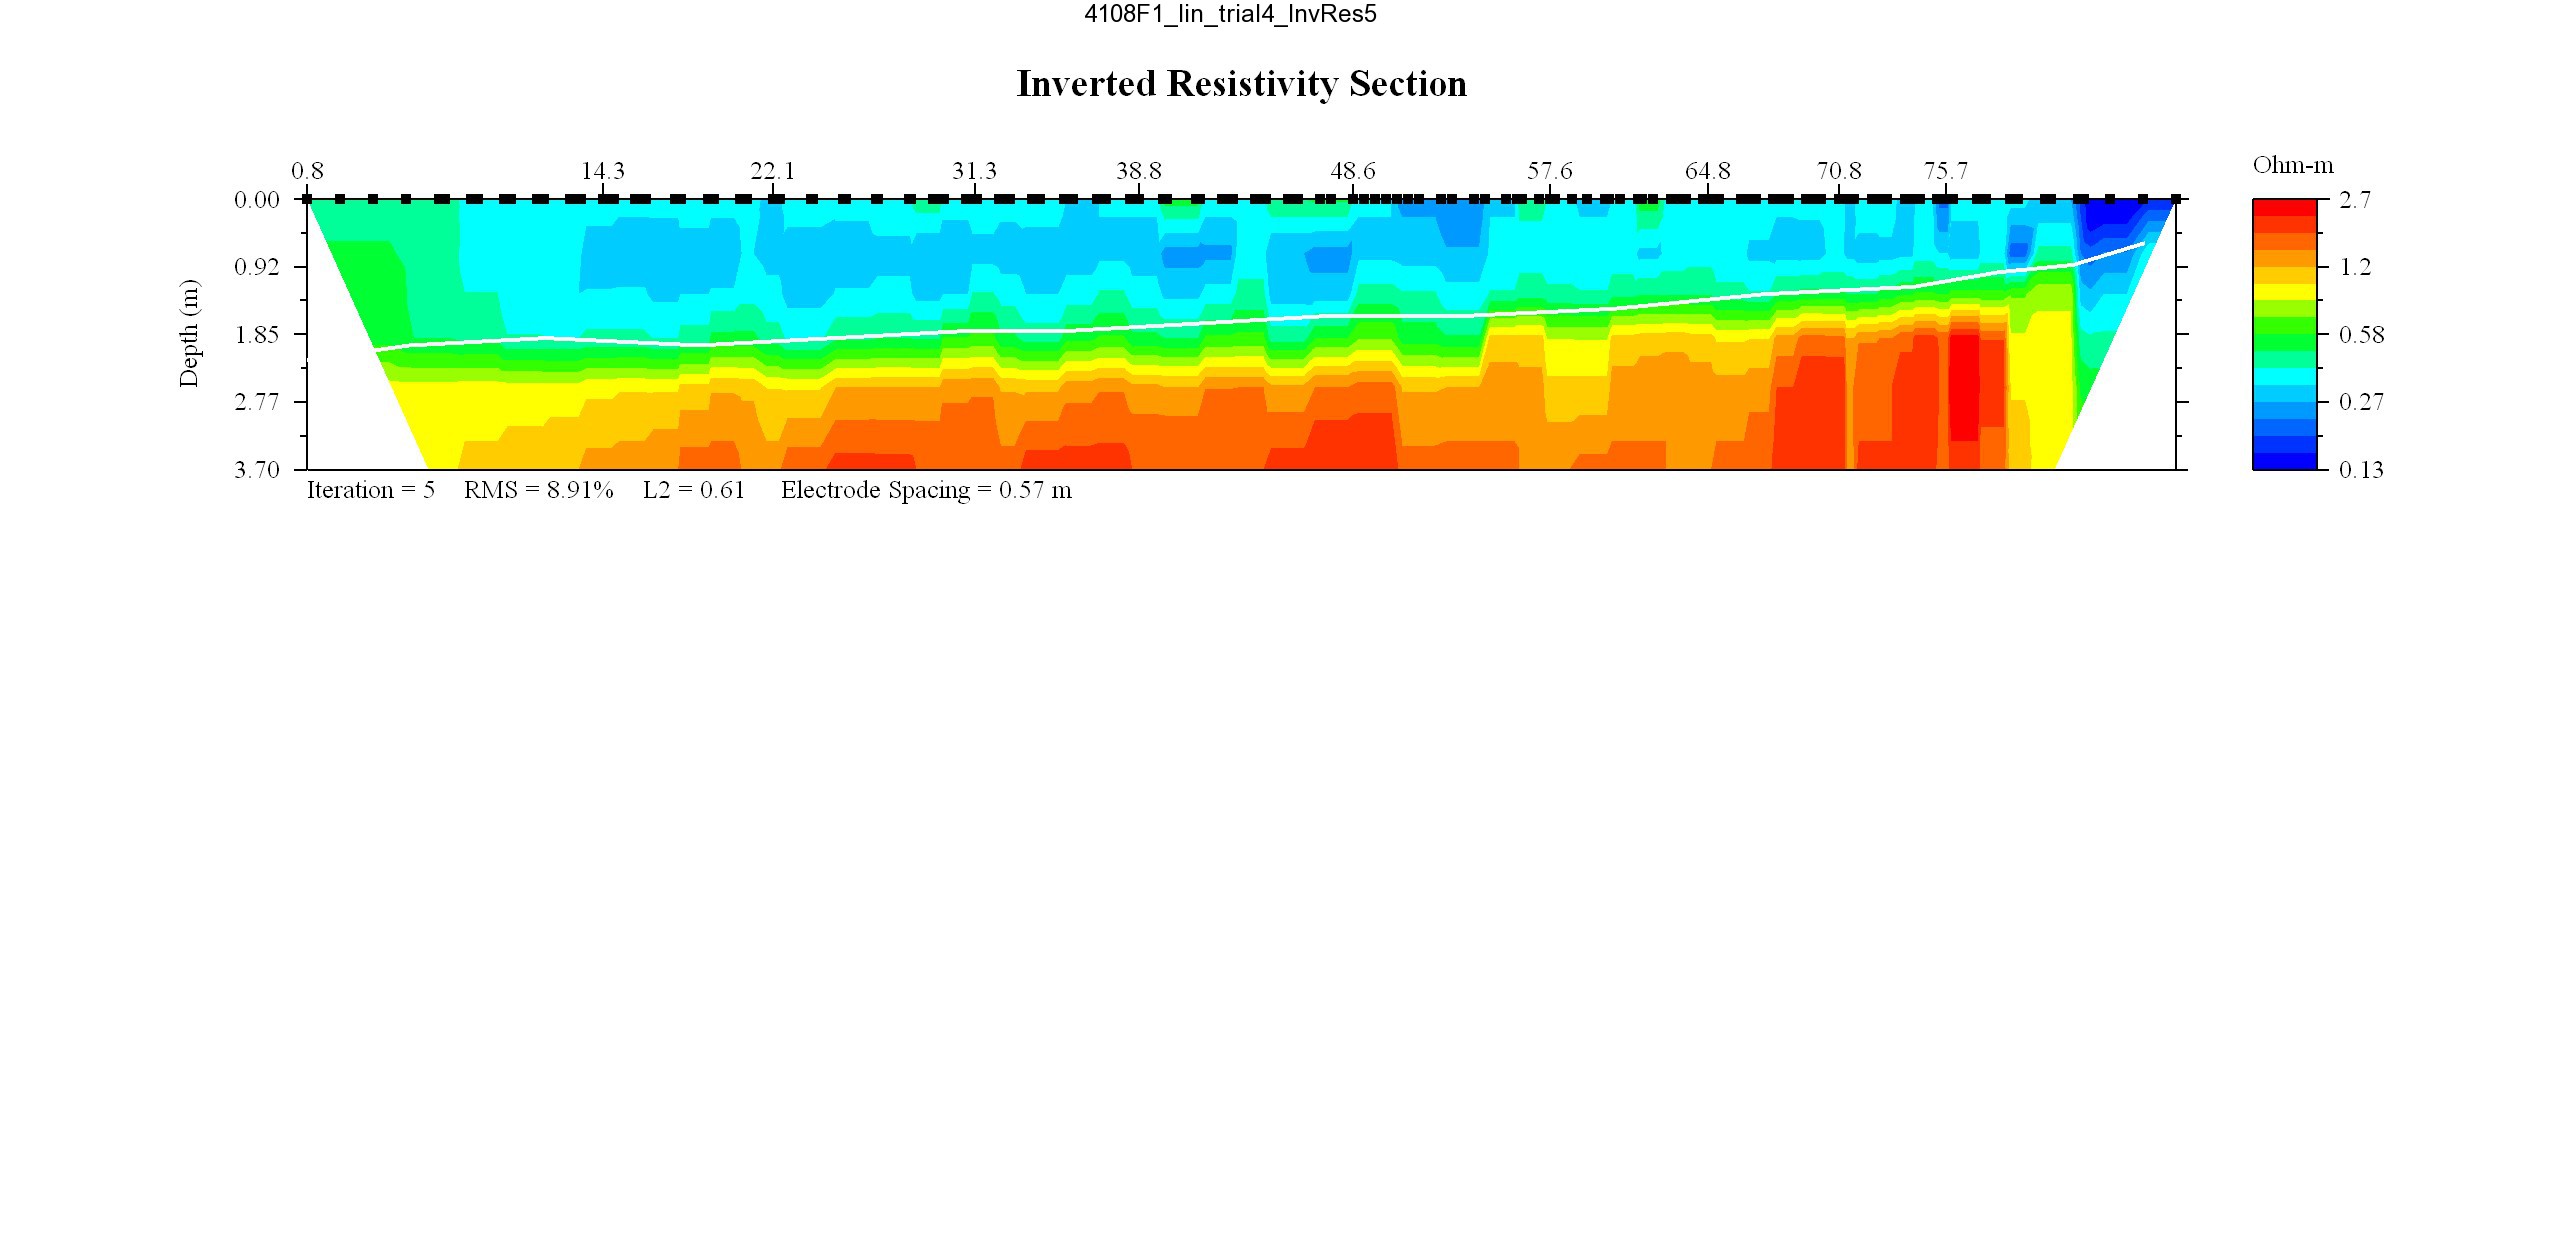
May 17, 2008: Line L109F1, WRES = 0.35
EarthImager thumbnail JPEG image of line 109 resistivity profile.
MATLAB thumbnail JPEG image of line 109 resistivity profile.
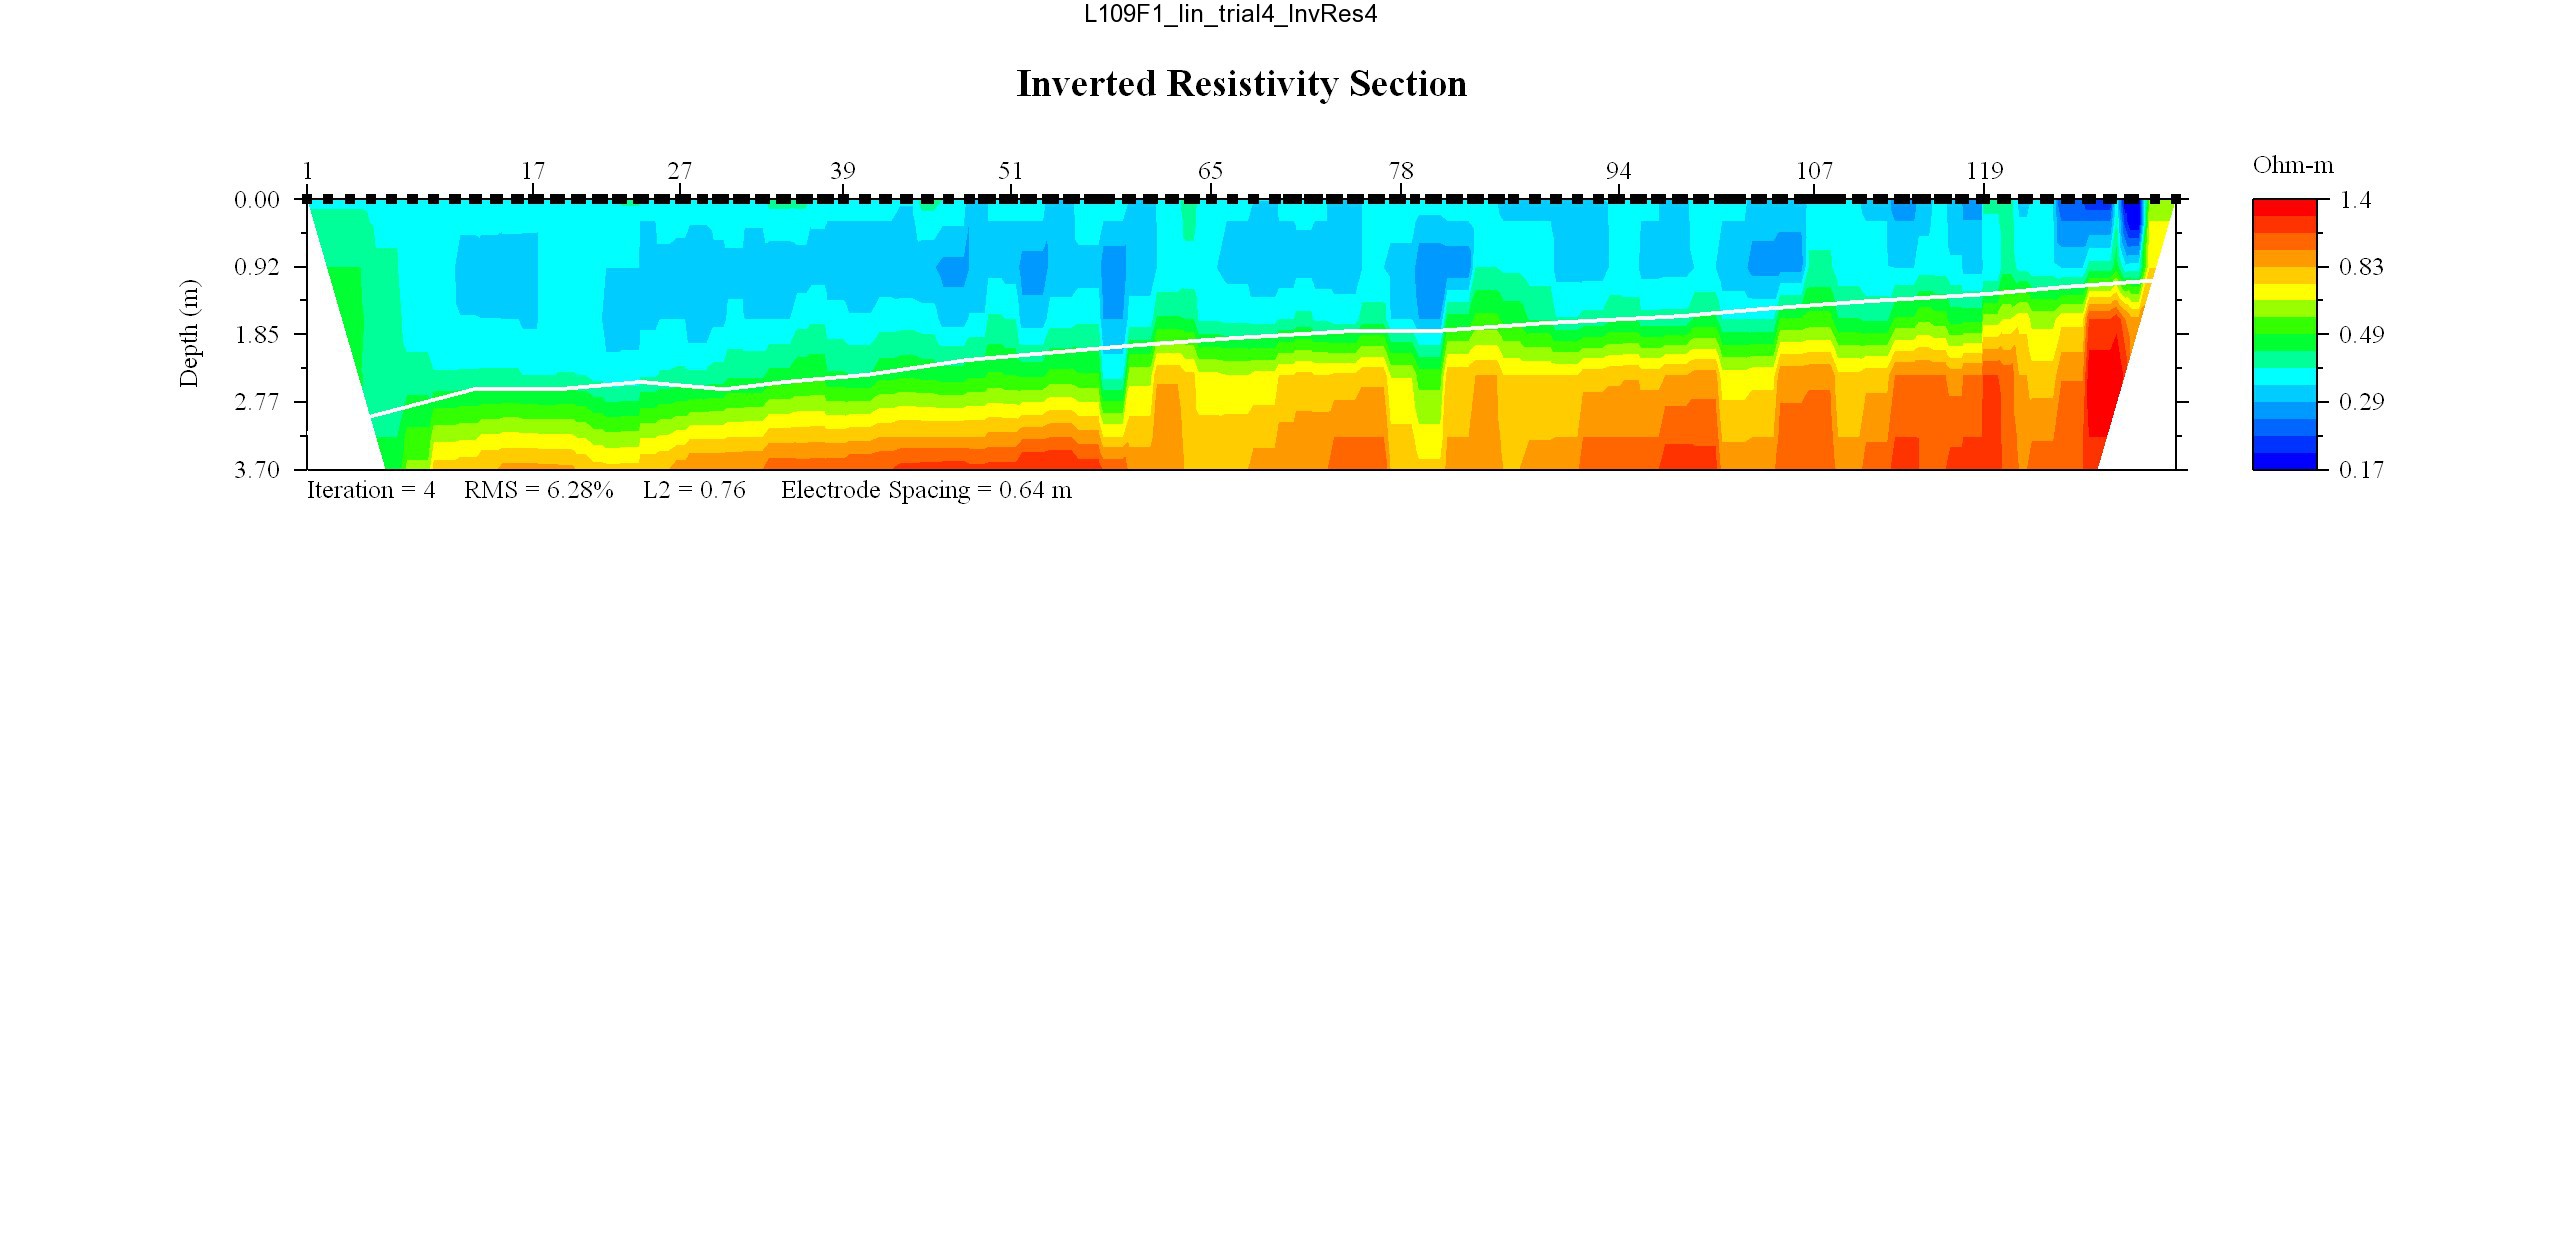
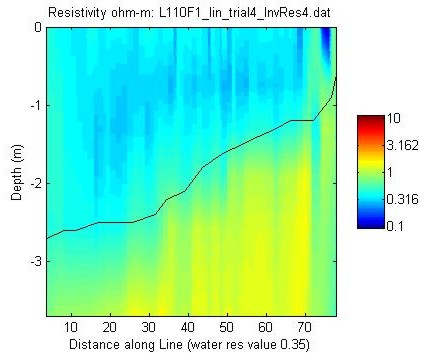
May 17, 2008: Line L110F1, WRES = 0.35
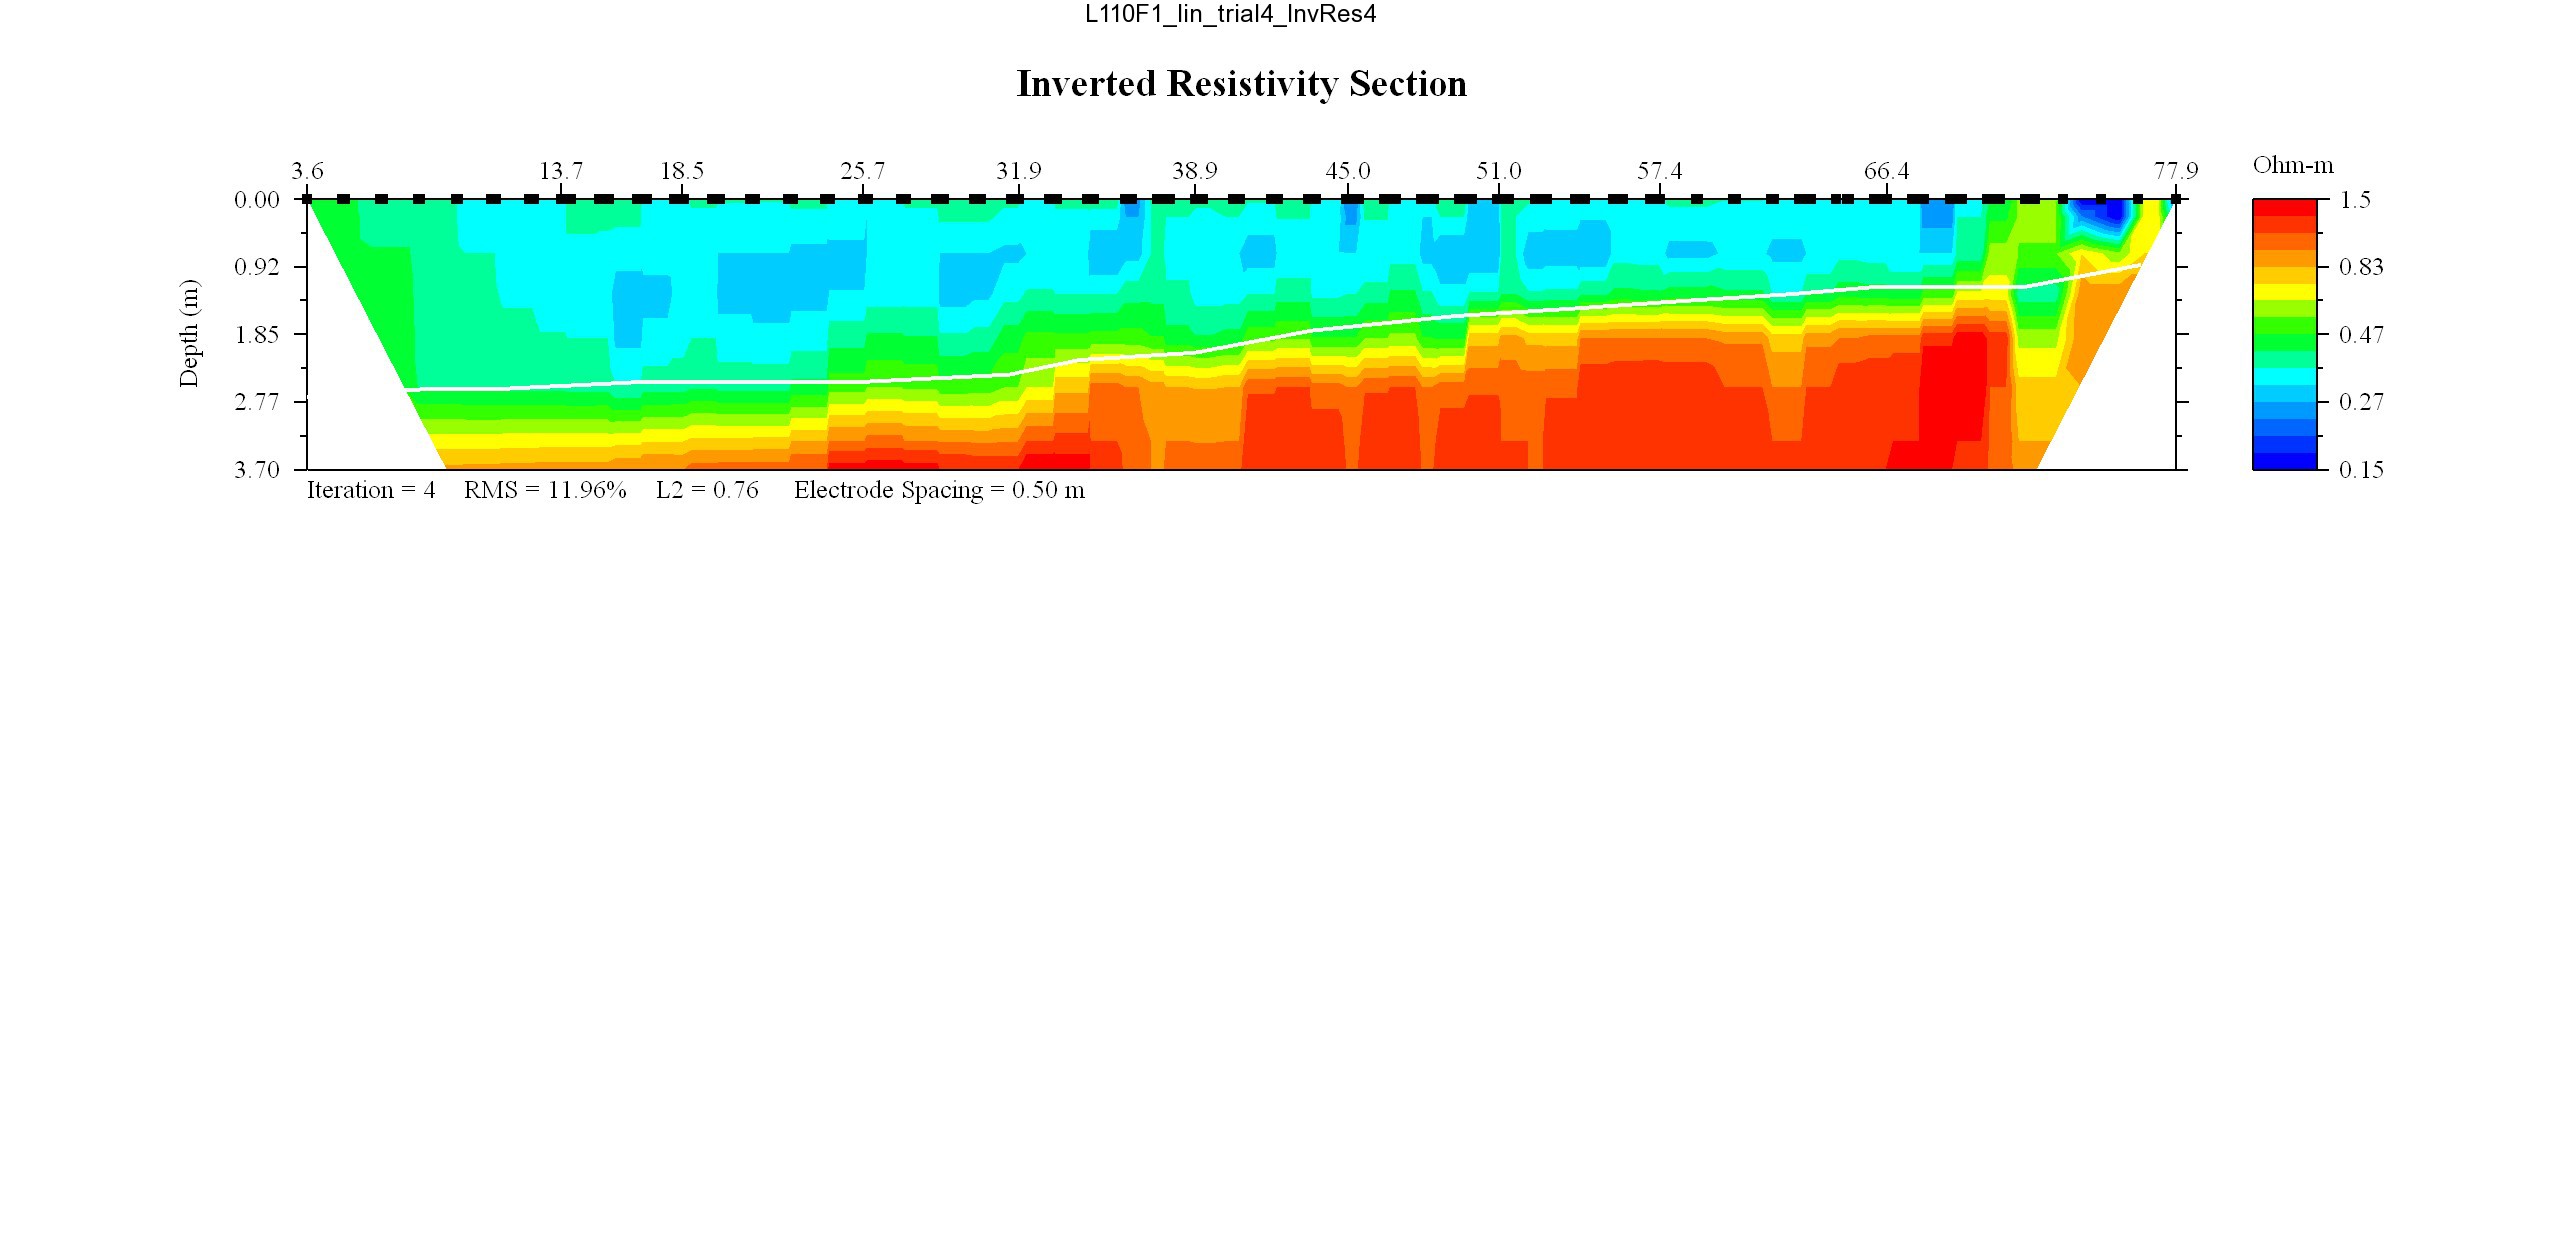
EarthImager thumbnail JPEG image of line 110 resistivity profile.
MATLAB thumbnail JPEG image of line 110 resistivity profile.
Skip USGS links group

Accessibility FOIA Privacy Policies and Notices

Take Pride in America logo USAGov logo U.S. Department of the Interior | U.S. Geological Survey
End of USGS links group

Link to line 97 EarthImager and MATLAB JPEG profiles. Link to line 98 EarthImager and MATLAB JPEG profiles. Link to line 99 EarthImager and MATLAB JPEG profiles. Link to line 96 EarthImager and MATLAB JPEG profiles. Link to line 100 EarthImager and MATLAB JPEG profiles. Link to line 101 EarthImager and MATLAB JPEG profiles. Link to line 102 EarthImager and MATLAB JPEG profiles. Link to line 106 EarthImager and MATLAB JPEG profiles. Link to line 107 EarthImager and MATLAB JPEG profiles. Link to line 108 EarthImager and MATLAB JPEG profiles. Link to line 105 EarthImager and MATLAB JPEG profiles. Link to line 103 EarthImager and MATLAB JPEG profiles. Link to line 104 EarthImager and MATLAB JPEG profiles. Link to line 109 EarthImager and MATLAB JPEG profiles. Link to line 110 EarthImager and MATLAB JPEG profiles. Link to line 71 EarthImager and MATLAB JPEG profiles. Link to line 72 EarthImager and MATLAB JPEG profiles. Link to line 73 EarthImager and MATLAB JPEG profiles. Link to line 74 EarthImager and MATLAB JPEG profiles. Link to line 75 EarthImager and MATLAB JPEG profiles. Link to line 76 EarthImager and MATLAB JPEG profiles. Link to line 77 EarthImager and MATLAB JPEG profiles. Link to line 78 EarthImager and MATLAB JPEG profiles. Link to line 79 EarthImager and MATLAB JPEG profiles. Link to line 80 EarthImager and MATLAB JPEG profiles. Link to line 95 EarthImager and MATLAB JPEG profiles. Link to line 94 EarthImager and MATLAB JPEG profiles. Link to line 93 EarthImager and MATLAB JPEG profiles. Link to line 92 EarthImager and MATLAB JPEG profiles. Link to line 91 EarthImager and MATLAB JPEG profiles. Link to line 90 EarthImager and MATLAB JPEG profiles. Link to line 89 EarthImager and MATLAB JPEG profiles. Link to line 81 EarthImager and MATLAB JPEG profiles. Link to line 82 EarthImager and MATLAB JPEG profiles. Link to line 83 EarthImager and MATLAB JPEG profiles. Link to line 84 EarthImager and MATLAB JPEG profiles. Link to line 85 EarthImager and MATLAB JPEG profiles. Link to line 86 EarthImager and MATLAB JPEG profiles. Link to line 87 EarthImager and MATLAB JPEG profiles. Link to line 88 EarthImager and MATLAB JPEG profiles.