U.S. Geological Survey Open-File Report 2012-1003
Apalachicola Bay Interpreted Seismic Horizons and Updated IRIS Chirp Seismic-Reflection Data
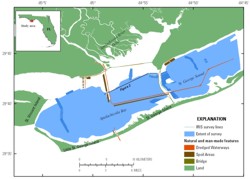
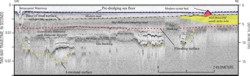
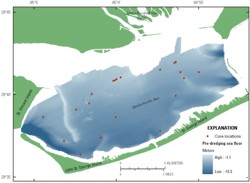
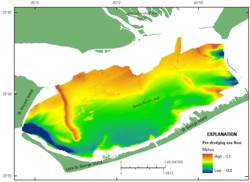
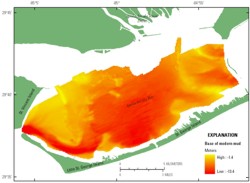
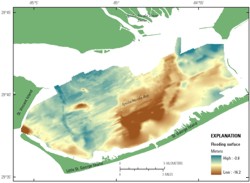
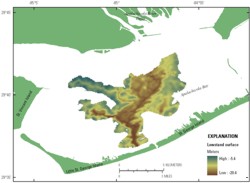
Apalachicola Bay and St. George Sound are home to the largest oyster fishery in Florida, and the distribution of oyster beds in the bay is controlled by both modern estuarine conditions (Livingston and others, 2000) and the late Holocene evolution of the bay (Twichell and others, 2010). An extensive geophysical survey of a large part of Apalachicola Bay and St. George Sound was conducted in 2005 and 2006 (Twichell and others, 2007) by the U.S. Geological Survey (USGS) in collaboration with the National Oceanic and Atmospheric Administration Coastal Services Center and the Apalachicola National Estuarine Research Reserve to map the distribution of oyster beds in the bay and define their relation to the underlying geology (fig. 1). Most oyster beds in this bay occupy shallow shoals that were inaccessible to the survey vessel that was employed to conduct the majority of the survey, and consequently these regions had to be surveyed with the shallow-draft remotely operated vehicle, IRIS (Bergeron and others, 2007). Geophysical data are presented in Twichell and others (2007), but errors in the previously released seismic data collected from IRIS required that they be corrected and released again. This report also contains four surfaces (fig. 2) that were created from interpreted seismic data. These surfaces, from youngest to oldest, include the bathymetry of the bay prior to modification by channel dredging, the base of the modern mud deposit, the bay flooding surface (separates lowstand channel fill from modern estuarine fill), and a Pleistocene sea-level lowstand surface. Cores collected in the bay (fig. 3) were used to describe the surfaces and intervening deposits. Radiocarbon dates on samples from the cores were used to constrain ages of some of the surfaces (Osterman and others, 2009; Twichell and others, 2009). These interpreted geologic surfaces are used to reconstruct the Holocene history of Apalachicola Bay and are described below. Four Seismic Surfaces The sea floor was mapped using interferometric bathymetry and seismic-reflection profiles (Twichell and others, 2007). For this report only depths along the survey lines were used, for reasons discussed in the Methods section. Additionally, in order to eliminate the effect of recent anthropogenic activity on surfaces representing the bay evolution, areas occupied by channels and dredge spoil deposits were removed from the bathymetry data points, and then the surface was interpolated across these areas (fig. 4). Depths on this surface range from -1.1 to -13.3 meters (m). The base of modern mud marks the base of the youngest (non-anthropogenic) deposit in the bay (fig. 5). This deposit is acoustically transparent on seismic profiles and buries older deposits with varying acoustic characteristics. The underlying deposits show as a series of parallel low-amplitude reflectors that locally are capped by a high-amplitude reflector. Areas characterized by this high-amplitude reflector often have positive relief associated with them and are only partially buried by the youngest deposit (fig. 2). Cores show that this young, acoustically transparent deposit is silty clay and that the parts of the underlying deposit characterized by weak-amplitude reflectors are silty and those areas characterized by high-amplitude reflectors coincide with sandy deposits (fig. 2). Depths to this surface range from -1.4 to -13.4 m. The flooding surface separates the modern estuarine deposits from either underlying Pleistocene deposits or Holocene sediment that fills the lowstand river valleys (fig. 6). On seismic profiles this surface has a high-amplitude signature where it separates Pleistocene deposits from Holocene estuarine fill and has a moderate-amplitude signature where it crosses the paleovalleys. Lowstand channel fill is characterized by parallel, continuous, closely spaced reflectors with moderate acoustic amplitude and is overlain by weak-amplitude reflectors (fig. 2). Depths to this surface range from -3.8 to -16.2 m. The lowstand surface is an irregular erosional surface cut by rivers during Pleistocene lowstands of sea level. In the Apalachicola Bay region, this surface was carved by the Apalachicola River and its tributaries and is shaped into a dendritic network of valleys that drain to the south (fig. 7). The surface is identified on seismic profiles as an irregular reflector that separates the underlying acoustically massive material from overlying acoustic units characterized by parallel, continuous closely spaced reflectors (fig. 2). In one boring through the axis of the paleovalley this surface separates Holocene estuarine and deltaic mud and fine sand from underlying Pleistocene and older coarse sands (Schnable and Goodell, 1968). Depths to this surface range from -5.4 to -20.4 m. Holocene Evolution of the Bay The four surfaces described above formed during stages of evolution of Apalachicola Bay and are used here to reconstruct the history of the bay. During Pleistocene lowstands of sea level a larger river valley extended under the bay and connected with a valley that extended south across the continental shelf (Donoghue, 1993; McKeown and others, 2004). This valley was most recently modified during the last lowstand of sea level, when the final erosional touches were put on the lowstand surface (fig. 7). As sea level rose during the Holocene, the valley was flooded starting about 9,000 years before the present and filled with sediment delivered by the Apalachicola River. These early Holocene deposits were confined to the limits of the paleovalley (Schnable and Goodell, 1968). The higher amplitude of reflectors within this valley-fill unit is attributed to the sandy nature of these deposits (fig. 2). Between 6,000 and 4,000 years before the present, barrier islands formed and isolated the bay from the Gulf of Mexico (Schnable and Goodell, 1968; Osterman and others, 2009). Simultaneously, due to the continued rise of sea level, the delta that was filling the lowstand valley retreated shoreward of the present bay and the bay itself became flooded. Evidence of this landward retreat of the delta comes from shell middens associated with archeological sites in the lower Apalachicola River valley (Donoghue and White, 1995). One shell midden 8 kilometers (km) upstream of the present delta edge shows a transition from open-estuarine mollusks (Crassostrea) to fresh-to-brackish water mollusks (Rangia), suggesting that the delta advanced southward past this site approximately 3,000 years before the present. Because the delta was well shoreward of the bay, only fine-grained Apalachicola River sediment reached the bay, and, because the barrier islands now enclosed the bay, these sediments were trapped and deposited on the flooding surface (fig. 6). The estuarine sediments that accumulated above the flooding surface initially were fine grained but coarsen upward in response to deltas advancing into the bay. The final step in this stage of the development of the bay was the formation of sandy deltas, which extended across the bay from the mouths of the Apalachicola River and its tributaries (Osterman and others, 2009; Twichell and others, 2010). These sandy deltas show on the seismic profiles as high-amplitude reflectors (fig. 2). The base of mud surface (fig. 5) marks the end of this stage of sedimentation in the bay and the transition to the final stage. The final stage in the bay's history was initiated by colonization of sandy delta deposits by oysters (Crassostrea). Once established, these oyster reefs started to be buried by silty clays that the river continued to supply to the bay. The abrupt transition from deposition of sandy deltas in the bay to silty clay appears to be due to the continued rise of sea level, forcing the Apalachicola River delta to retreat shoreward to its present location. This shoreward retreat of the delta may have been particularly abrupt because of a possible higher than present stand of sea level approximately 2,000 years before the present (Balsillie and Donoghue, 2004). Since this time the suspended sediment load of the Apalachicola River has continued to fill the bay, completely burying some oyster reefs and only the margins of others (Twichell and others, 2010). |