List of Figures- Click on figure for larger image.
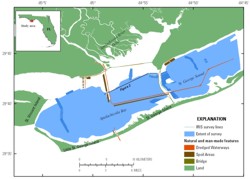
Figure 1. Location map showing the extent of the study area and the sections surveyed by the autonomous surface vessel IRIS. Heavy black line shows the location of figure 2.
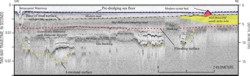
Figure 2. Seismic-reflection profile showing four surfaces (lowstand, flooding, base of mud, and pre-dredging sea floor) included in this report. Profile location shown on figure 1.
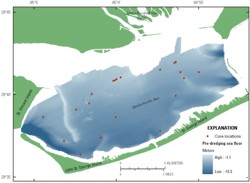
Figure 3. Map showing the core locations in Apalachicola Bay.
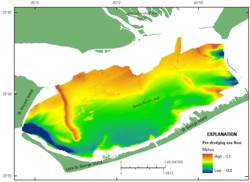
Figure 4. Map showing the sea-floor surface of Apalachicola Bay prior to the dredging of the Gulf Intracoastal Waterway.
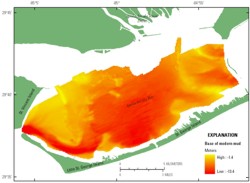
Figure 5. Map showing the contact between the base of the modern mud deposit and the underlying middle Holocene estuarine and deltaic deposits in Apalachicola Bay.
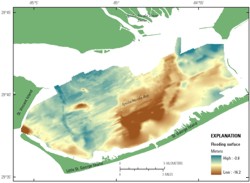
Figure 6. Map showing the depth to the flooding surface in Apalachicola Bay.
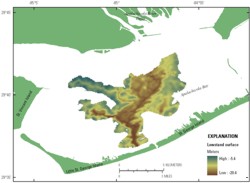
Figure 7. Map showing the depth to the lowstand surface in Apalachicola Bay.
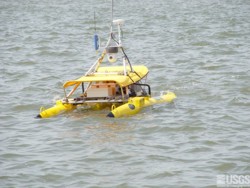
Figure 8. Photograph of the autonomous surface vessel IRIS.
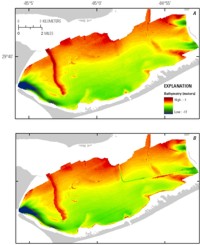
Figure 9. Map showing the comparison between the sea-floor surface generated from (A) gridding swath bathymetry data at the spacing of the seismic shot-point navigation supplemented with interpreted seismic-reflection profiles where swath data were unavailable and (B) the surface generated from all the high-resolution swath bathymetry data (available from Twichell and others, 2007). This comparison provides validity of gridding methods of horizon data at the point spacing of the interpreted seismic-reflection profiles. Part A was created omitting manmade features such as dredge spoils and the Intracoastal Waterway. The color scale used in Part B is the same as in Part A.