Open-File Report 2012-1274
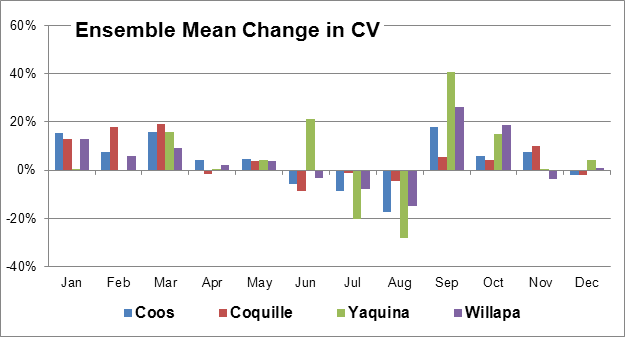
Figure 28. Graph showing climate scenario ensemble mean change in monthly coefficient of variation (CV) from reference period (1971–1995) to future period (2041–2065), by study-area watershed. |
First posted February 28, 2013
For additional information contact: Part or all of this report is presented in Portable Document Format (PDF); the latest version of Adobe Reader or similar software is required to view it. Download the latest version of Adobe Reader, free of charge. |

![]() U.S. Department of the Interior |
U.S. Geological Survey
U.S. Department of the Interior |
U.S. Geological Survey
URL: http://pubsdata.usgs.gov/pubs/of/2012/1274/figure28.html
Page Contact Information: GS Pubs Web Contact
Page Last Modified: Thursday, 28-Feb-2013 19:44:12 EST
