Open-File Report 2012-1274
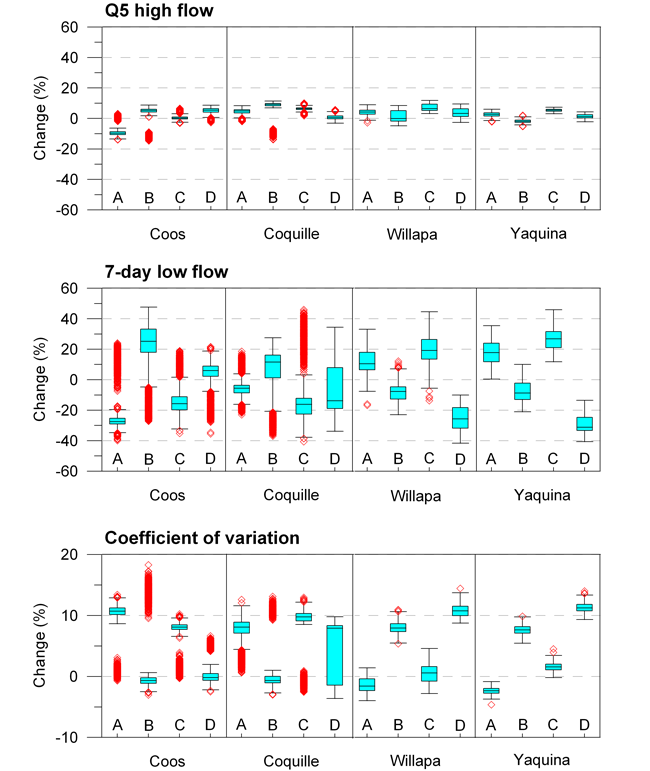
Figure 35. Box-and-whisker plots showing changes in top 5 percent high flow, 7-day low flow, and coefficient of variation for four study areas. The lines in the middle of boxes denote the median values, and the upper and lower boundaries of the boxes show the 25th and 75th percentiles, respectively. The red diamond symbol indicates outliers. A is for RCM3-CGCM, B is for HRM3-HADCM3, C is for CRCM-CGCM3, and D is for CRCM-CCSM. |
First posted February 28, 2013
For additional information contact: Part or all of this report is presented in Portable Document Format (PDF); the latest version of Adobe Reader or similar software is required to view it. Download the latest version of Adobe Reader, free of charge. |

![]() U.S. Department of the Interior |
U.S. Geological Survey
U.S. Department of the Interior |
U.S. Geological Survey
URL: http://pubsdata.usgs.gov/pubs/of/2012/1274/figure35.html
Page Contact Information: GS Pubs Web Contact
Page Last Modified: Thursday, 28-Feb-2013 19:44:12 EST
