Open-File Report 2014–1012
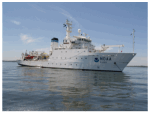
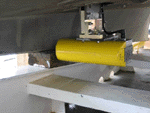
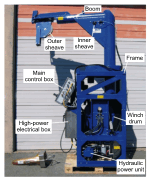
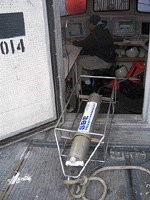
The 63-m NOAA Ship Thomas Jefferson and two 8.5-m aluminum Jensen launches (3101 and 3102) deployed from the ship acquired multibeam-echosounder (MBES) data for 14 hydrographic surveys in Rhode Island and Block Island Sounds over an approximately 1244.5-km² area between July 2008 and November 2011 (figs. 2, 3, 4). Registry numbers for the completed surveys include H11922, H11995, H11996, H12009, H12010, H12011, H12015, H12023, H12033, H12137, H12139, H12296, H12298, and H12299. During 2008, the MBES data were collected with hull-mounted RESON SeaBat 240-kilohertz (kHz) 8101 and 455-kHz 8125 shallow-water systems aboard the launches and a RESON dual-frequency (200-kHz/400-kHz) 7125 system aboard the NOAA Ship Thomas Jefferson. During 2009 and 2011, the MBES data were collected with a hull-mounted RESON SeaBat 455-kHz 8125 shallow-water system aboard launch 3101 (fig. 5) and RESON single frequency (400-kHz) 7125 systems aboard launch 3102 and the NOAA Ship Thomas Jefferson (fig. 6). Original vertical resolution of the MBES data was 0.5 percent of the water depth. The bathymetric datasets were acquired and digitally logged with HYPACK and processed by NOAA using CARIS Hydrographic Image Processing System (HIPS) software to control quality, incorporate sound velocity and tidal corrections, and produce the combined bathymetry adjusted for statistical error (BASE) surfaces. Horizontal positioning was by differential global positioning systems (DGPS); HYPACK was used for acquisition-line navigation. Sound-velocity corrections were derived with frequent conductivity-temperature-depth profiles. A Brooke Ocean Technology Moving Vessel Profiler (MVP) with an Applied Microsystems Smart Sound Velocity and Pressure (SV&P) sensor was used to collect sound-speed profile data from the ship (fig. 7). Manually deployed Seabird Electronics SBE-19+ CTD units were used to collect sound speed profile data from the launches (fig. 8). Tidal-zone corrections were calculated from data acquired by the National Water Level Observation Network stations at New London, Conn. (8461490); Newport, R.I. (8452660); Menemsha Harbor, Mass. (8448725); and Montauk, N.Y. (8510560). The vertical datum is mean lower low water. Detailed descriptions of the MBES acquisition and processing by NOAA can be found in the Descriptive Reports (National Oceanic and Atmospheric Administration, 2008b, 2008c, 2008d, 2009c, 2009d, 2009e, 2009f, 2009g, 2009h, 2009i, 2009j, 2011b, 2011c, 2011d) and in the Data Acquisition and Processing Reports (National Oceanic and Atmospheric Administration, 2008a, 2009b, 2009a, 2011a). At the USGS, field sheets from the surveys were read back into the CARIS HIPS software, combined into a master BASE surface (ricomb) having a 4-m grid resolution, and exported from CARIS as a Bathymetric Attributed Grid (BAG) file. The BAG surface was imported as gridded data into Fledermaus to make an equivalent DTM file, and this file was then directly exported to ArcGIS as a bathymetric raster file, retaining all of the projection information and grid-cell size. Vertically exaggerated (5x), hill-shaded (illuminated from 45° north at an angle of 45° above the horizon) imagery was created by using CARIS HIPS software; reprojections were performed with ArcGIS data management tools. Metadata files in the Data Catalog section of this report contain detailed descriptions of the processing steps used by the USGS to create the combined datasets. These files can be accessed through the Data Catalog section of this report. The bathymetric grids and imagery released in this report should not be used for navigation. |

![]() U.S. Department of the Interior |
U.S. Geological Survey
U.S. Department of the Interior |
U.S. Geological Survey
URL: http://pubsdata.usgs.gov/pubs/of/2014/1012/html/methods.html
Page Contact Information: GS Pubs Web Contact
Page Last Modified: Wednesday, 07-Dec-2016 19:33:22 EST