Open-File Report 2014–1012
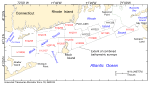
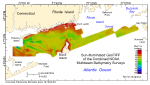
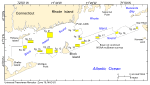
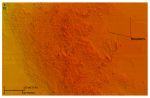
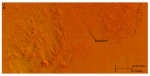
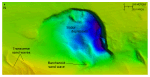
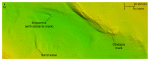
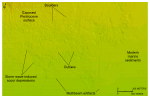
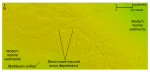
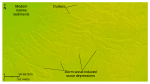
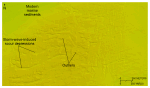
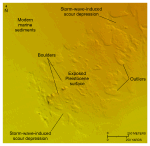
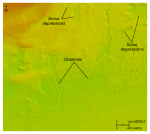
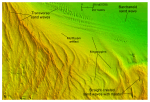
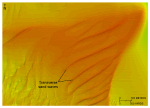
The study area covers most of Block Island Sound and seaward portions of Rhode Island Sound within water depths ranging from less than 1 to more than 103 m (figs. 1, 9). Other than near the shorelines of Block Island and southwestern Rhode Island and Fishers Island, New York, shallow areas are above isolated bathymetric highs, such as submerged moraines and shoals. The deepest waters are in western Block Island Sound near the entrance to Long Island Sound. Elsewhere the large-scale bathymetry in the study area is controlled by numerous minor ridges, channels, and knolls that are products of the study area’s Pleistocene glacial history and the subsequent Holocene eustatic rise in sea level (Needell and Lewis, 1984). The 4-m resolution of the DTM also allows us to identify specific morphological features of the sea-floor geology, sedimentary processes, and anthropogenic effects. Examples of features that can be identified in this dataset are reviewed in the following sections. Rocky OutcropsOver the past 15,000 years, energetic tidal- and storm-driven currents have removed or winnowed much of the glacial and younger sediment covering the study area’s sea floor, producing lag deposits of coarse gravel and boulders (Needell and Lewis, 1984; Gustavson and Boothroyd, 1987; Boothroyd, 2009; Poppe and others, 2011b; Poppe and others, 2012; McMullen and others, 2013). These lag deposits are coarsest where end moraines are exposed. Bouldery areas of sea floor associated with the Montauk Point-Block Island segment of the terminal moraine (figs. 10, 11, 12), which represents the maximum advance of the Laurentide ice sheet about 20,000 to 24,000 years ago, and the Point Judith moraine (figs. 11, 13), which represents a retreated ice-sheet position from about 18,000 to 21,000 years ago, are both exposed in the study area (Uchupi and others, 1996; Balco and others, 2011; Boothroyd, 2009; McMullen and others, 2012; Poppe and others, 2012; McMullen and others, 2013). Although seismic data suggests that bedrock may also crop out offshore of southwestern Rhode Island (Needell and Lewis, 1984; McMullen and others, 2009c; McMullen and others, 2009b), verification is difficult because rocky outcrops there are typically overgrown with sessile fauna and flora (McMullen and others, 2014) and because the outcrops are too small to exhibit features that have been used to infer exposed bedrock in eastern Long Island Sound, such as glacially smoothed ridges and strike ridges (Poppe and others, 2011a). Sedimentary environments within the rocky areas are characterized by processes associated with erosion or nondeposition. Scour FeaturesTidal currents enhanced by constricted flow are responsible for most of the high-energy sedimentary environments and much of the topography in Block Island Sound (Needell and Lewis, 1984; Boothroyd, 2009; Poppe and others, 2012; McMullen and others, 2013). These currents have maintained the channels originally formed by drainage patterns during the late Pleistocene, when the sea floor beneath the sound was subaerially exposed (Needell and Lewis, 1984; Boothroyd, 2009), that extend east and southeastward across the sound to Block Channel (Poppe and others, 2012). The tidal currents have also produced and maintained deep scour depressions associated with the late Pleistocene drainage patterns and located adjacent to The Race at the entrance to Long Island Sound, within the channels south of the eastern end of Fishers Island (figs. 9, 11, 14), and at the entrances to the passage between Block Island and the mainland. Two of the depressions near The Race (Poppe and others, 2011a) and one south of the eastern end of Fishers Island are greater than 100 m deep. Smaller scale scour features also provide evidence of on-going erosion by the strong, oscillating tidal currents in Block Island Sound. For example, swirling currents develop around shipwrecks and boulders that protrude through surficial sediments. The resulting turbulent flow scours the sea floor downstream from obstructions and produces coarse-sediment-floored, sharp-pointed depressions called obstacle marks (Werner and Newton, 1975). Good examples of these bedforms are in the channels cutting across the sound (fig. 15) and at the western entrance to the passage between Block Island and the mainland. Asymmetry of the scour around these boulders is toward the direction of net sediment transport, as indicated by the greater scour (Reineck and Singh, 1980). The near absence of asymmetrical obstacle marks and deep scour depressions in the eastern half of the study area reflects the weaker tidal currents in Rhode Island Sound (Haight, 1942; Boehm and Quinn, 1978; White and White, 2011). Patchworks of relatively shallow scour depressions, however, have formed on seaward-facing slopes and on top of and adjacent to bathymetric highs in this sound, controlling much of the benthic diversity (figs. 11, 16, 17; Poppe and others, 2011b, 2012; McMullen and others, 2011, 2012). These depressions average 0.5–0.8 m deep, occur in water depths as great as 42 m, have relatively steep well-defined sides and coarse-grained floors, and occur in a variety of shapes, sizes, and configurations. Some are elongate and narrow; others are broad and rounded. In places, individual scour depressions have expanded to combine with adjacent depressions, forming larger eroded areas that commonly contain outliers of the original sandy sea-floor sediments (figs. 18, 19). In other places, cobbles and scattered boulders are present on the depression floors and indicate that the muddy Holocene sands have been completely removed, exposing winnowed relict Pleistocene deposits (figs. 16, 20). Because low tidal-current speeds and the lack of asymmetrical scour features suggest that bi-directional tidal currents alone are not capable of forming these features and because wave analysis has shown that waves can significantly affect the sea floor in Rhode Island Sound (Spaulding, 2007; Grilli and others, 2009; Ullman and Codiga, 2010), we contend that these depressions are formed and maintained under high-energy shelf conditions resulting from the repetitive hydraulic forces imposed by storm-driven waves that cause liquefaction and resuspension. We also contend that once resuspended the sediments are then exposed to erosion by wind-driven and tidal currents. Because sessile fauna dominate on the gravel floors of the depressions and infauna are prevalent in the finer grained Holocene deposits, we have concluded that the resultant close juxtaposition of silty sand- and gravel-dependent communities promotes regional faunal complexity (Poppe and others, 2011b, 2012; McMullen and others, 2011, 2012, 2013). This faunal complexity has helped to support a commercial fishery that is an important part of Rhode Island’s economy (Beutel and others, 2010; Hasbrouck and others, 2011). Although much less common than in Rhode Island Sound, storm-wave induced scour also occurs in Block Island Sound where scour depressions are present on the lower shoreface along Rhode Island’s southwestern coast and adjacent to Block Island. A few of these depressions, however, connect with single-channel and dendritic-channel systems that extend downslope (fig. 21). Individual channels average 1 to 1.5 m deep, continue upslope and over minor bathymetric highs along their courses, and exceed 5 km in length. The mechanisms governing formation and maintenance of these features are uncertain, but interpretations of seismic-reflection profiles show no correlation between these channel systems and the underlying channel systems cut during either glacial or post-glacial subaerial exposure (Needell and Lewis, 1984). Because of the lack of subsurface structural control and because scour depressions are commonly located at the upper ends of these channels, we would argue that the channels are related to modern processes, such as the return flow of bottom waters pushed up against the shoreline during storms. Sand Waves and MegaripplesFor the purposes of this report, bedforms are defined by morphology and amplitude—sand waves (that is, subaqueous dunes) are higher than 1 m and megaripples are 0.2 to 1 m high (Ashley, 1990). Sand waves and megaripples in the study area are best developed where constrictions in the tidal flow widen, energy levels drop, and processes that characterize the sedimentary environments change from those dominated by erosion and nondeposition to those associated with coarse-bedload transport. These areas include the western part of Block Island Sound near The Race (fig. 22), southeastern Block Island Sound near Block Channel (fig. 23), and the entrances to the passage between Block Island and the mainland (Poppe and others, 2012). Transverse bedforms dominate where the sand supply is abundant. Crest-to-trough amplitudes of the largest transverse sand waves exceed 7 m, but these bedforms exhibit a range of amplitudes and crestline lengths. Many transverse sand waves exceed 1 km in length, and several are longer than 2 km. Megaripples occur on the flanks of sand waves, and smaller sand waves occur on the flanks of larger sand waves. The presence of current ripples and megaripples on the sand waves and the steepness of the slip faces suggest that sediment transport is active, and that the sand waves are propagating under the present hydraulic regime (Dalrymple and others, 1978; Reineck and Singh, 1980; Allen, 1980). Smoothly sinuous crestline morphologies are most common, but transverse bedforms with smoothly curved, bifurcating, and relatively straight crestlines occur. Borders of sand-wave fields can be abrupt and are typically fringed with megaripples. Sand waves and megaripples with crescent-shaped barchanoid morphologies are present, but are much less common than transverse morphologies (fig. 22). They occur where sediment supply is limited, such as away from shoals and on the edges of transverse bedform fields. Transverse sand waves that are relatively straight crested, display no bifurcation, and are symmetrical in profile occur near the western end of the study area (fig. 22). Megaripples are typically absent from the stoss slopes of these waves, and their ends are marked by distinct scour zones or moats. These sand waves, which closely resemble bedforms in Great South Channel (Valentine and others, 2002) and eastern Long Island Sound (Poppe and others, 2011a), are probably immobile. The sand waves reflect the strength of the bottom currents, and their asymmetry can be used to indicate directions of net sediment transport (Allen, 1968; Ludwick, 1972; Allen, 1980). For example, most of the transverse sand waves in the western part of the study area display pronounced asymmetry with slip faces that are oriented toward the west and northwest and stoss slopes oriented to the east and southeast (figs. 22, 23). This asymmetry suggests a flow-transverse crest orientation and net sediment transport toward westernmost Block Island Sound and into Long Island Sound. Barchanoid morphologies can also be used to infer direction of net sediment transport because their horns migrate more rapidly than the wave's main body causing their concave faces to be oriented downstream in the transport regime (McKee, 1966). Lower Energy Sedimentary EnvironmentsHolocene marine deposits composed of fine-grained sand and silty sand are prevalent where the sea floor is relatively smooth and featureless in the 4-m grid DTM (fig. 24). These deposits occur in deeper, less constricted parts of the study area where tidal-current speeds are low (less than about 20 cm/s), such as in Rhode Island Sound (White and White, 2011; Poppe and others, 2011b; McMullen and others, 2011, 2012), and in areas protected from high-energy storm conditions, such as central Block Island Sound. Sedimentary environments in these areas are characterized by processes associated with sorting, reworking, and deposition (Poppe and others, 2012). Anthropogenic ArtifactsAnthropogenic features in the DTM include dredged channels and shipwrecks. Dredged channels are present near the entrances to the harbor at Point Judith and to the harbor on Block Island. Shipwrecks, which are of interest to historians and the diving community, are common. Examples of prominent shipwrecks include a previously uncharted, unidentified wreck that lies in approximately 47 m of water near the southern entrance to Block Island Sound (fig. 15), and that of the U–853, a World War II German submarine, that lies in western Rhode Island Sound (fig. 24; Poppe and others, 2012). Pronounced scour around the wreck near the southern entrance to Block Island Sound shows that the oscillating tidal currents are stronger there than in western Rhode Island Sound where scour is absent around the submarine. Acquisition and Processing ArtifactsSome of the features visible in the DTM are artifacts of environmental conditions, time limitations, equipment capabilities, and methodology during data acquisition and processing. Rougher seas during acquisition can result in minor noise and loss of resolution in the data that appear as narrow intermittent bands of noisy data (fig. 24). Artifacts due to time limitations and equipment capabilities, however, are more conspicuous. For example, gaps of no data (white polygons) owing to incomplete multibeam coverage during surveys H12023, H12296, and H12298 are present along the shorelines of southwestern of Rhode Island and Fishers Island, New York (fig. 9). In these shallow areas, where obstructions on the sea floor create hazards to navigation, these gaps have typically been filled by means of sidescan-sonar data (National Oceanic and Atmospheric Administration, 2009g, 2011b, 2011c). Processing artifacts are largely confined to the edges of survey areas that overlap other surveys (fig. 22) and to tie lines (figs. 16, 17). Inasmuch as no attempt was made to eliminate these artifacts, offsets in the datasets resulted where discrepancies were present. Although minor in the original bathymetric data (0.2 to 0.5 m), the artifacts are made more conspicuous by the 5-times vertical exaggeration applied during production of the GeoTIFFs provided in this report. |

![]() U.S. Department of the Interior |
U.S. Geological Survey
U.S. Department of the Interior |
U.S. Geological Survey
URL: http://pubsdata.usgs.gov/pubs/of/2014/1012/html/bathy.html
Page Contact Information: GS Pubs Web Contact
Page Last Modified: Wednesday, 07-Dec-2016 19:33:08 EST