
| List of Figures
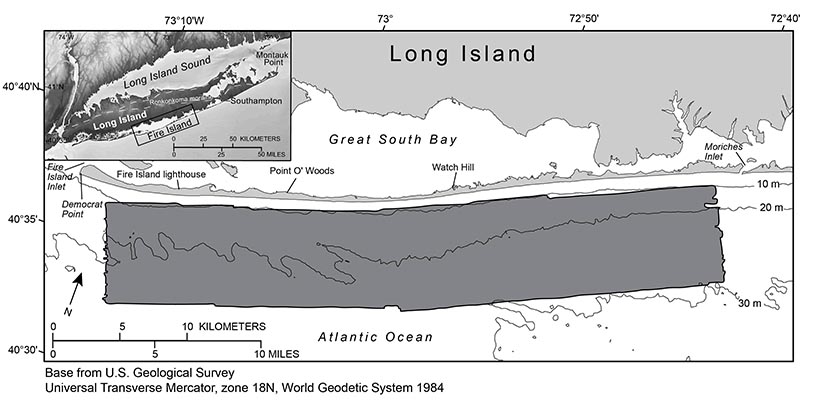 |
Figure 1. Map showing the survey area (shaded in dark gray) offshore of Fire Island, New York, 2011. Inset map shows location of study area (outlined in black). Bathymetric contours are in meters (m) below the North American Vertical Datum of 1988 (NAVD 88). Figure modified from Schwab and others (2013). |
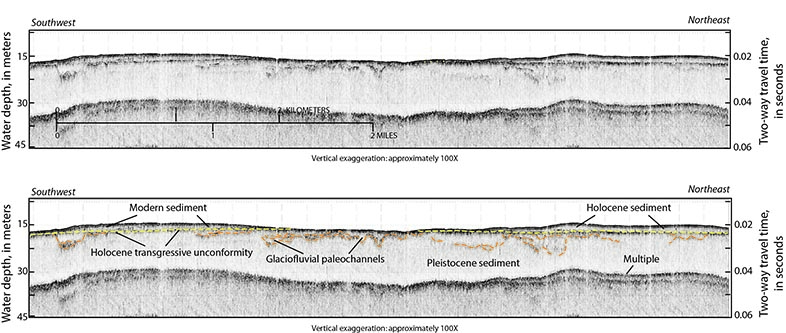 |
Figure 2. High-resolution chirp seismic-reflection profile and interpretation illustrating stratigraphic features and geometries discussed in the text. Location of the profile is shown in figure 3. Approximate water depth in meters is based on a two-way travel time of 1,500 meters per second. The Holocene transgressive unconformity is marked by a yellow dashed line. Glaciofluvial channels and older Pleistocene sediments are marked by orange dashed lines. Figure modified from Schwab and others (2013). |
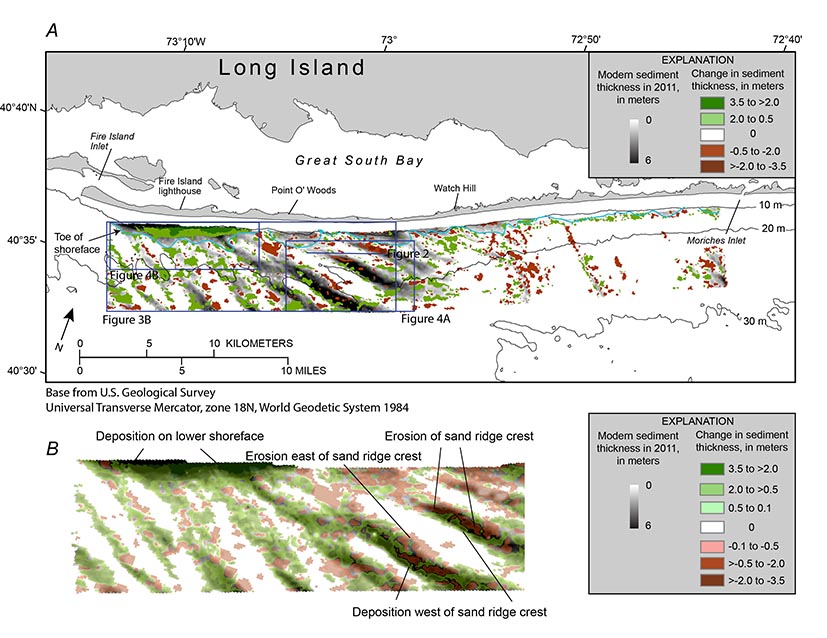 |
Figure 3. A, Map showing the change in modern sediment thickness greater than 0.5 meter (m) between isopachs interpreted from 1996–97 (Foster and others, 1999) and 2011 (Schwab, Denny, and Baldwin, 2014) seismic-reflection data, overlain on the 2011 modern sediment thickness isopach (Schwab, Denny, and Baldwin, 2014), offshore of Fire Island, New York. Blue line shows seaward extent (toe) of the shoreface (Schwab, Baldwin, Denny, and others, 2014). Regional bathymetric contours are in meters below the North American Vertical Datum of 1988 (NAVD 88). Figure modified from Schwab, Baldwin, Denny, and others (2014). B, Enlargement of area shown in A. Change in sediment thickness shown by using a less conservative vertical resolution limit of 10 centimeters to illustrate net westerly migration of the sand ridges, with erosion on the eastern flanks and crests of the ridges and deposition on the western flanks. |
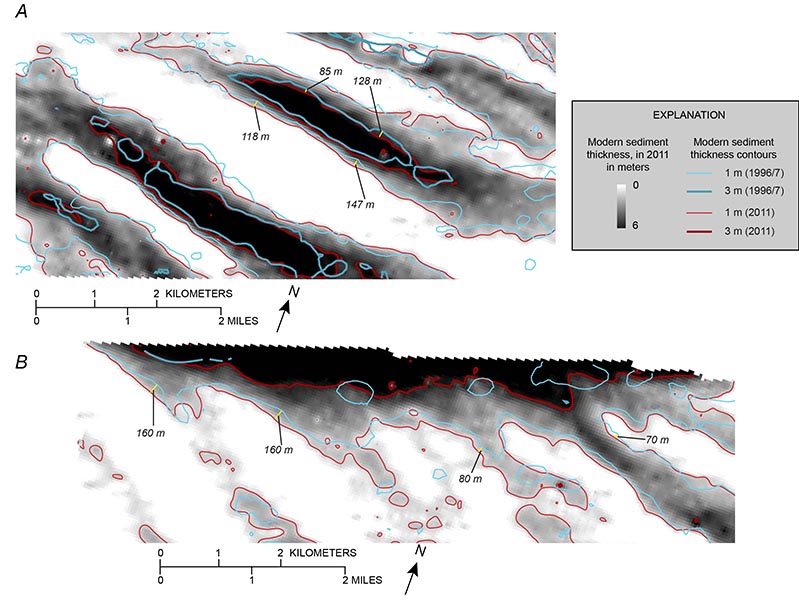 |
Figure 4. Maps showing the 1- and 3-meter (m) contours of sediment thickness from the 1996–97 and 2011 surveys offshore of Fire Island, New York, of the A, shoreface-attached sand ridges and B, area of accretion on the lower shoreface overlain on the 2011 modern sand thickness (Schwab, Denny, and Baldwin, 2014). Yellow lines illustrate the southwest migration of contours. See figure 3A for locations. |
|

