Open-File Report 2014–1238
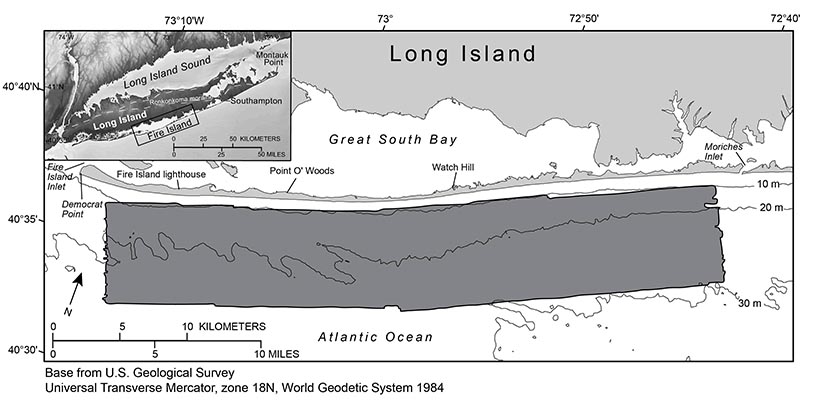
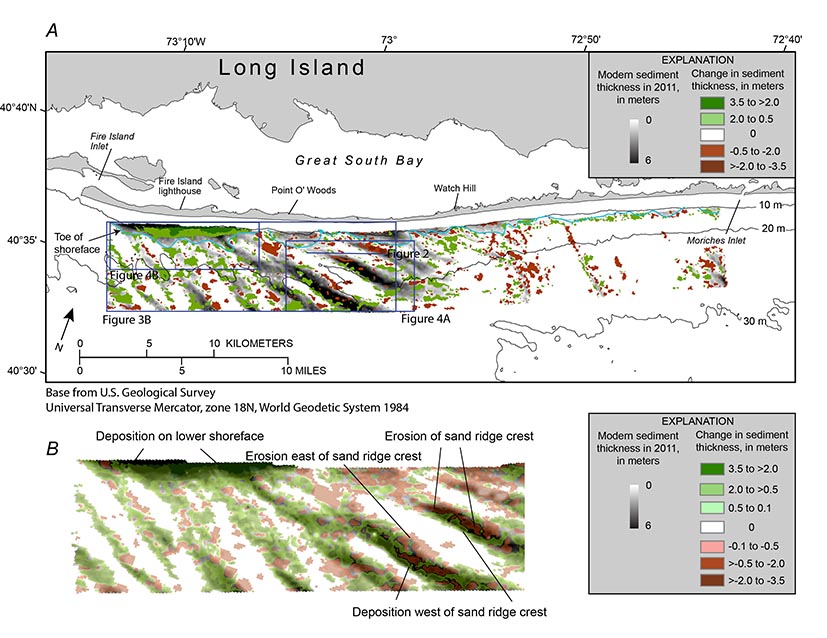
MethodsData Collection and ProcessingThe area offshore of Fire Island was surveyed by using high-resolution sidescan-sonar, seismic-reflection, bathymetric, and sediment-sampling techniques in May 1996 aboard the research vessel Seaward Explorer, and in May 1997 and September to October 1997 aboard the research vessel Diane G. Details of the sidescan-sonar and fathometer acquisition and processing are described by Schwab, Thieler, Denny, and others (2000), and details of the seismic-reflection data acquisition and processing are described by Foster and others (1999). The area offshore of Fire Island was resurveyed in May 2011 aboard the motor vessel Scarlett Isabella by using an interferometric sonar to acquire bathymetric and backscatter data and a chirp seismic-reflection profiler to define the subsurface stratigraphy and structure. The survey area extends about 50 km alongshore and about 8 km offshore in water depths ranging from approximately 8 to 32 meters (m) (fig. 1) and covers approximately 336 square kilometers (km2). Details of the acquisition and processing of these data are described in Schwab, Denny, and Baldwin (2014). Modern sediment thickness mapped in 2011 covered an area of about 274 km2 (Schwab, Denny, and Baldwin 2014) and was used for comparison to the modern sediment thickness mapped in 1996–97 (Foster and others, 1999). Ship position for both surveys was determined by using a Differential Global Positioning System (DGPS). The layback position of the seismic-reflection system towfish relative to the ship was accounted for in both surveys. We estimate that the positions of the seismic-reflection data are accurate to within 5 m. The sediment thickness mapped in 1996–97 by Foster and others (1999) was calculated from two-way travel time on seismic-reflection profiles by using an assumed internal velocity of 1,630 meters per second (m/s). However, the sediment thickness mapped in 2011 by Schwab, Denny, and Baldwin (2014) was calculated from two-way travel time by using an assumed internal velocity of 1,500 m/s. In order to compare the 1996–97 and 2011 datasets, the 1996–97 sediment thickness was converted to the common internal velocity of 1,500 m/s used by Schwab, Denny, and Baldwin (2014) by multiplying by a factor of 0.92. The two datasets were then compared, yielding a difference grid (fig. 3) with a resolution of 100-m grid cell size to match the coarser input of the 1996–97 data. A vertical resolution of 50 centimeters (cm) is assumed for sediment volume calculations because of a conservative estimate of the vertical resolution limits of the subbottom profiling systems used during the 1996–97 and 2011 surveys. |

![]() U.S. Department of the Interior |
U.S. Geological Survey
U.S. Department of the Interior |
U.S. Geological Survey
URL: http://pubsdata.usgs.gov/pubs/of/2014/1238/ofr2014-1238-methods.html
Page Contact Information: GS Pubs Web Contact
Page Last Modified: Wednesday, 07-Dec-2016 20:05:11 EST