Open-File Report 20151055
Effects of Proposed Sediment Borrow Pits on Nearshore Wave Climate and Longshore Sediment Transport Rate Along Breton Island, Louisiana
Citation | List of Figures | List of Tables | Conversion Factors | Abbreviations | Abstract | Introduction | Methods | Results | Conclusions | Acknowledgments | References Cited | Appendix 1. Scenarios | Appendix 2. Example Model Input Files | Appendix 3. File Naming Conventions | Digital Data Files
 |
||
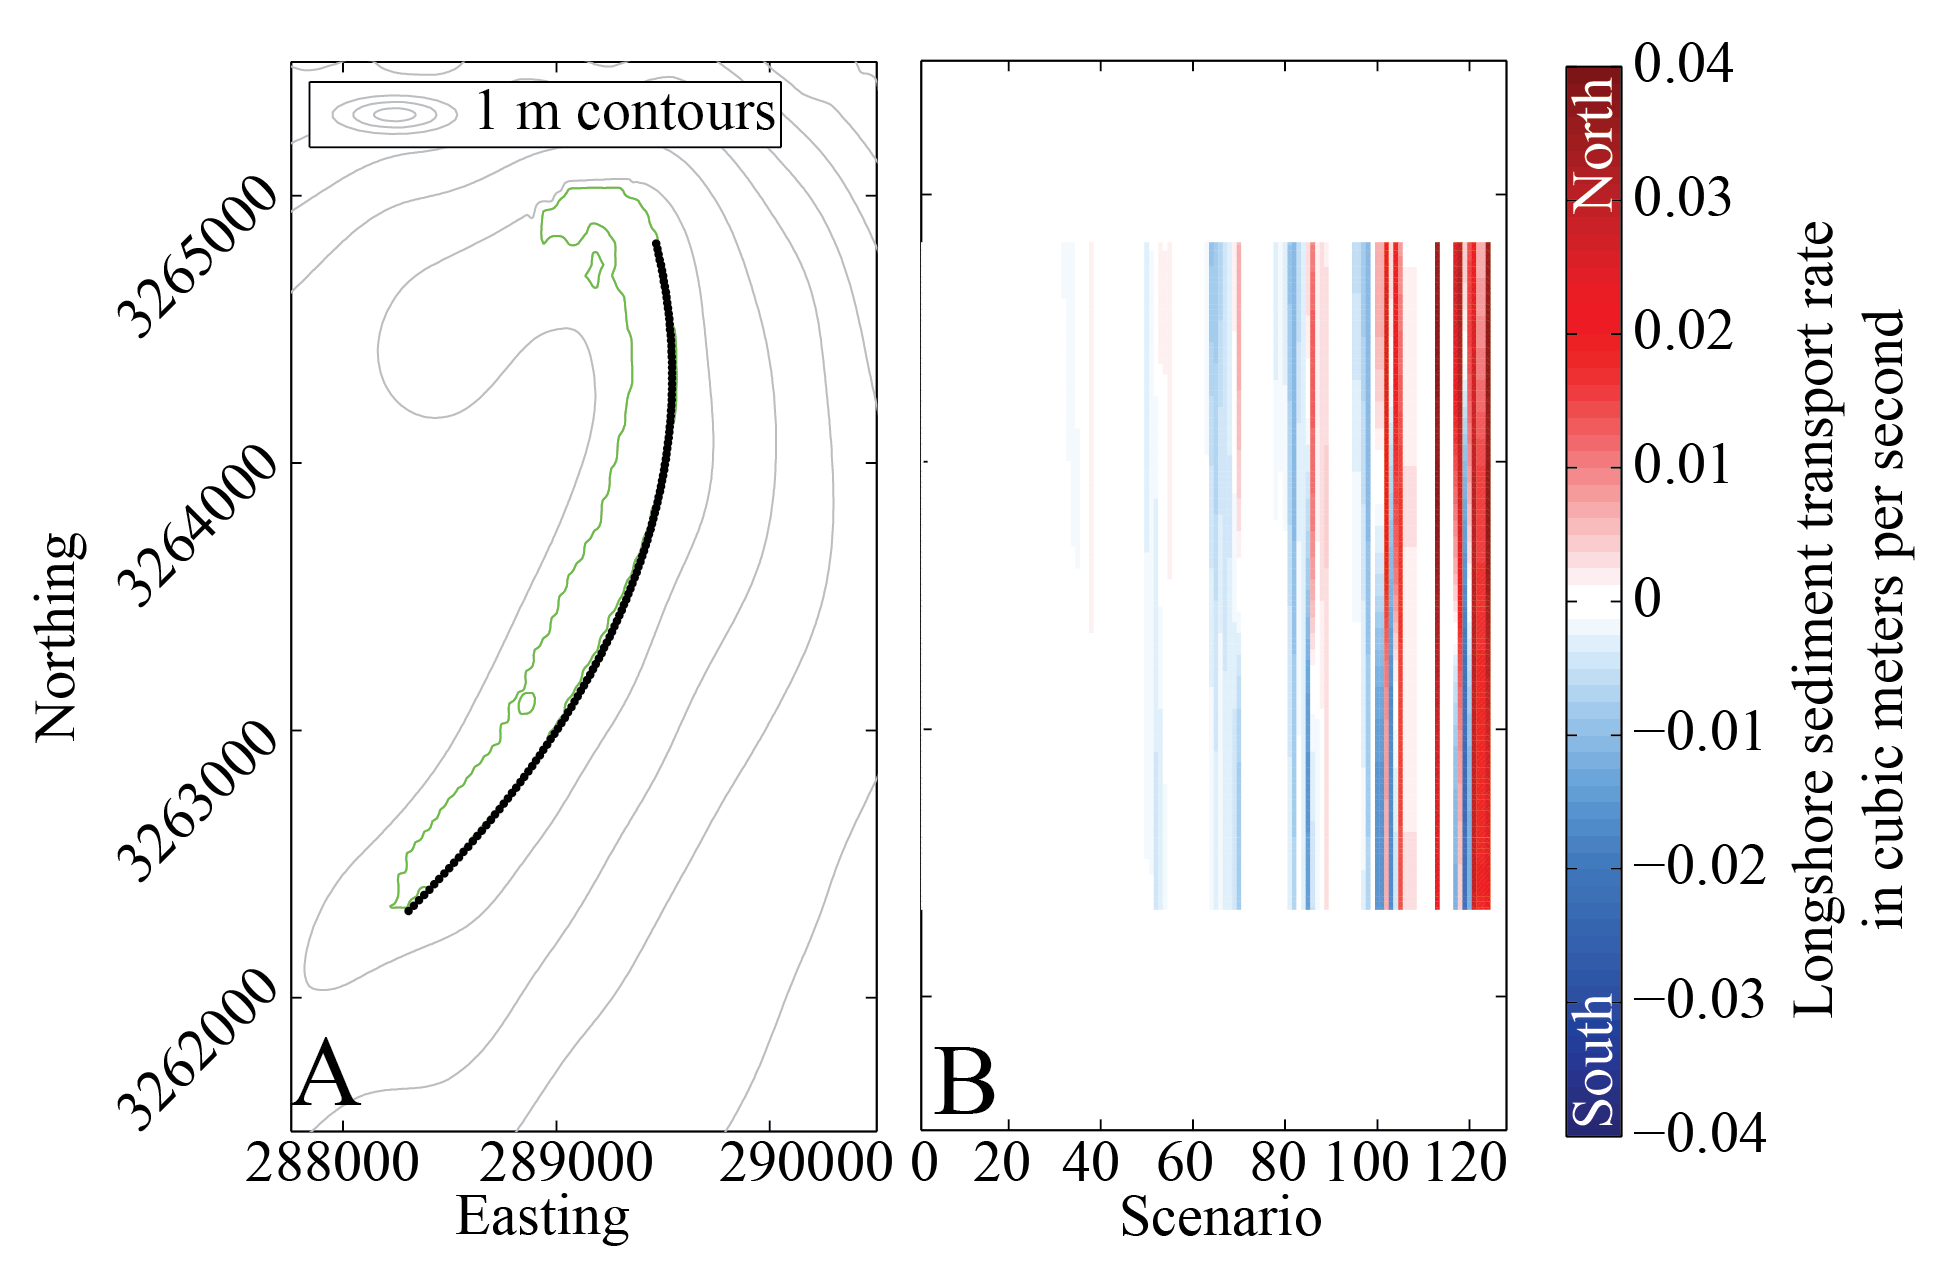
| Figure 15. For 135 locations (A, black line) along Breton Island (0 m contour shown in green), longshore transport rate (B; eq. 1) for each of the 116 wave scenarios (fig. 2) for the no pit case. Red colors indicate northerly transport and blue colors indicate southerly transport. Moving from left to right in (B), the magnitude of transport increases for larger wave scenarios. Because the dominant wave direction for storms is from the south and southeast (fig. 2), there are few large wave scenarios with predominantly southerly directed transport. [m, meters] | ||

![]() U.S. Department of the Interior |
U.S. Geological Survey
U.S. Department of the Interior |
U.S. Geological Survey
URL: http://pubsdata.usgs.gov/pubs/of/2015/1055/ofr2015-1055_figure15.html
Page Contact Information: GS Pubs Web Contact
Page Last Modified: Monday, 28-Aug-2017 17:38:37 EDT
