Open-File Report 2015-1238
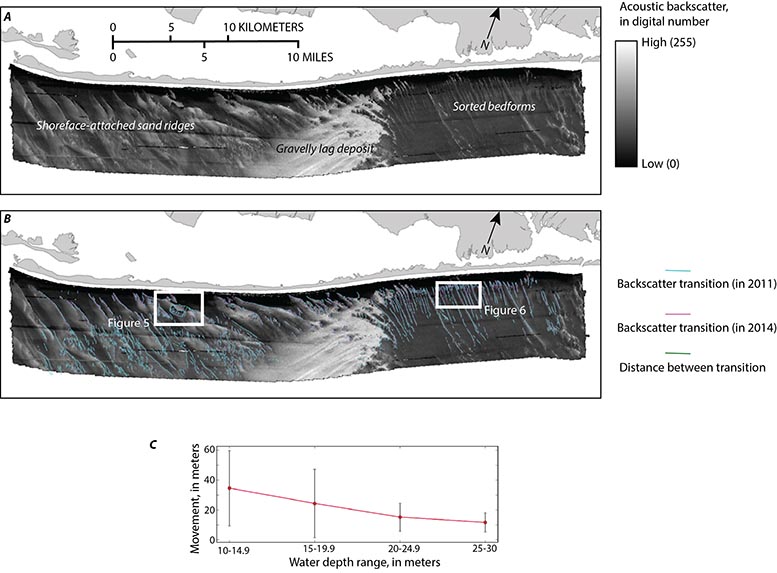
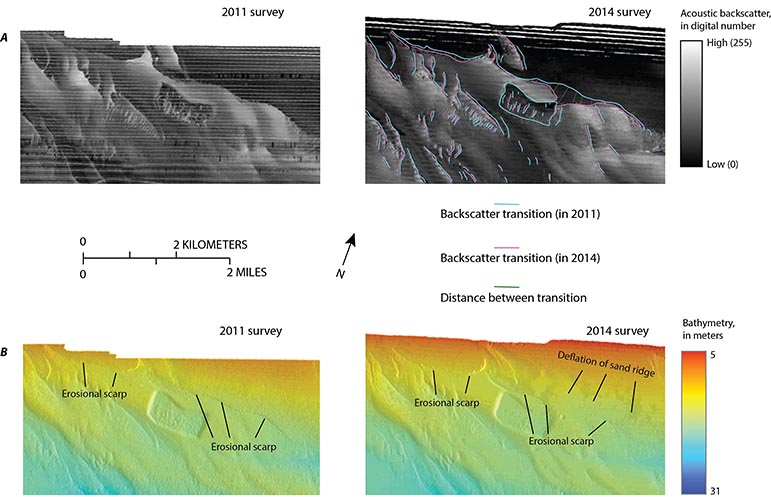
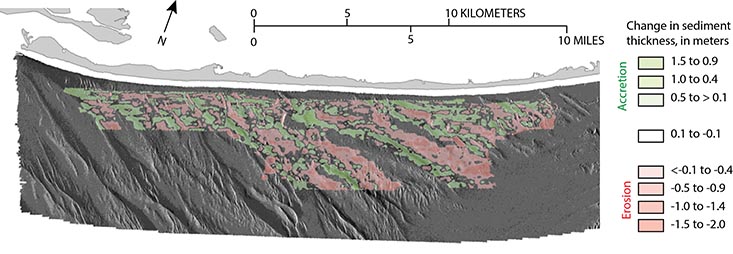
DiscussionThe results of comparative analyses of change from the data for the periods before and after Hurricanes Irene and Sandy (2011 and 2014 survey data) and by Schwab, Baldwin, and Denny (2014) and Schwab and others (2014) for the 15-year period before the 2011 survey generally agree in the sediment migration direction and the erosion and accretion patterns; a similar analysis was performed for the 15-year period before Hurricanes Irene and Sandy based on data from a survey in 1996-97 and the 2011 survey. Morphologic analyses on backscatter data for the 15-year period and the 3-year period before and after Hurricanes Irene and Sandy indicate predominantly southwestward movement of the sediment distribution patterns, bedforms, and sedimentary structures. The only significantly contrasting observations made from the two analysis periods occurred along the southwestern margins of shoreface-attached sand ridges in water depths less than about 15 m. During the earlier analysis period, Schwab and others (2013, fig. 8) noted that erosional scarps defining the seaward margins of the ridges had predominantly migrated landward during the 15-year period; in places these scarps define the seaward extent of the toe of the shoreface. From 2011 to 2014, the margins were mostly observed to have moved seaward (fig. 5), but landward motion was also detected at discrete locations along the lengths of the margins. No comparison could be drawn between average bedform movement statistics for the two analysis periods because resolution differences between the backscatter acquired with the towed sidescan in 1996-97 and interferometric sonars in 2011 and 2014 precluded those analyses from being conducted for the 1996-97 to 2011 analysis period (Schwab and others, 2013). However, Goff and others (2015) also presented results comparing the 2011 data (Schwab, Baldwin, and Denny, 2014) with data from two smaller areas surveyed offshore of eastern and western Fire Island after Hurricane Sandy in January 2013. The backscatter analysis results presented in Goff and others (2015) agree well with the comparison of data from the 2011 and 2014 surveys in this report, indicating predominantly western or southwestern bedform migration and a general decrease in the magnitude of change relative to water depth. The measured lateral offset distances of 40 to 75 m in 15-m depths and 0 to 20 m in 20-m water depths in Goff and others (2015) are comparable to the values from the comparison of the data from the 2011 and 2014 surveys over the larger survey area (fig. 4C). The comparison of modern sediment thickness isopachs interpreted from the 1996-97 and 2011 seismic-reflection data (Schwab, Baldwin, and Denny, 2014) was conducted identically to the one presented in this report for the data from the 2011 and 2014 surveys. Calculations of the differences for both analysis periods indicate net southwesterly migration of the shoreface-attached sand ridges, generally showing erosion on the eastern flanks and crests of the ridges and deposition on the western flanks and in the troughs (fig. 7). Results from the 1996-97 and 2011 analysis period indicated substantial accretion along the lower shoreface of western Fire Island, and statistics computed on the difference grid suggested that the modern sediment volume across the about 274 km2 of commonsea floor mapped in both surveys increased by 20.2 million cubic meters during the 15-year period, a mean thickness change of +0.07 m (Schwab, Baldwin, and Denny, 2014). These results suggest that some portion of the predominantly southwestward alongshore net sediment flux is directed shoreward and that erosion of the Pleistocene outwash and lower Holocene channel-fill deposits exposed at thesea floor continues to yield the modern sediment required to balance the coastal sediment budget (Schwab and others, 2013) and maintain the shoreface-attached sand ridges (Schwab, Baldwin, and Denny, 2014). The observation of net accretion of the modern sediment in the 15-year period between 1996-97 and 2011 (Schwab, Baldwin, and Denny, 2014) and net erosion in the 3-year period between 2011 and 2014 allows speculation as to the dynamics of this shoreface-attached ridge system. During the 15-year period, the sand ridges are maintained by erosion of the Pleistocene glaciofluvial and lower Holocene channel-fill deposits exposed at thesea floor while migrating toward the southwest (Schwab, Baldwin, and Denny, 2014; Schwab, Baldwin, Denny, and others, 2014). The combined impacts of Hurricanes Irene and Sandy caused erosion of the sand ridges, with sediment transported in a general southwesterly direction. Surveys of the shoreface and subaerial components of Fire Island indicate that the eroded sediment was not transferred to the shoreface or adjacent barrier island (Hapke and others, 2013) and thus was transported southwest out of the study area and (or) distributed in a veneer over the glaciofluvial and lower Holocene channel-fill deposits beyond the resolution detected by the seismic-reflection techniques, which is about 20 cm. |

![]() U.S. Department of the Interior |
U.S. Geological Survey
U.S. Department of the Interior |
U.S. Geological Survey
URL: http://pubsdata.usgs.gov/pubs/of/2015/1238/ofr2015-1238-discussion.html
Page Contact Information: GS Pubs Web Contact
Page Last Modified: Wednesday, 07-Dec-2016 21:49:29 EST