
| List of Figures
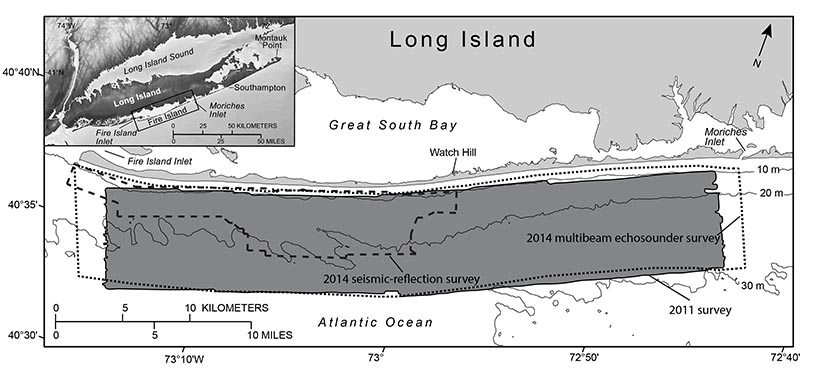 |
Figure 1. Map showing the 2011 (shaded in dark gray) and 2014 (multibeam echosounder survey outlined by dotted line and seismic-reflection survey outlined by dashed line) surveys offshore of Fire Island, New York. Inset map shows location of study area (outlined in black). Bathymetric contours are in meters (m) below the North American Vertical Datum of 1988 (NAVD 88). Figure modified from Schwab, Baldwin, and Denny (2014). |
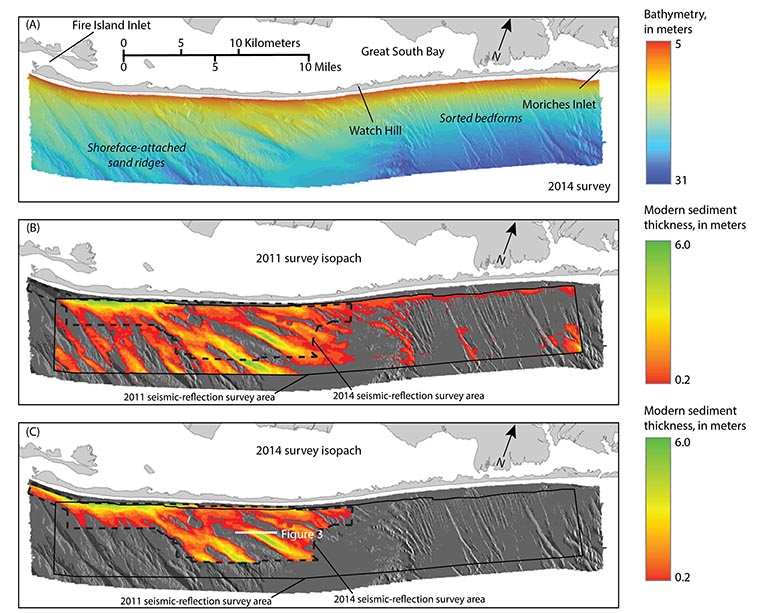 |
Figure 2. A, Map showing the interpolated bathymetric surface generated from multibeam echosounder data collected offshore of Fire Island, New York, in January 2014 (Denny and others, 2015). Bathymetry is in meters (m) below the North American Vertical Datum of 1988 (NAVD 88). B and C, Maps illustrating isopachs of thickness of modern sediments derived from seismic-reflection data collected in 2011 (Schwab, Baldwin, and Denny, 2014) and 2014, respectively. These isopachs are overlain on the sun-illuminated bathymetric surface derived from the bathymetric surface shown in A. West of Watch Hill, the modern sand deposit is organized into a series of shoreface-attached sand ridges oriented obliquely to the shoreline. The Pleistocene glacial outwash units from which the modern sands were reworked are exposed in the troughs between the ridges and across other portions of the Inner Continental Shelf where the modern deposit is absent. The presence of sorted bedforms on the Inner Continental Shelf east of Watch Hill is indicative of this active erosion of the glacial outwash units (Schwab and others, 2014). |
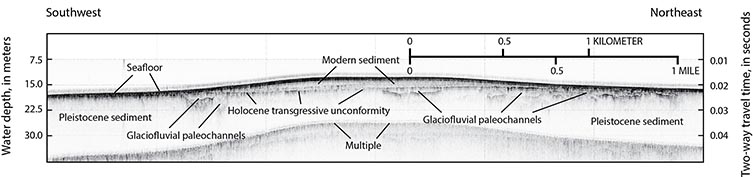 |
Figure 3. High-resolution chirp seismic-reflection profile illustrating the stratigraphic features and geometries discussed in this report. Location of the profile is shown in figure 2C. Approximate water depth in meters was converted from two-way travel time assuming a seismic velocity of 1,500 meters per second. |
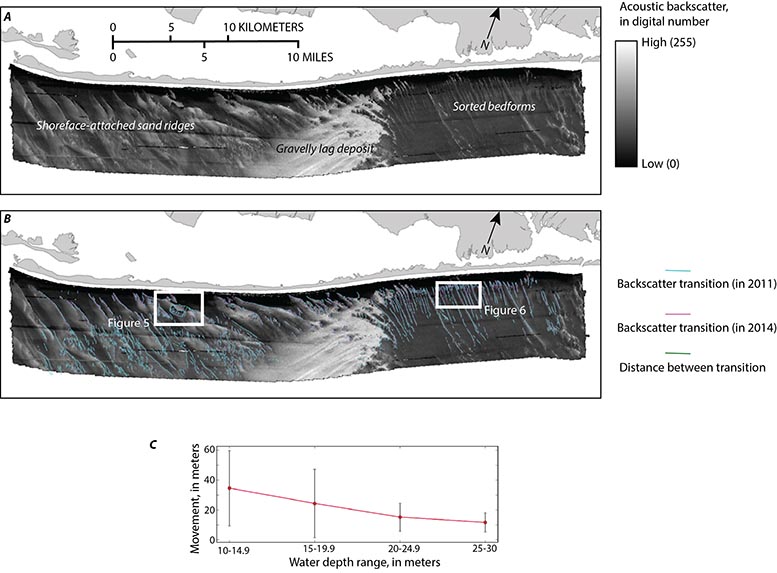 |
Figure 4. Maps showing A, acoustic backscatter data collected using the multibeam echosounder in 2014 (Denny and others, 2015) and B, transitions and distances between areas of high- and low-backscatter margins of common sea-floor features digitized from 2011 (Schwab, Denny, and Baldwin, 2014) and 2014 backscatter data. C, Graph illustrating the mean movement (in meters) of backscatter transitions within four depth intervals between 2011 and 2014. Vertical bars indicate one standard deviation of mean value. |
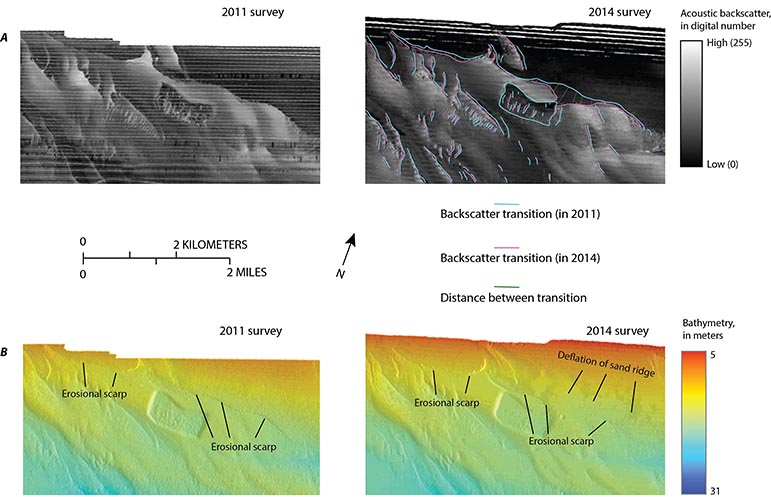 |
Figure 5. Maps showing A, backscatter and B, bathymetry collected in 2011 (Schwab, Denny, and Baldwin, 2014) and 2014 (Denny and others, 2015) in the vicinity of a borrow pit offshore of western Fire Island, New York. Location of maps shown on figure 4B. A, Sharp transitions between areas of high and low backscatter identified along the margins of discrete sediment distribution patterns, bedforms, and sedimentary structures from the 2011 and 2014 surveys are overlain on the backscatter data from the 2014 survey. B, Bathymetric data from each survey also illustrates significant change around the borrow pit area. |
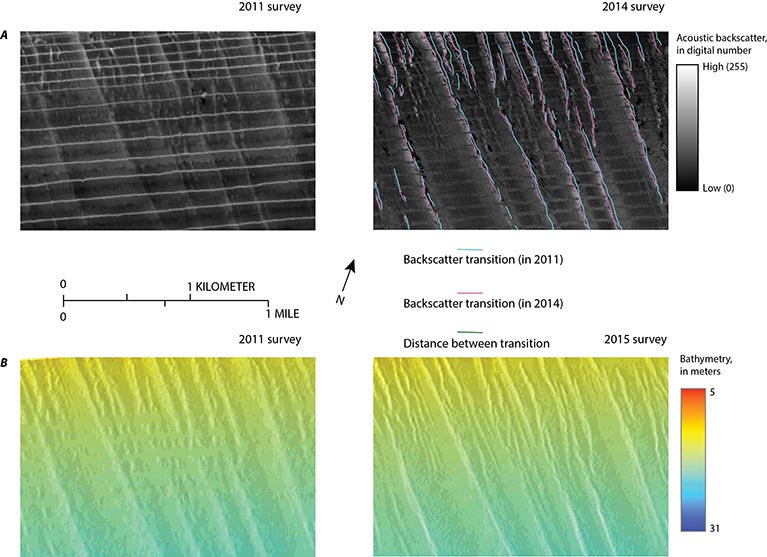 |
Figure 6. Maps showing A, backscatter and B, bathymetry collected in 2011 Schwab, Denny, and Baldwin, 2014) and 2014 (Denny and others, 2015) in an area of sorted bedforms offshore of eastern Fire Island, New York. Location of maps shown on figure 4B. A, Sharp transitions between high and low backscatter identified along the margins of discrete sediment distribution patterns and sedimentary structures from the 2011 and 2014 surveys are overlain on the backscatter data from the 2014 survey and aid in detecting change. B, Coincident bathymetry illustrates that change detection is prohibitive largely because of the subtlety of changes in this area. Change detection is further complicated because of artifacts in the data from the 2011 survey as described in the “Methods” section of this report. |
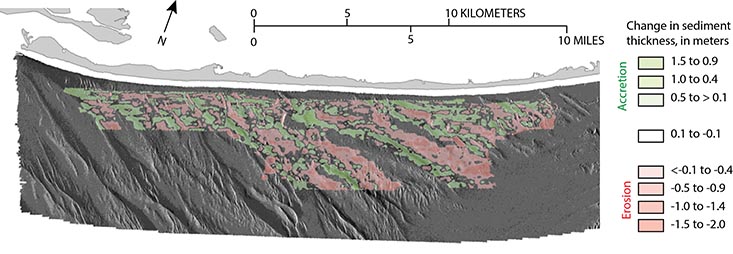 |
Figure 7. Map showing change in modern sediment thickness in meters between the 2011 (Schwab, Baldwin, and Denny, 2014) and 2014 surveys. A vertical resolution of 20 centimeters is assumed for the sediment volume calculation because of the resolution limits of the seismic system used. However, the change in sediment thickness is displayed with a less conservative estimate of 10 cm to better illustrate the sediment flux patterns. It is assumed that the majority of this change was a result of Hurricane Sandy. |
|

