Open-File Report 2015-1238
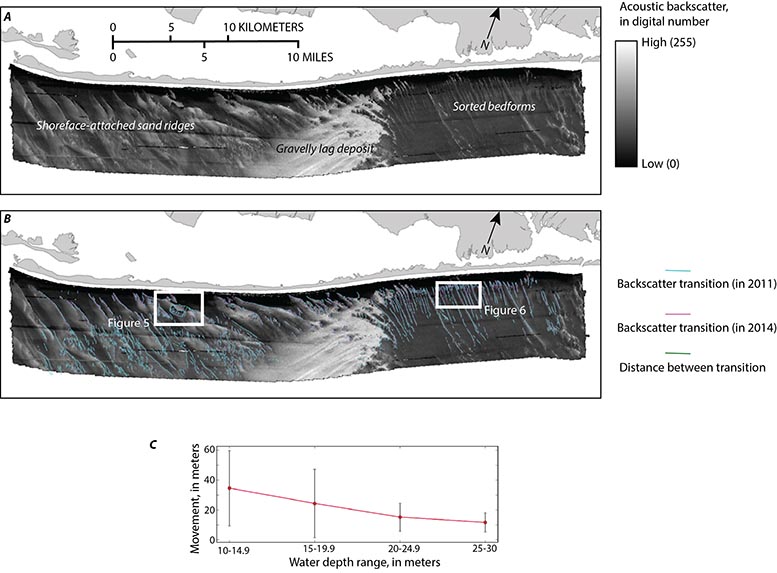
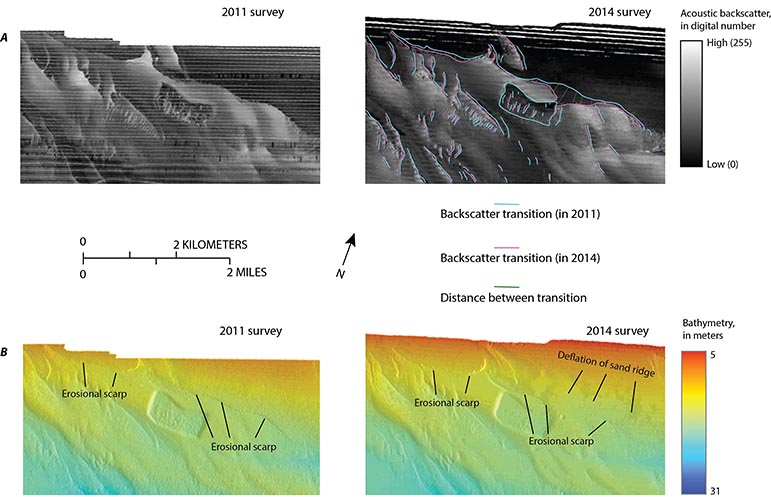
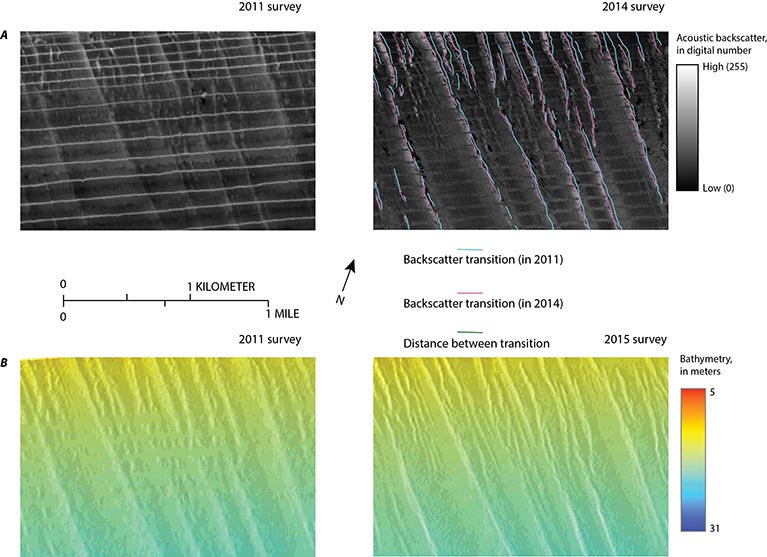
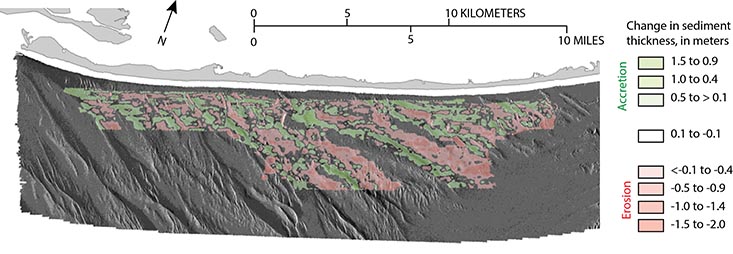
Mapping ResultsThe patterns apparent in the backscatter data from the 2011 (Schwab, Denny, and Baldwin, 2014) and 2014 (Denny and others, 2015) surveys illustrate the primary sea-floor morphologies on the inner continental shelf, including sorted bedforms offshore of eastern Fire Island, a gravelly lag deposit offshore of central Fire Island, and a field of shoreface-attached sand ridges offshore of western Fire Island (fig. 4). Schwab and others (2013, 2014) provided detailed interpretations of these backscatter patterns, including how some are indicative of net southwestward sediment flux. The analysis of the sharp backscatter transitions in this report, which indicate minor variation in sediment texture and (or) structure, identified in the 2011 (Schwab, Denny, and Baldwin, 2014) and 2014 (Denny and others, 2015) surveys measures lateral offset distances ranging between about 1 and 450 m (with a mean of 20 m) during the 3-year period (fig. 4C) and depicts a dominantly southwestward movement of the transitions (figs. 5 and 6). Mean distances computed for changes within the aerial extents of four 5-m-depth intervals indicate that change occurred in water depths up to about 30 meters and tended to decrease with increasing water depth fig. 4C). The greatest change was detected in the area of a borrow pit (last excavated in 2009 for a beach nourishment project) in water depths of about 15 m where comparison of backscatter imagery shows that the southwest-facing flank of a shoreface-attached sand ridge migrated about 450 m southwest toward the borrow pit (fig. 5A). A comparison of the bathymetric data from the 2011 (Schwab, Denny, and Baldwin, 2014) and 2014 (Denny and others, 2015) surveys also shows deflation of this ridge flank (fig. 5B). The comparison of modern sediment thickness mapped from the seismic-reflection data from the 2011 (Schwab, Baldwin, and Denny, 2014) and 2014 surveys closely agrees with results from the backscatter analysis, also illustrating what we interpret to be a net southwesterly migration of the shoreface-attached sand ridges. The isopach difference grid indicates a general pattern consisting of erosion on the northeast-facing ridge flanks and crests of the sand ridges and deposition on the southwest-facing ridge flanks and in the troughs adjacent to the southwest-facing ridge flanks (fig. 7). Statistics computed for the difference grid suggest that the modern sediment volume across the 81 km2 of common sea floor mapped in both surveys decreased by 2.8 million cubic meters, which is a mean thickness change of –0.03 m (below the resolution limit of the seismic-reflection systems used for mapping in this report). The largest magnitude change in sediment thickness (accretion of about 1.3 m) was observed in the same area where the largest magnitude morphologic change was observed in the backscatter analysis, which is along the eastern margin of the borrow pit area (fig. 5). |

![]() U.S. Department of the Interior |
U.S. Geological Survey
U.S. Department of the Interior |
U.S. Geological Survey
URL: http://pubsdata.usgs.gov/pubs/of/2015/1238/ofr2015-1238-mappingresults.html
Page Contact Information: GS Pubs Web Contact
Page Last Modified: Wednesday, 07-Dec-2016 21:49:36 EST