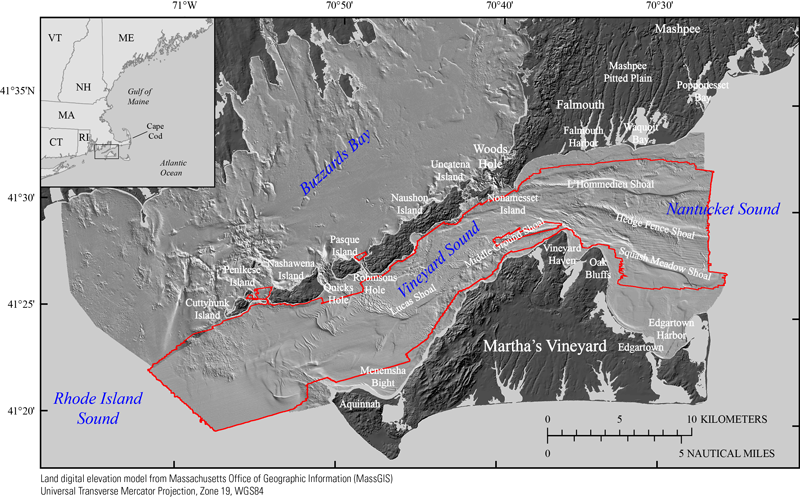
Figure 1. Location map of the Vineyard and western Nantucket Sounds study area, and inset map illustrating the study area location within southern New England. Swath bathymetry, acoustic backscatter, and chirp seismic-reflection data were collected in the area inside the red polygon. Dark gray is from a Massachusetts Office of Geographic Information (MassGIS) hillshade relief image of Massachusetts. Medium gray is from the hillshade relief maps derived from the composite bathymetry of Buzzards Bay (Foster and others, 2015) and Vineyard and western Nantucket Sounds (fig. 3).
|
