Open-File Report 2016-1119
Shallow Geology, Sea-Floor Texture, and Physiographic Zones of Vineyard and Western Nantucket Sounds, Massachusetts
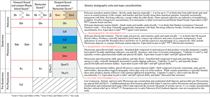
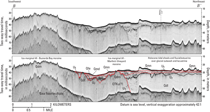
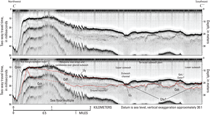
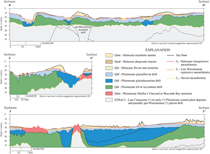
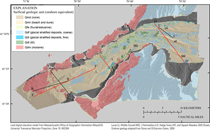
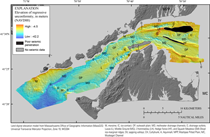
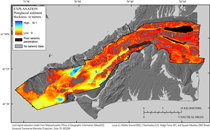
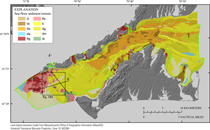
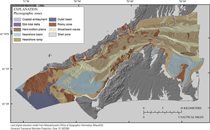
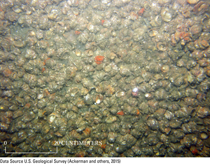
ResultsSeismic Stratigraphy and Geologic InterpretationFour primary seismic stratigraphic units and three major unconformities were interpreted and mapped within the seismic survey area (fig. 9). Interpreted seismic profiles (figs. 10, 11, and 12) illustrate the typical geometry of the seismic units and unconformities throughout Vineyard and western Nantucket Sounds. Figure 13 contains interpreted geologic cross sections across western Nantucket Sound, central Vineyard Sound, and down the axis of western Vineyard Sound, and figure 14 contains the surficial geologic map derived from mapping the areal extent of geologic unit outcrop on the sea floor. Correlations between our geologic interpretations and those of O’Hara and Oldale (1980, 1987) for Vineyard and western Nantucket Sounds are summarized in figure 9. Our interpretations of the seismic stratigraphy generally agree with the previous studies. The higher density and spatial resolution of the new data have allowed us to build on the previous interpretations and provide more detailed surficial and shallow subsurface geologic maps than those previously available. However, the new data did not consistently provide adequate penetration for reliable mapping of the deep Pleistocene and pre-Quaternary units, therefore discussion of the deeper stratigraphy mostly relies on previous interpretations that were based on more widely spaced, but deeper-penetrating boomer seismic data and vibracores. In ascending order, the four primary seismic stratigraphic units are: undifferentiated Late Cretaceous(?), Tertiary(?), and (or) early Pleistocene(?) age coastal plain and continental shelf deposits and possibly late Pleistocene (pre-Wisconsinan?) age glacial drift (QTKu?); late Pleistocene (Wisconsinan) age glacial drift (Qd); Holocene age postglacial fluvial and estuarine deposits (Qfe); and Holocene age postglacial marine deposits (Qm). These are separated by three regional unconformities U1, Ur, and Ut (fluvial, regressive, and transgressive, respectively, fig. 9). In addition, glacial drift (Qd) and postglacial marine (Qm) are each divided into subunits on the basis of seismic facies, stratigraphic position, and spatial distribution. The lowermost primary seismic stratigraphic unit is inferred to consist of Late Cretaceous, Tertiary, and (or) early Pleistocene age coastal plain and continental shelf deposits and possibly pre-Wisconsinan age glacial drift (QTKu?) on the basis of previous outcrop and subsurface mapping on Cape Cod, Martha’s Vineyard, and Nantucket (Woodsworth and Wigglesworth, 1934; Kaye, 1964a, b, 1980; Folger and others, 1978; Hall and others, 1980; Oldale and O’Hara, 1984; Uchupi and Mulligan, 2006) and beneath Vineyard and Nantucket Sounds (O’Hara and Oldale, 1980, 1987; Uchupi and Mulligan, 2006). The upper surface of QTKu(?) is identified by the seismic reflection U1 (figs. 10 and 11), which is high-amplitude, irregular and mostly undetectable in chirp profiles because of either its depth or limited penetration through overlying units. Consequently, most information regarding the elevation of U1 and the seismic character of QTKu(?) was observed from boomer profiles. Seismic reflections within QTKu(?) are typically flat-lying to gently southerly dipping, but in places they are undulatory, steeply dipping, irregular, or discontinuous and indicative of deformation. U1 generally deepens to the south and exhibits substantial topographic variability, including a network of deep, linear, concave-up valleys that sharply truncate QTKu(?) reflections along their margins. O’Hara and Oldale (1980, 1987) suggested that the U1 unconformity (their fu2), which generally indicates the upper boundary of these units, was a product of extended fluvial incision during late Tertiary and early Pleistocene time. Oldale and O'Hara (1984) demonstrated that the coastal plain and continental shelf units were deeply eroded and locally deformed over the course of multiple Pleistocene age glacial episodes. The primary seismic stratigraphic unit inferred to represent late Pleistocene (Wisconsinan) age glacial deposits (Qd) overlies the fluvial unconformity U1 throughout the study area. Qd is divided into four subunits—end moraine (Qdm), glacial till and ice contact (Qdt), glaciolacustrine (Qdl), and glaciofluvial (Qdf) deposits—on the basis of their seismic facies, defined by internal reflections as well as their relative stratigraphic positions and spatial distributions. Qd subunits were generally only recognized in chirp profiles where they were present in the relatively shallow subsurface (< about 80 milliseconds two-way traveltime [ms]) and unobscured by the primary sea-floor multiple, but boomer profiles typically provided adequate penetration to image and characterize more deeply buried portions of Qd (up to about 250 ms). The end moraine (Qdm) and glacial till and ice contact (Qdt) subunits produce similar seismic facies, consisting of irregular, high-amplitude surface reflections and chaotic and discontinuous internal reflections with common diffraction hyperbolae (figs. 9, 10, and 11). Chaotic reflections within Qdm and Qdt and hyperbolic diffractions where these units intersect the sea floor are interpreted as acoustic signatures of poorly sorted, relatively coarse drift and boulders. Stratigraphically, Qdm and Qdt are observed to directly overlie U1 along the margins of Martha’s Vineyard and in discrete locations in the central portions of the sounds, but they also overlie Qdl along the margins of the Elizabeth Islands. Qdm is specifically inferred to represent till associated with the Martha’s Vineyard and Buzzards Bay end moraines (figs. 10, 11, and 14). Qdt units are present at the sea floor in discrete locations across the study area (fig. 14), and are interpreted to possibly represent outcrops of basal till, ground moraine, kame, or esker deposits. The glaciolacustrine (Qdl) and glaciofluvial (Qdf) subunits represent late Pleistocene age stratified drift that was deposited by glacial meltwater. The glaciolacustrine seismic facies is characterized by vertically laminated, horizontal to gently dipping reflections of variable amplitude (figs. 10 and 11). Qdl reflections are undulatory where they conformably drape the irregular surfaces of Qdm, Qdt, or U1 and where they have been deformed. The seismic signature of Qdl is interpreted to represent varved, relatively fine grained, glaciodeltaic or lakefloor deposits. The oldest and thickest Qdl units fill the deep valley-shaped depressions in the U1 unconformity, including the relatively narrow, sublinear valleys beneath western Nantucket Sound (fig. 13; O’Hara and Oldale, 1980; 1987, Uchupi and Mulligan, 2006), and the broader subsurface basin of western Vineyard Sound (fig. 13). Stratigraphically younger Qdl deposits observed in northwestern Nantucket Sound possibly represent fine-grained deposition within small, isolated proglacial lakes or ponds. The glaciofluvial (Qdf) seismic facies is characterized by flat-lying, undulatory, or gently to steeply dipping laminated reflections, chaotic and discontinuous reflections, cut-and-fill structures, and zones of acoustic transparency (figs. 10, 11, and 12). Locally the base of Qdf consists of a medium- to high-amplitude, undulatory reflection that truncates underlying Qdt and Qdl units, however seismic-reflection data penetration was not adequate for mapping the composite unconformity throughout the region. Qdf is observed to overlie each of the other Qd subunits in places, and its variable seismic character is indicative of a variety of fluvial outwash morphologies. Relatively thick deposits that roughly coincide spatially with Lucas, Middle Ground, L’Hommedieu, Hedge Fence, and Squash Meadow Shoals (fig. 1) are interpreted to represent a series of ice-proximal outwash deposits that form subsurface cores of the shoals (figs. 12 and 13). Less vertically extensive but areally broader units represent relatively ice-distal deposition that occurred within terraced outwash plains (figs. 12 and 13). Locally, thicker Qdf deposits fill a network of relatively narrow but deep channels that were incised into underlying units throughout deglaciation as meltwater drained across the expanding postglacial landscape toward a substantially lowered sea level (figs. 10 and 11). The medium- to high-amplitude, irregular to undulating seismic reflection Ur delineates the eroded upper surface of Qd and older adjacent units (figs. 10, 11, and 12) and represents the late Wisconsinan to early Holocene age regressive unconformity (fig. 15). The Ur surface contains a pair of subsurface valleys that deepen progressively from west-central Nantucket Sound, along the eastern and western margins of Vineyard Sound, and southward beneath the mouth of western Vineyard Sound where they coalesce and broaden into a wide basin. These morphologies resulted through a combination of glacial lake drainage, meltwater fluvial erosion, and later fluvial erosion during the early Holocene. The network of deep channels visible on the unconformity illustrates the evolution of a meltwater drainage system adjusting to stepwise retreat of glacial ice lobes across the sound. Ur is a composite unconformity that merges with the U1 (fluvial) and Ut (transgressive) unconformities outside of glaciofluvially eroded areas. The remaining two primary stratigraphic units that overlie Qd and QTKu(?) units represent primarily Holocene age fluvial and estuarine (Qfe) and marine (Qm) deposits (figs. 9 and 16). Qfe is the lowermost of these deposits, and where present, it fills the deepest portions of the valleys and outer basin formed by Ur. Qfe produces seismic signatures that include laminated, horizontal to concave-up reflections, cut-and-fill structures, and zones of near acoustic transparency (figs. 10 and 11). Qfe units are interpreted to consist of late Pleistocene and Holocene fluvial deposits, as well as younger Holocene estuarine fill related to marine transgression. Qfe deposits are thickest where they form the youngest fills within the major channel trunks in the Pleistocene drainage network (figs. 10 and 11). In some locations, biogenic gas, presumably produced in the estuarine sections of Qfe, attenuated the seismic signal and prevented interpretation of underlying units. Seismic reflector Ut, a medium-amplitude, mostly flat-lying, and continuous reflector, is interpreted to represent the Holocene marine transgressive unconformity and generally defines the boundary between Holocene marine (Qm) deposits and older underlying units. Ut is a composite unconformity that merges with Ur outside of the valleys and outer basin (figs. 10, 11, and 12). The Holocene marine (Qm) seismic facies is characterized by medium- to low-amplitude, flat-lying to steeply dipping, laminated reflections and zones of acoustic transparency (figs. 10, 11, and 12). Qm (this study) is divided into nearshore marine (Qmn) and deepwater marine (Qmd) subunits on the basis of sediment texture and spatial distribution (figs. 9, 14, and 17). Qmn deposits are composed primarily of sand and some gravel and form the beaches and bars along the shorelines, as well as shoals, sand ridges, and smaller bedforms on the sea floor of the sounds (figs. 3, 13, 15, and 16). Qmd sediments occupy a stratigraphic position adjacent to Qmn but are relatively fine-grained, containing a more muddy fraction, and are primarily restricted to water depths greater than 30 m at the seaward extent of Vineyard Sound (figs. 13, 15, and 16). Sediment Texture and DistributionUsing the Barnhardt and others (1998) classification scheme (fig. 7), sediment type was mapped over 494 km2 of Vineyard and western Nantucket sounds (fig. 17). Nearly all textures were recognized in the study area; textures ranged from muddy sands across the relatively deep basin seaward of Vineyard Sound to boulders and gravelly sediment associated with outcrops of glacial till and terminal moraine units (fig. 17). Polygon areas were classified by using most of the composite units in the Barnhardt and others (1998) classification scheme; Mr, M, R, and Rm were not used. Interpretations were made with high confidence over approximately 84 percent of the study area, from which high-density geophysical data and high-quality sediment samples were collected (fig. 8; table 2). Interpretations for the remaining 16 percent of the area, mostly within shallow nearshore areas, were considered less certain because of the absence of backscatter data and either a lack of sediment samples, or samples that were mostly qualitatively described. Areas of high confidence are combined and indicated as a single polygon on the sediment texture map (fig. 17). Confidence levels are attached to each of the interpreted polygons contained within the sediment texture geospatial data file included in Appendix 1 — Geospatial Data. A subset of the sediment texture map from the mouth of western Vineyard Sound, figure 18, illustrates how high-resolution geophysical, quantitative sediment sample and sea-floor photograph data relate to the interpretation. Relative to the primary sediment types in the Barnhardt and others (1998) classification (gravel, sand, mud, and rock), the sea floor of Vineyard and western Nantucket Sounds is composed of 65 percent sand, 23 percent gravel, 11 percent rock, and 1 percent mud. Figure 17 shows the coverage of the primary and composite Barnhardt classification units. Separate polygons exist for the same sediment type where areas of high and low confidence meet (fig. 17). Along this boundary that was defined by confidence level, the sediment type assigned to polygons on either side of the boundary may not match exactly, because in areas of low confidence, no backscatter data exist, bathymetry can be low resolution, and no samples with grain-size analysis exist. In these situations a low-confidence area polygon may only be assigned a primary sediment type, but an adjacent higher confidence area polygon would be assigned a more detailed composite sediment type. Average gravel, sand, silt, clay, and phi sizes were calculated for each of 60 sediment texture polygons that contained one or more of 219 sediment samples analyzed in the laboratory. The number of these samples per polygon ranges from 1 to 52, and the average number of samples per square kilometer is 1.7. The statistics represent the combined averages for all of the sediment samples within the polygon and are included within the geospatial data file for sediment texture in Appendix 1 — Geospatial Data. The combined average gravel, sand, and mud (silt and clay) statistics generally corroborate the sediment-types classified on the basis of the Barnhardt and others (1998) methods. Averages computed from the samples agreed with the interpreted primary and composite units 63 percent of the time and the primary units 77 percent of the time. The geophysical data indicate that sea-floor composition varies significantly over short distances, even within many of the interpreted units, and considering the limited number of samples collected relative to the area of sea floor surveyed, perfect correlation between sample data and the interpreted classifications should not be expected. In each of the 14 instances where sample statistics conflicted with interpreted classifications, backscatter, bathymetry, and bottom photograph/video data indicated primarily gravelly (9 polygons) or rocky (5 polygons) bottom types despite sample data that documented finer material. These discrepancies are primarily a function of too few samples with laboratory analyses and of general undersampling of coarse-grained material by the grab sampling method. In many of the conflicting areas, attempts to collect grab samples failed to recover material, but photographs and video collected during the sampler deployment documented the presence of boulders, cobbles, or gravelly sediment. Our analyses show that average phi size and particle content by weight statistics from bottom grab data in rock and gravel areas should be used cautiously in the absence of additional data, because these statistics may be biased toward finer grain sizes. Physiographic ZonesMapping of physiographic zones in the 494 km2 area (fig. 19) adapted the classification of Kelley and others (1998) in defining nearshore basins, outer basins, nearshore ramps, rocky zones, and hard-bottom plains. The classification was expanded to include ebb-tidal deltas, coastal embayments, shoal/sand waves, and shell zones. The results correlate with mapping conducted in nearby Cape Cod and Buzzards Bays by Pendleton and others (2013) and Foster and others (2015). Rocky zones include rugged, high-relief fields of mounded boulders and cobble near the terminal moraines, as well as lower relief and isolated bathymetric highs composed of till in central portions of the sounds. Water depths range from 1 to 30 m. Although boulders and coarse-grained sediment are found within all physiographic zones defined here, they dominate the sea floor in rocky zones, which cover 84 km2, or 17 percent of the study area. Coastal embayments zones include several small bays and harbors in the vicinity of Woods Hole and along the shorelines of the Elizabeth Islands. Water depths range from 1 to 20 m. Coastal embayments cover 0.9 km2, less than 0.2 percent of the study area. Ebb-tidal delta zones consist of lobate sandy shoals adjacent to inlets that form through the interaction of waves and ebbing tidal currents. Water depths range from 1 to 14 m. Ebb-tidal deltas in the study area are on the southward sides of several bays along the south coast of Cape Cod on Nantucket Sound, as well as on the Buzzards Bay side of tidal passages between the Elizabeth Islands. These features cover 0.7 km2, less than 0.2 percent of the study area. Nearshore Ramp zones are areas of gently sloping sea floor with generally shore-parallel bathymetric contours. Water depths range from 0 to 30 m. This zone is covered by primarily sandy sediment, though patches of cobbles and boulders crop out on the sea floor in places. Nearshore ramps are typically adjacent to arcuate shoreline areas and grade into deepwater nearshore basin, hard-bottom plain, or outer basin zones. Nearshore ramps cover 70.8 km2, or about 14 percent of the study area. Nearshore basins zones are areas of shallow, low-relief sea floor adjacent to the mainland and separated from offshore areas by islands and shoals. Water depths range from 0 to 35 m. Along their landward margins, the basin sediment merges with the intertidal zone, often a nearshore ramp, in a gradational contact. Nearshore basins cover 80 km2, or about 16 percent of the study area. Shoal/sand waves are sea floor zones dominated by linear to sinuous, high-relief bedforms (up to 16 m locally) primarily composed of sandy sediments that have been reworked from adjacent glacial deposits by energetic tidal currents. Water depths range from approximately 3 to 30 m. The largest shoals form elongate chains in central parts of the sounds that geologic and geophysical data suggest have formed around late Pleistocene age glacial material (Qd), which is exposed at the sea floor locally along the lengths of the shoals. Shoal/sand wave zones cover 97 km2, or about 20 percent of the study area. Hard-bottom plains are mostly low-relief but rough zones of sea floor composed primarily of coarse sands and gravels. Hard-bottom plains dominate the main passages of the sounds situated between the shoal/sand wave zones. Water depths range from 4 to 30 m. These zones cover 123 km2, or 25 percent of the study area. Outer basins are low-relief and mostly smooth zones of sea floor in water depths greater than 30 m. The only outer basin identified in the study area lies beyond the western mouth of Vineyard Sound, on the margin of Rhode Island Sound. This broad depression is characterized by primarily muddy sands, and it covers 35 km2, or 7 percent of the study area. Shell zones are areas that are nearly completely covered by carbonate shells. High densities of slipper shells (Crepidula fornicata) were recognized within an area of sea floor between Hedge Fence and Squash Meadow Shoals in western Nantucket Sound (figs. 19 and 20). Despite high acoustic backscatter in sidescan-sonar data (fig. 4), sediment samples recovered primarily fine-grained surficial sediments beneath the shell bed. This dense reef (figs. 4 and 19) covers approximately 2 km2, or 0.4 percent of the sea floor by area. The Shell Zone water depths range from 15 to 18 m. Foster and others (2015) and Ackerman and others (2015) recognize similar accumulations of Crepidula in the central Buzzards Bay basin and more isolated sites within western Nantucket Sound. |

![]() U.S. Department of the Interior |
U.S. Geological Survey
U.S. Department of the Interior |
U.S. Geological Survey
URL: http://pubsdata.usgs.gov/pubs/of/2016/1119/ofr20161119_results.html
Page Contact Information: GS Pubs Web Contact
Page Last Modified: Wednesday, 11-Oct-2017 17:56:40 EDT