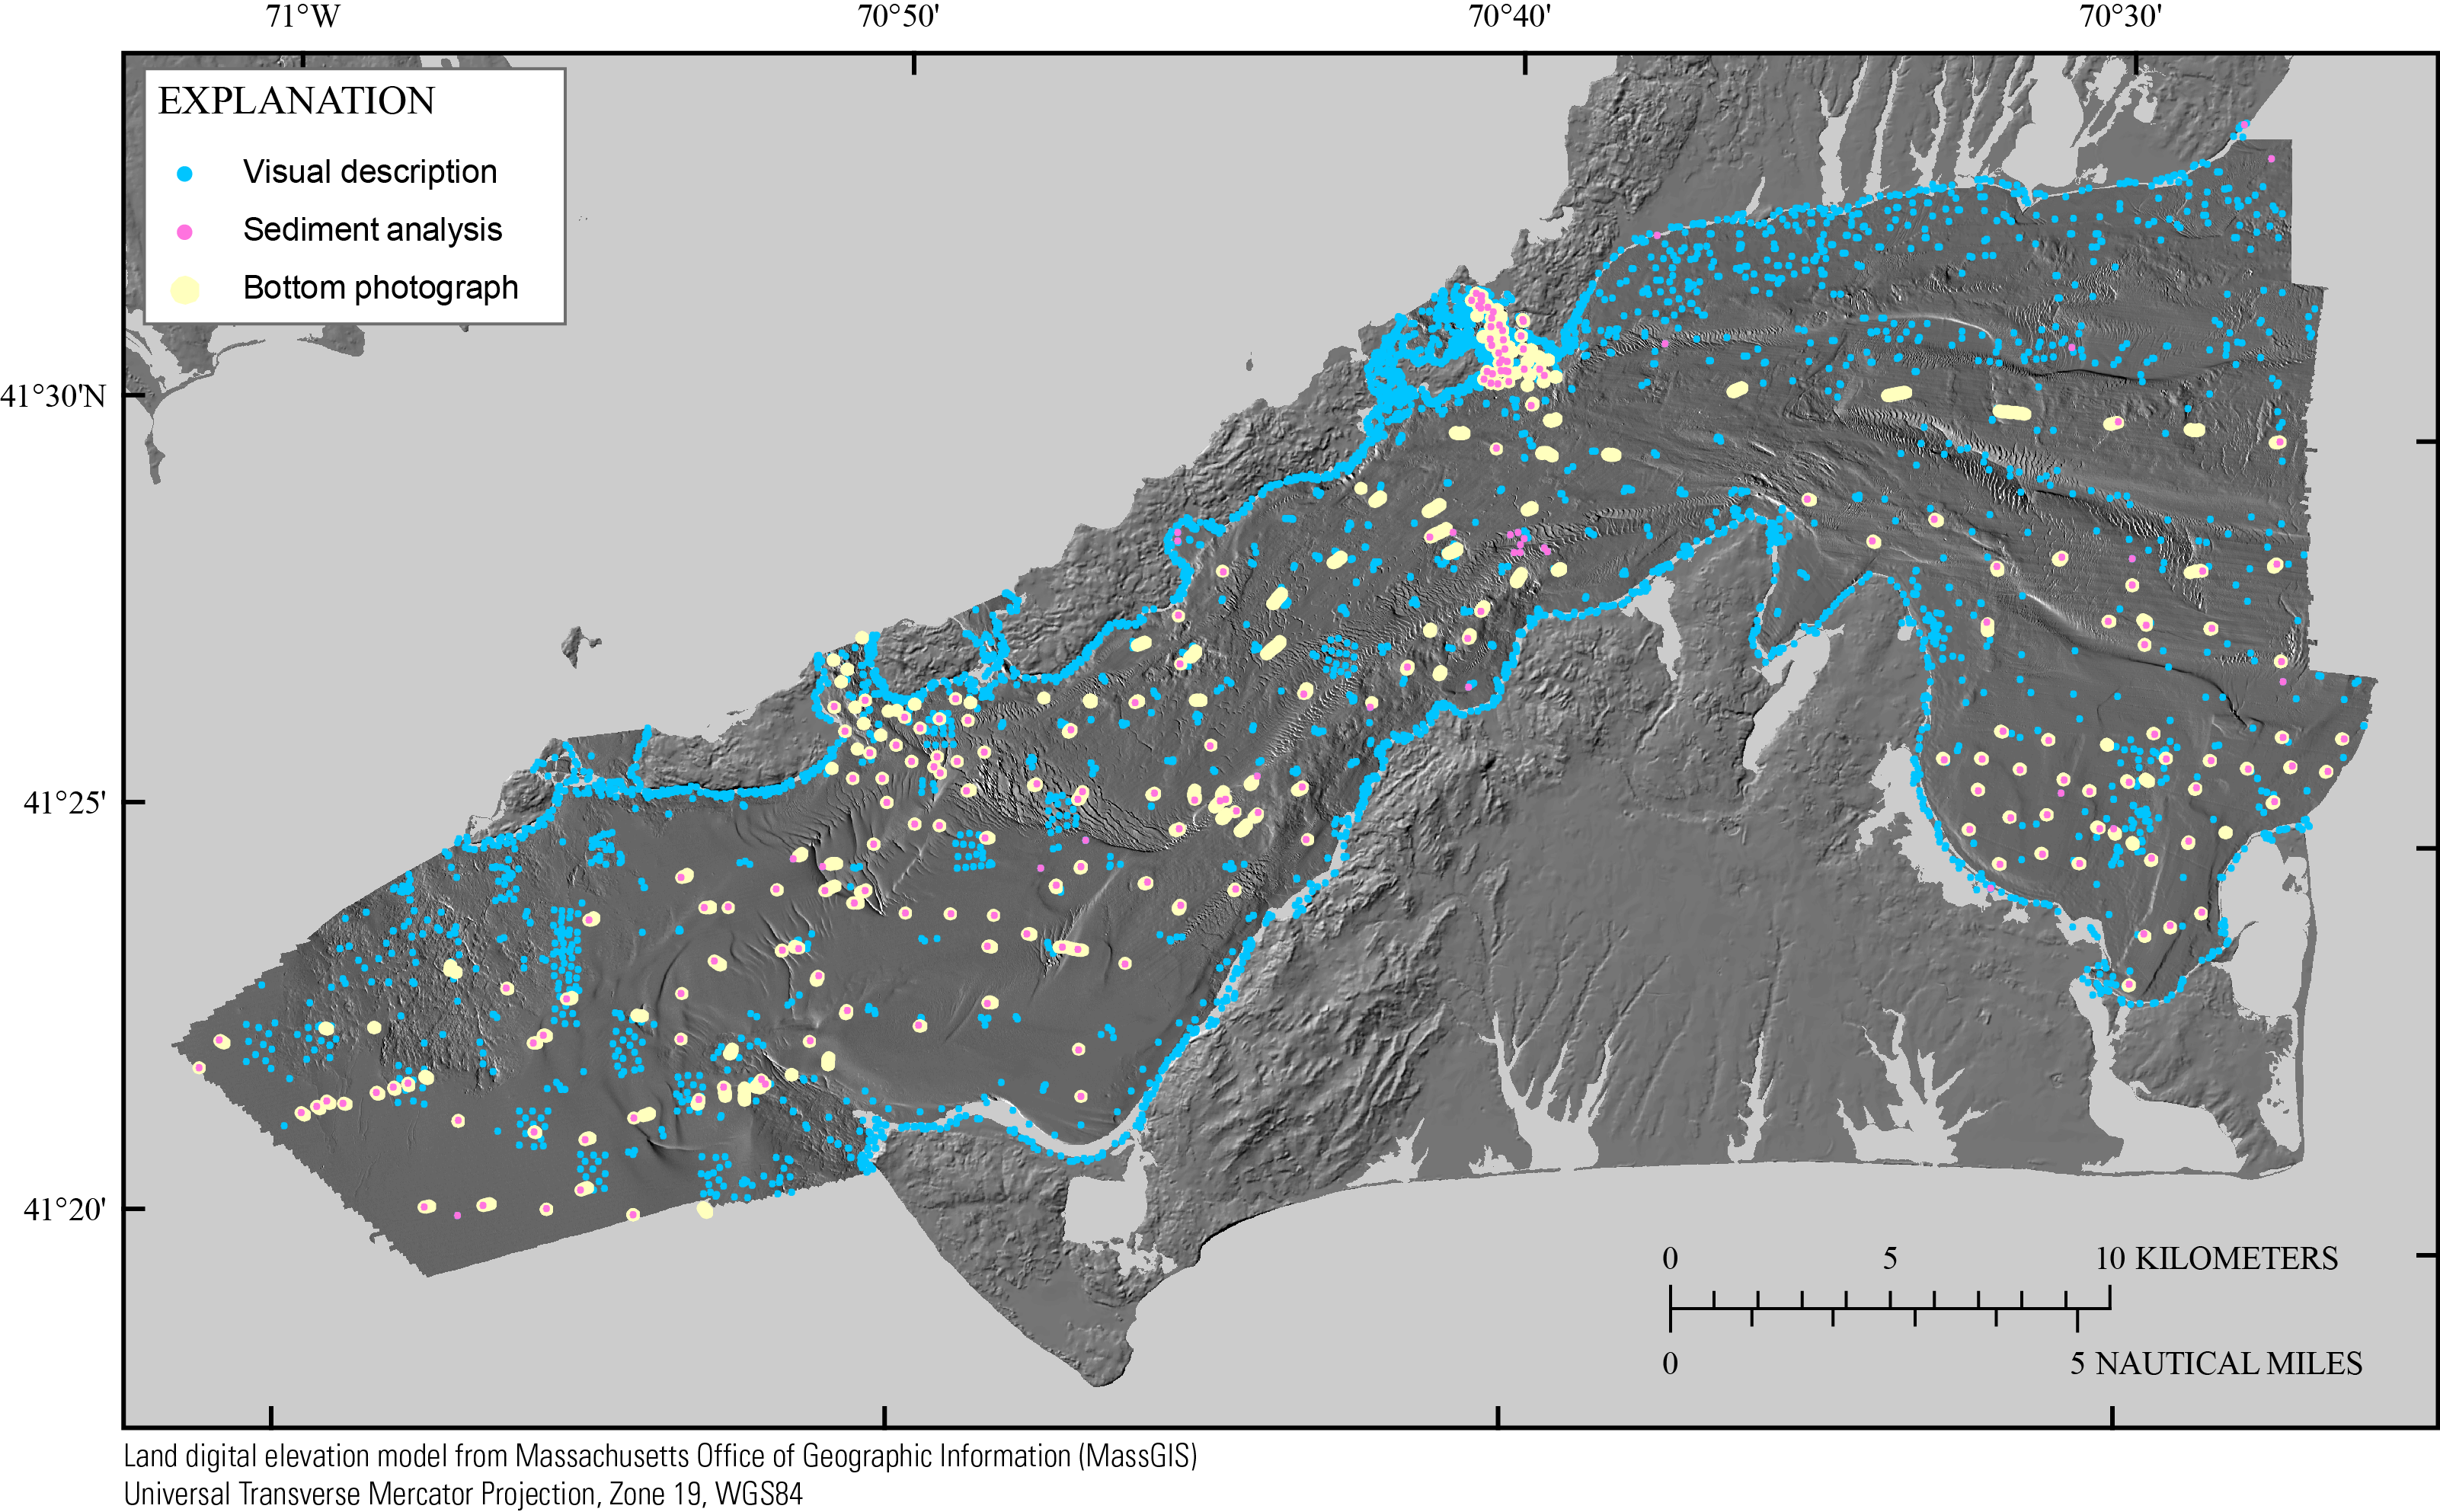
Figure 6. Map showing locations of observations of sea-floor composition used to aid the geophysical and geologic interpretations (Ford and Voss, 2010; McMullen and others, 2012; Emily Huntley, Massachusetts Office of Coastal Zone Management, written communication, 2014). Blue dots indicate visual descriptions made from sediment grab samples, vibracore tops, or sea-floor photographs/video, or visual descriptions obtained from National Oceanic and Atmospheric Administration nautical charts (generally near the shoreline). Magenta dots indicate sediment grab samples that were analyzed in a laboratory to obtain grain-size statistics. Processed samples are preferred over those that were only described visually. Bottom photograph locations, indicated by yellow dots, are generally associated with sites where samples were collected and grain-size statistics were processed. The bathymetric hillshade relief map is derived from the composite bathymetry shown in figure 3.
|