Open-File Report 2016–1168
High-Resolution Geophysical Data From the Inner Continental Shelf: South of Martha’s Vineyard and North of Nantucket, Massachusetts
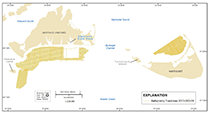
Data Collection and ProcessingSurvey OperationsA suite of acoustic sonars including an interferometric sonar (bathymetry and backscatter), a sidescan sonar (backscatter), and a chirp seismic-reflection profiler (subsurface stratigraphy and structure), were used to map approximately 185 km2 of the inner continental shelf. The geophysical mapping (survey 2013–003–FA; table 1) was conducted during a research cruise aboard the MV Scarlett Isabella (fig. 2) from May 22 to June 11, 2013. Methods used in the collection, processing, and analysis of the data are detailed in the following sections. A full description of the data-acquisition parameters, processing steps, and accuracy assessments can be found in the metadata files for each individual spatial dataset (appendix 1). Typically, geophysical observations are validated by the collection of sediment samples, bottom photographs, and video data soon after this type of survey. However, validation data were collected within much of this study area 18 months prior to survey 2013–003–FA during a sampling survey conducted by the USGS, the Massachusetts Office of Coastal Zone Management (CZM), and the U.S. Environmental Protection Agency (see “Sampling” section below). Sediment samples, video, and photographs were also collected in the area north of Nantucket in May 2016. Table 1. Survey details for the data collected in the study areas south of Martha’s Vineyard and north of Nantucket, Massachusetts, May to June 2013. [A U.S. Geological Survey field activity number (for example, 2013–003–FA) may also be referenced as a five-digit number (for example, 13003). kHz, kilohertz]
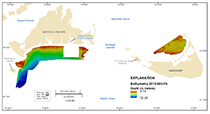
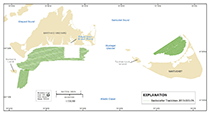
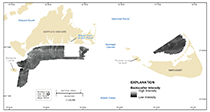
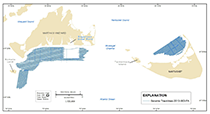
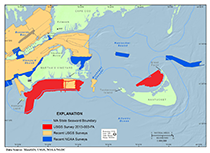
1Backscatter data were collected during this survey by using the SEA SWATHplus and an Edgetech 4200 sidescan sonar; only the SWATHplus interferometic backscatter data were processed to completion and published in this report. Bathymetry Approximately 1,900 linear kilometers of bathymetric data (fig. 3; table 1) were acquired in the survey areas south of Martha’s Vineyard and north of Nantucket by using a Systems Engineering and Assessment, Ltd. (SEA) SWATHplus-M 234-kilohertz (kHz) interferometric sonar system at a rate of 15 pings per second. During survey 2013–003–FA, the sonar transducers were mounted on a rigid pole from the port side of the MV Scarlett Isabella (fig. 2) about 2.17 m below the water line. A Coda Octopus F185R motion reference unit, mounted directly above the transducers, measured vertical displacement (heave) and attitude (pitch and roll) of the vessel during data acquisition. Sound-velocity profiles were collected approximately every 2 to 4 hours with an ODIM MVP30 moving vessel profiler or an AML Oceanographic Minos-X vertical sound velocity profiler. Bathymetric data were collected with a variable range, sonar transmit power of 80 percent, transmit length of 43 cycles, and a receive length of 4,096 samples. Survey lines were run at an average speed of 5 nautical miles per hour (knots) and were spaced approximately 100 m apart to obtain overlapping swaths of data and full coverage of the sea floor. Real Time Kinematic Global Positioning System (RTK–GPS) navigation was used to determine horizontal positioning and vertical water-level heights. Corrections were sent via cellular modem and very high frequency (VHF) radio to the survey vessel from a base station on land. The primary reference station (MOF2) was located at the USGS Marine Operations Facility (MOF) in Falmouth, Mass. (fig. 1). A NOAA VDatum transformation grid was used to offset the ellipsoidal water-level height corrections to the mean lower low water (MLLW) tidal datum within HYPACK (version 2013). SEA SWATHplus acquisition software (version 3.07.17.00) and the Computer Aided Resource Information System (CARIS) Hydrographic Information Processing System (HIPS, version 8.0) were used to collect and process the raw bathymetric soundings. Navigation data were inspected and edited, soundings were adjusted by using corrections from RTK–GPS water-level heights and sound-velocity profile data, and any spurious soundings were eliminated before the final processed soundings were gridded at a resolution of 5 meters per pixel (fig. 4). Approximately 660 linear kilometers of interferometric-bathymetry data were collected by the USGS south of Martha’s Vineyard, Mass., in 2007 as part of a separate project (Denny and others, 2009) to study the area around Woods Hole Oceanographic Institution’s (WHOI) Martha’s Vineyard Coastal Observatory (MVCO). Therefore the 2013 survey avoided collecting new data over this area, with the exception of a few widely spaced coincident lines, along which data were collected for comparison to the 2007 data. The data from survey 2007–011–FA were collected aboard the research vessel (RV) Megan T. Miller with the same bathymetric-sonar system used during the 2013 survey. The 2007 data, which were collected along tracklines spaced between 40–70 meters apart, are available in Denny and others (2009). Note that the final corrected soundings from the 2007 survey were referenced to a local vertical datum at the WHOI MVCO, not to MLLW. The 2013 USGS swath bathymetric dataset is available as a 5-m per pixel digital elevation model in 32-bit floating point georeferenced tagged image file format (GeoTIFF) in appendix 1. A depth-colored shaded-relief image can also be found in appendix 1. Additional details about the acquisition and processing of the swath bathymetric data can be found in the metadata for the trackline and raster spatial datasets in appendix 1. Acoustic Backscatter Approximately 1,920 linear kilometers of acoustic backscatter data (figs. 5 and 6) were collected in the survey areas south of Martha’s Vineyard and north of Nantucket during USGS field activity 2013–003–FA using a SEA SWATHplus-M 234-kHz interferometric sonar system and an Edgetech 4200 SP Chirp sidescan sonar. The SWATHplus system was mounted on a rigid pole from the port side of the MV Scarlett Isabella, and the Edgetech 4200 was towed approximately 5 to 10 m above the sea floor from a J-frame on the stern. Navigation for the SWATHplus-M was recorded from the RTK–GPS antenna mounted directly above the SWATHplus-M system, and navigation from the Edgetech 4200 was recorded with a Global Positioning System (GPS) antenna mounted on top of the acquisition laboratory van (fig. 2). For the Edgetech 4200, horizontal offsets from the GPS antenna to the towed sidescan-sonar system, including cable-out linear layback, were measured and accounted for in the SonarWiz acquisition software (version 5.05.0015). Edgetech sidescan-sonar data were typically acquired with a swath width of 200 m (100 m to either side of vessel). Backscatter from both the Edgetech4200 sidescan sonar and the SEA SWATHplus-M 234-kHz interferometric sonar system were preliminarily processed during the survey. Imagery from the SWATHplus system were of superior quality and used during postprocessing to produce the final backscatter mosaics. Raw data from the Edgetech 4200, which had some technical issues, were archived and not postprocessed. SWATHplus backscatter data were processed by using SonarWiz (multiple versions between 5.06.0018 and 6.0.1.0032) between 2013 and 2015. The data were imported from SWATHplus SXR files, then line-by-line bottom-tracking corrections were applied to remove the water column at nadir. The SonarWiz automatic bottom-tracking algorithm was used and generally performed well. Automatic tracking parameters were adjusted slightly from line to line but typically were set to a blanking value of 7, a duration value of 2, and a threshold of 93 with line smoothing turned on. Some lines required manual adjustment to the automatic bottom-tracking delineation, which was performed as needed in the SonarWiz bottom-tracking editor. In general, there was also an additional altitude offset of a half meter applied to the bottom tracking in order to minimize residual nadir artifacts in some parts of the mosaic. Gain was applied to the processing by using an empirical gain normalization function (EGN) with port and starboard intensities set to 67. Because of the size of the survey areas, subsets of backscatter imagery were individually exported from SonarWiz at 1-m per pixel resolution and then mosaicked together into a composite, 1-m per pixel resolution 8-bit GeoTIFF file by using Global Mapper (version 17.0). The gray-scale GeoTIFF mosaic of backscatter imagery for the survey areas can be found in appendix 1. Not all backscatter data were used in the final mosaic. Omissions include data from tielines, data from files in areas where more complete or higher resolution data were available from adjacent sonar survey lines, and excessively noisy data. Additional details about the acquisition and processing of the backscatter data can be found in the metadata for the trackline and GeoTIFF mosaic spatial datasets in appendix 1. Seismic-Reflection Profiling Approximately 1,920 linear kilometers of chirp seismic-reflection data were collected in the survey areas south of Martha’s Vineyard and north of Nantucket using an EdgeTech Geo-Star FSSB subbottom profiling system and an SB-0512i towfish (FM swept frequency 0.5 to 12 kHz), which was mounted on a catamaran and towed between 30 and 50 m astern of the survey vessel (fig. 7). SonarWiz seismic-acquisition software (version 5.03.0016) was used to control the Geo-Star topside unit, digitally log trace data in the SEG–Y rev. 1 format (IEEE floating point), and record GPS navigation coordinates to the SEG–Y trace headers (in arc seconds of latitude and longitude, multiplied by a scalar of 100). During field activity 2013–003–FA, data were acquired by using a 0.25-second shot rate, a 5-millisecond pulse length, and a 0.5- to 8-kHz frequency sweep, with recorded trace lengths of approximately 100 milliseconds (2,170 samples per trace at a 0.000046-second sample interval). Navigation was recorded with a GPS antenna mounted on top of the acquisition laboratory van. Horizontal offsets from the GPS antenna to the towed seismic-reflection system, including layback, were measured and accounted for during postprocessing. Seismic-reflection data were processed by using SIOSEIS (version 2013.2; Henkart, 2011) and Seismic Unix (version 4.2; Cohen and Stockwell, 2011; Stockwell and Cohen, 2008). All navigation data were extracted from trace headers, edited, and saved to ASCII text files. Water column portions of the traces were muted, and the effects of sea-surface heave were minimized. Trace amplitudes were gained by using a time-varying function and normalized by using automatic gain control. Profiles of the final processed trace data are included in this report as 8-bit, gray-scale, variable-density plots in the portable network graphics (PNG) format. The final shot-point and trackline navigation data are also included in two Esri shapefiles in appendix 1. Additional details about the acquisition and processing of seismic-reflection data can be found in the metadata for the trackline and shot-point spatial datasets and in the metadata for the PNG profile images in appendix 1. SamplingA sampling survey aboard the ocean survey vessel (OSV) Bold (USGS field activity 2011–015–FA) conducted by the USGS, CZM, and the U.S. Environmental Protection Agency (EPA) preceded the collection of geophysical data in this area. Forty-five samples from this sampling survey are coincident with the geophysical data collected during USGS field activity 2013–003–FA. In addition, 55 new samples were collected in May 2016 (USGS field activity 2016–005–FA) in the area north of Nantucket. Data from these two sampling surveys will be used to verify the geophysical survey data and to help form the basis for future interpretive geologic maps. Spatial data, including the results of sediment sample analyses and the locations of bottom photographs and videos collected during these two surveys, are currently unpublished. Video of the sea floor can be accessed via the USGS Coastal and Marine Geology Program’s Video and Photograph Portal (Golden and Ackerman, 2015) Additional Geophysical DataAdditional geophysical and geologic data, including swath bathymetry, acoustic backscatter, seismic-reflection profiles, and sampling data, are available for areas nearby and directly adjacent to the survey areas of this study (fig. 8). Some of these data were collected as part of the cooperative mapping program between the USGS and the Massachusetts Office of Coastal Zone Management (CZM); other data were collected by the USGS or NOAA during the past decade. The data and (or) additional information about these datasets are available online:
|
|
|||||||||||||||||||||||||||||||

![]() U.S. Department of the Interior |
U.S. Geological Survey
U.S. Department of the Interior |
U.S. Geological Survey
URL: http://pubsdata.usgs.gov/pubs/of/2016/1168/ofr2016-1168-collproc.html
Page Contact Information: GS Pubs Web Contact
Page Last Modified: Wednesday, 07-Dec-2016 23:31:25 EST