 |
Figure 1. Map showing the location of the survey areas (shaded in red) and local physiographic features south of Martha's Vineyard and north of Nantucket, Massachusetts. |
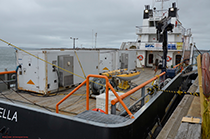 |
Figure 2. Photograph of motor vessel (MV) Scarlett Isabella, used for surveying in this project. |
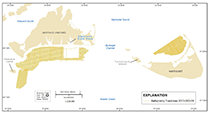 |
Figure 3. Map showing tracklines along which bathymetric data were collected in the survey areas, south of Martha's Vineyard and north of Nantucket, Massachusetts. |
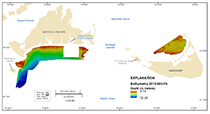 |
Figure 4. Map showing depth-colored shaded-relief bathymetry of the sea floor in the survey areas, south of Martha's Vineyard and north of Nantucket, Massachusetts. |
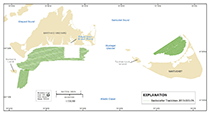 |
Figure 5. Map showing tracklines along which acoustic-backscatter data were collected in the survey areas, south of Martha's Vineyard and north of Nantucket, Massachusetts. |
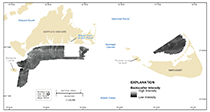 |
Figure 6. Map showing acoustic-backscatter intensity of the sea floor in the survey areas, south of Martha's Vineyard and north of Nantucket, Massachusetts. |
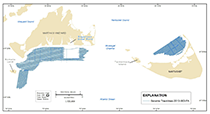 |
Figure 7. Map showing tracklines along which seismic-reflection profiles were collected in the survey areas, south of Martha's Vineyard and north of Nantucket, Massachusetts. |
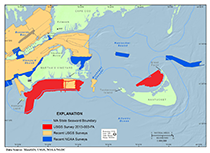 |
Figure 8. Map showing the location of additional geophysical data in Massachusetts waters adjacent to the survey areas south of Martha's Vineyard and north of Nantucket, May to June 2013. |
 |
Table 1. Survey details for the data collected in the study areas south of Martha’s Vineyard and north of Nantucket, Massachusetts, May to June 2013. |

