Open-File Report 2017-1165
| Laboratory Methodologies and Data AnalysesSediment from the push cores was sectioned in 1-cm intervals throughout the entire length of the core. Each 1-cm interval was subsampled and processed for bulk density, percentage organic matter content, a detailed grain-size analysis, and geochronology. Prior to being sectioned and subsampled, each core was X-rayed while still intact and in an upright position. Once the core was sampled, samples were kept refrigerated at approximately 3.3 degrees Celsius (°C) until they were processed. X-RadiographsUpon return from the field, all marsh push cores were X-rayed vertically onto an iCRco 11-x-14-inch cassette using an Ecotron EPX-F2800 X-ray unit at a distance of 79 cm for a 1:1.015 ratio. The cassette was inserted into and scanned using an iCR3600+ cassette scanner and processed using iCRco QPC XSCAN32 (ver. 2.10). Images were then exported as .tiff images and edited in Adobe Photoshop by using gray-scale color inversion and inserting a reference scale bar. Physical Sediment ParametersIn the laboratory, marsh core samples were homogenized in the sample bag, and the subsample for physical sediment parameters was extracted and processed for basic sediment characteristics: dry bulk density and porosity. Water content, porosity, and dry bulk density were calculated by determining water mass lost during drying. Known volumes of each wet subsample, usually 30–60 milliliters (mL), were packed into a graduated syringe with 0.5-cubic-centimeter (cm3) resolution. The wet sediment sample was then extruded into a preweighed aluminum tray, and the weight was recorded. The wet sediment sample and tray were placed in a drying oven for 48 hours at 60 °C. Water content (θ) was determined as the mass of water (lost when dried) relative to the initial wet sediment mass. Porosity (φ) was estimated with the following equation:
where Organic matter (OM) content was determined with a mass loss technique referred to as loss on ignition (LOI). The dry sediment sample from the previous process was homogenized with a porcelain mortar and pestle. Approximately 2.5 or 5 grams (g) of the dry sediment was placed into a preweighed porcelain crucible. The mass of the dried sediment was recorded with a precision of 0.01 g on an analytical balance. The sample was then placed inside a laboratory muffle furnace with stabilizing temperature control. The furnace was heated to 110°C for a minimum of 6 hours to remove hygroscopic water adsorbed onto the sediment particles. The furnace temperature was then lowered to 60°C, at which point the sediments could be reweighed safely. The dried sediment was returned to the muffle furnace. The furnace was heated to 550°C over a period of 30 minutes and kept at 550°C for 6 hours. The furnace temperature was then lowered to 60°C, at which point the sediments could be reweighed. The mass lost during the 6-hour baking period relative to the 110°C-dried mass is used as a metric of OM content (modified from Dean, 1974). Approximately 19 percent of the field samples were run in duplicate for LOI to assess precision. Grain-Size AnalysisGrain-size analyses were performed on a Beckman Coulter LS 13 320 laser diffraction particle size analyzer (beckmancoulter.com). Prior to analyses, sediment samples were digested with 8 mL of 30 percent hydrogen peroxide (H2O2) overnight to remove excess organics. The H2O2 was then evaporated slowly on a hot plate, and the sediment was washed and centrifuged twice with deionized water. To prevent damage to the Coulter LS 13 320, particles greater than 1 millimeter (mm) in diameter were removed with a number 18 (1000 micrometer [μm]) U.S. standard sieve. The samples were washed through the sieve with a 5-percent solution of sodium hexametaphosphate with filtered municipal water to act as a deflocculant. The sediment slurry was sonicated with a wand sonicator for 30–60 seconds before being introduced into the particle size analyzer. Two subsamples from each sample were processed with a minimum of four runs apiece. The data for each sample were exported as relative volumes for 92 size-classification channels, or bins, which correspond with the size-classification boundaries for American Society for Testing and Materials (ASTM) E11 standard specification for wire cloth and sieves for testing purposes. The raw grain-size data were processed with the free software program, GRADISTAT (ver. 8; see kpal.co.uk/gradistat) (Blott and Pye, 2001), which calculates the mean, median, sorting, skewness, and kurtosis of each sample geometrically in metric units and logarithmically in phi units (Φ) (Krumbein, 1934) using the Folk and Ward (1957) method. GRADISTAT also calculates the fraction of sediment from each sample by size category (for example, clay, coarse silt, and fine sand) based on Friedman and Saunders (1978), a modified Wentworth (1922) size scale. A macro function in Microsoft Excel, developed by the USGS SPCMSC, was applied to the data to calculate the average and standard deviation for each sample set (eight runs per sample) and to highlight runs that varied from the set average by more than ±1.5 standard deviations. Excessive deviations from the mean are likely the result of equipment error or extraneous organic material in the sample and are not considered representative of the sample. The highlighted runs were removed from the results, and the sample average was recalculated using the remaining runs. For downloadable data, see Ellis and others, 2018. Geochronology by Alpha SpectroscopyA subsample of sediment from each centimeter of each core was processed by standard alpha spectrometry procedures using polonium-210 (210Po) (Marot and Smith, 2012; a modification of Robbins and Edgington, 1975) to determine total lead-210 (210Pb) down core. In the laboratory, approximately 3.0 g of dried and homogenized sediment was spiked with 0.5 mL of polonium-209 (209Po), with an activity of 12 decays per minute per milliliter (dpm/mL). The sediment was then leached by the addition and subsequent evaporation to near dryness with a combination of concentrated nitric acid, hydrochloric acid, and 30 percent H2O2. Polonium-210 (210Po) and 209Po were electroplated onto silver planchets and counted twice, in two different chambers, for 24 hours on an alpha spectrometer. Count rate efficiency was determined for 209Po and applied to the 210Po counts. The total 210Pb was assumed to be in secular equilibrium with its granddaughter, 210Po in the down-core sediment.
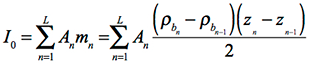
The fraction of 210Pb supported by radium-226 (226Ra) for this method was determined by the average measured 210Pb at the base of the core or where 210Pb curve appeared asymptotic. Sediment accumulation rates for each core were derived from profiles of excess 210Pb and standard radiotracer models (Robbins and Edgington, 1975; Appleby and Oldfield, 1978; Appleby, 2001). Before each model was applied, inventory for each radionuclide was determined to evaluate sediment focusing or removal, scavenging, or other processes that might influence the application of these isotopes for sediment deposition. Depth-integrated 210Pb inventory (I0; decays per minute per square centimeter; dpm/cm2) was computed using the technique described by Binford (1990) and Appleby (2001),
where An is specific activity (decays per minute per gram; dpm/g), mn is mass depth (grams per square centimeter; g/cm2), L is the depth to which 210Pb is in excess of parent 226Ra, zn is the linear depth (cm), and  is bulk density (g/cm3). is bulk density (g/cm3).
Mass accumulation rates (MARs; w) and linear sedimentation rates (LSRs; v) were evaluated using both the constant rate of supply (CRS) model and constant flux, constant sedimentation (CFCS) model (Robbins and Edgington 1975; Appleby and Oldfield 1978). The CFCS model was chosen for this study as it provides long-term perspective to sedimentation rates. Although short-term variations in sedimentation rates and 210Pb delivery are not well represented in the CFCS model, the model does provide a reasonable means to evaluate longer term (>20–30 year) sedimentation trends. For the marsh push cores, we used two different versions of the CFCS model to bracket the marsh accretion. The first application (method 1) uses depth and interval thickness measured in the laboratory at the time the core was sectioned to determine mass depth, which includes compaction induced during coring. Previous studies have used this mass depth to try to account for coring compaction; however, this approach may not capture all the uncertainty in rates derived using the CFCS model. This approach provides a conservative accumulation rate as it attempts to correct compaction indirectly. The second model (method 2) applies a compaction correction coefficient determined by the ratio of core-penetration length to core-sectioned length, to the sectioned depth interval, which distributes all compaction linearly over the core length. This approach uses linear depth instead of mass depth and returns a LSR (in centimeters per year, cm/y); MARs are computed as the product of the LSR and the average dry bulk density of the core or portion of the core analyzed. This approach provides an upper limit to LSR for the entire section analyzed. |

![]() U.S. Department of the Interior |
U.S. Geological Survey
U.S. Department of the Interior |
U.S. Geological Survey
URL: http://pubsdata.usgs.gov/pubs/of/2017/1165/ofr2017-1165_methods.html
Page Contact Information: GS Pubs Web Contact
Page Last Modified: Tuesday, 20-Mar-2018 14:17:56 EDT