Open-File Report 2017-1165
| Results and DiscussionThe Protected Back-Barrier Marshes of Cedar Island and Little Dauphin Island
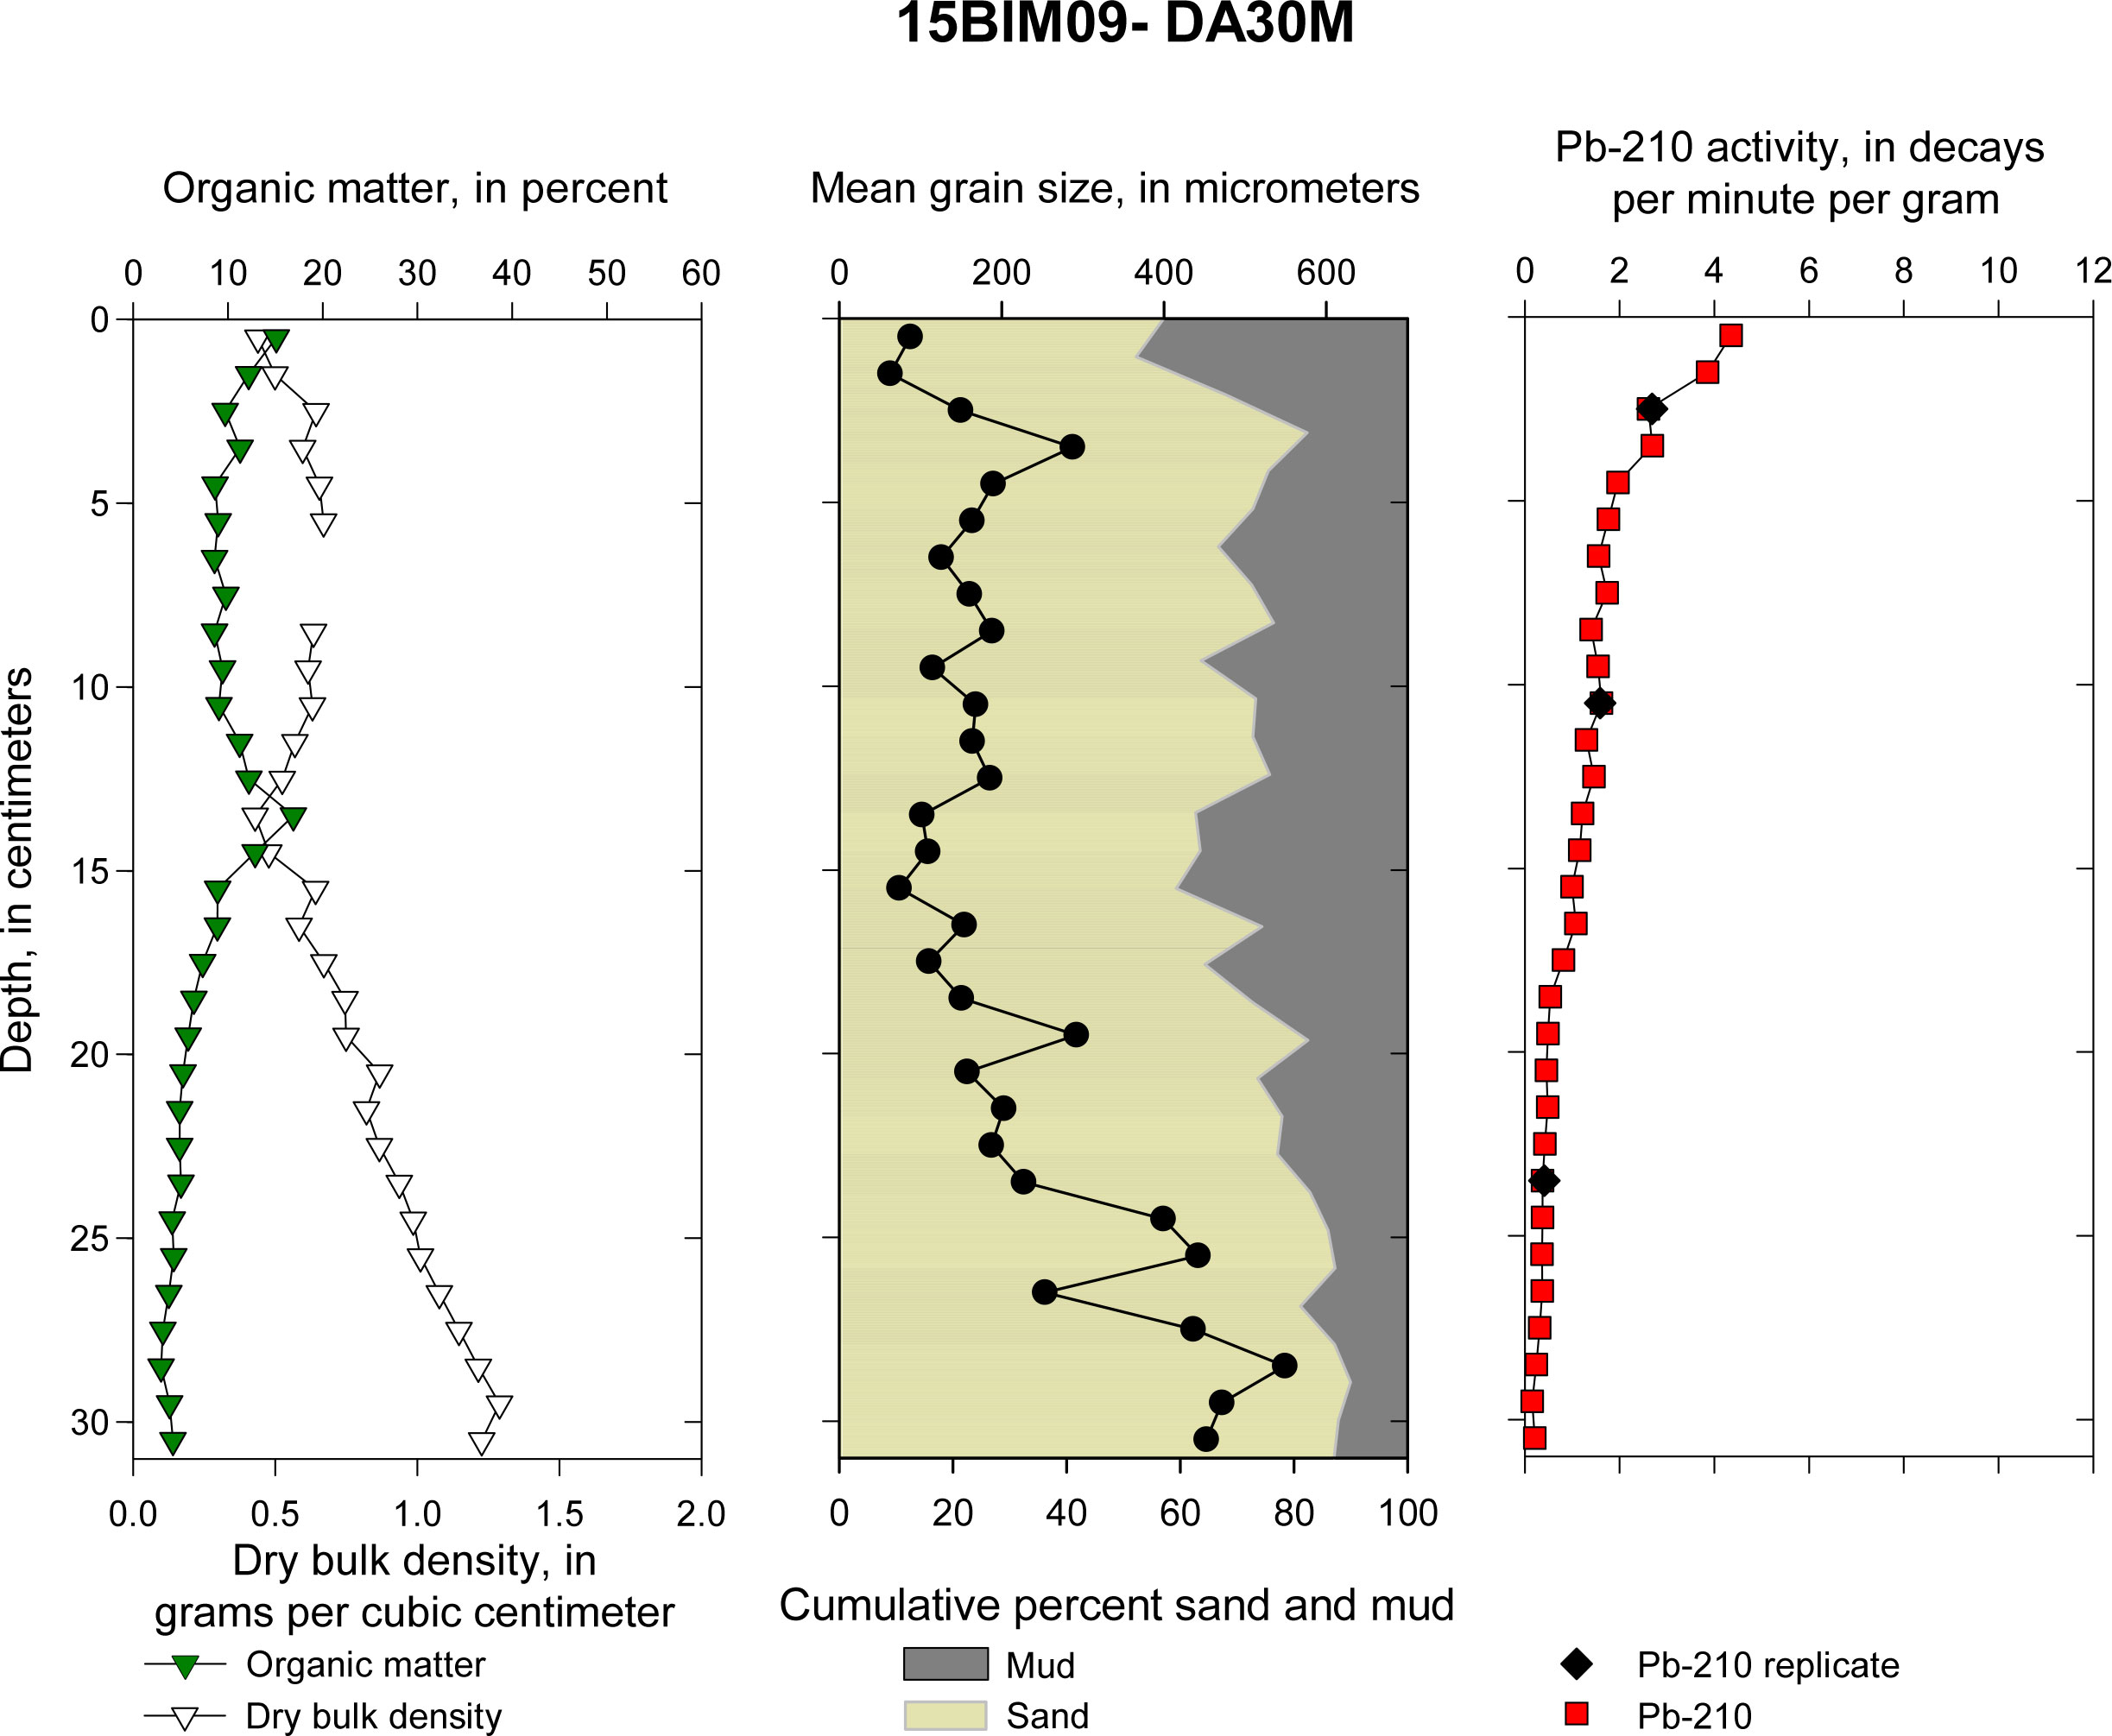 Figure 5. DA30M: Down-core plots of sediment parameters (dry bulk density and organic matter), sediment texture (percent sand, percent mud, and mean grain size), and total extracted Pb-210 activity with sample replicates.  Figure 6. DA04M: Down-core plots of sediment parameters (dry bulk density and organic matter) and total extracted Pb-210 activity. 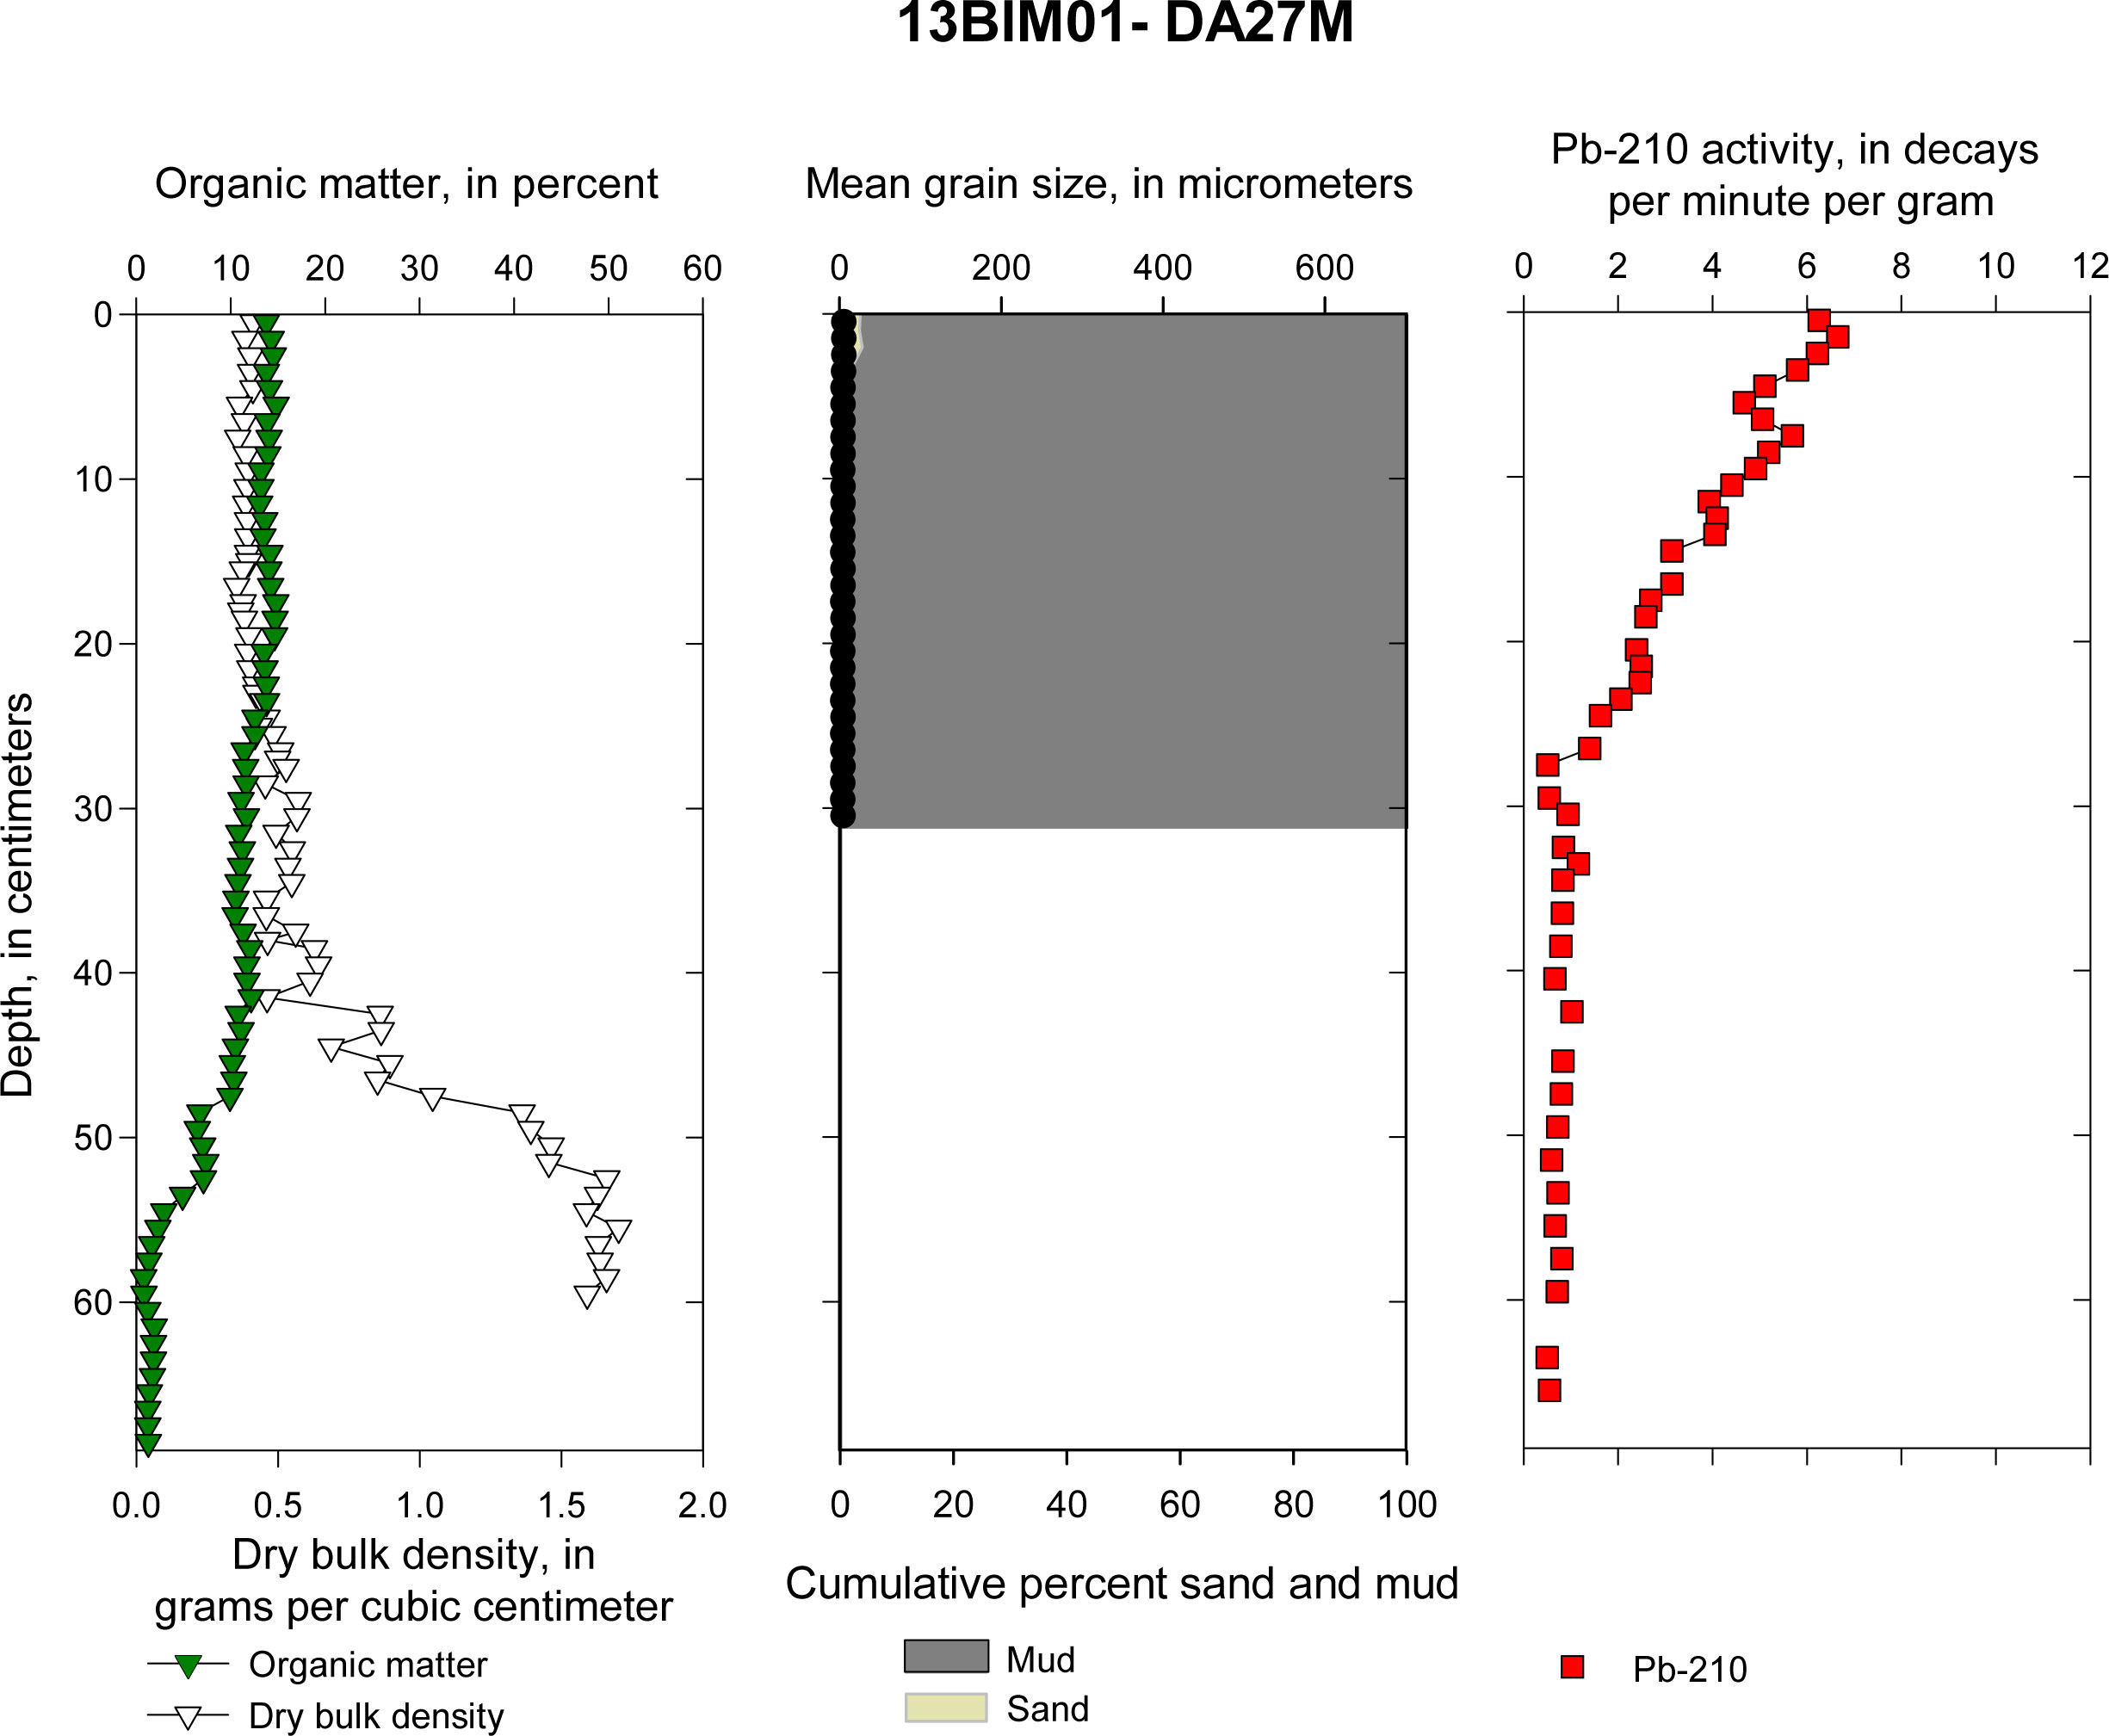 Figure 7. DA27M: Down-core plots of sediment parameters (dry bulk density and organic matter), sediment texture (percent sand, percent mud, and mean grain size), and total extracted Pb-210 activity.  Figure 8. DA33M: Down-core plots of sediment parameters (dry bulk density and organic matter), sediment texture (percent sand, percent mud, and mean grain size), and total extracted Pb-210 activity with sample replicates. 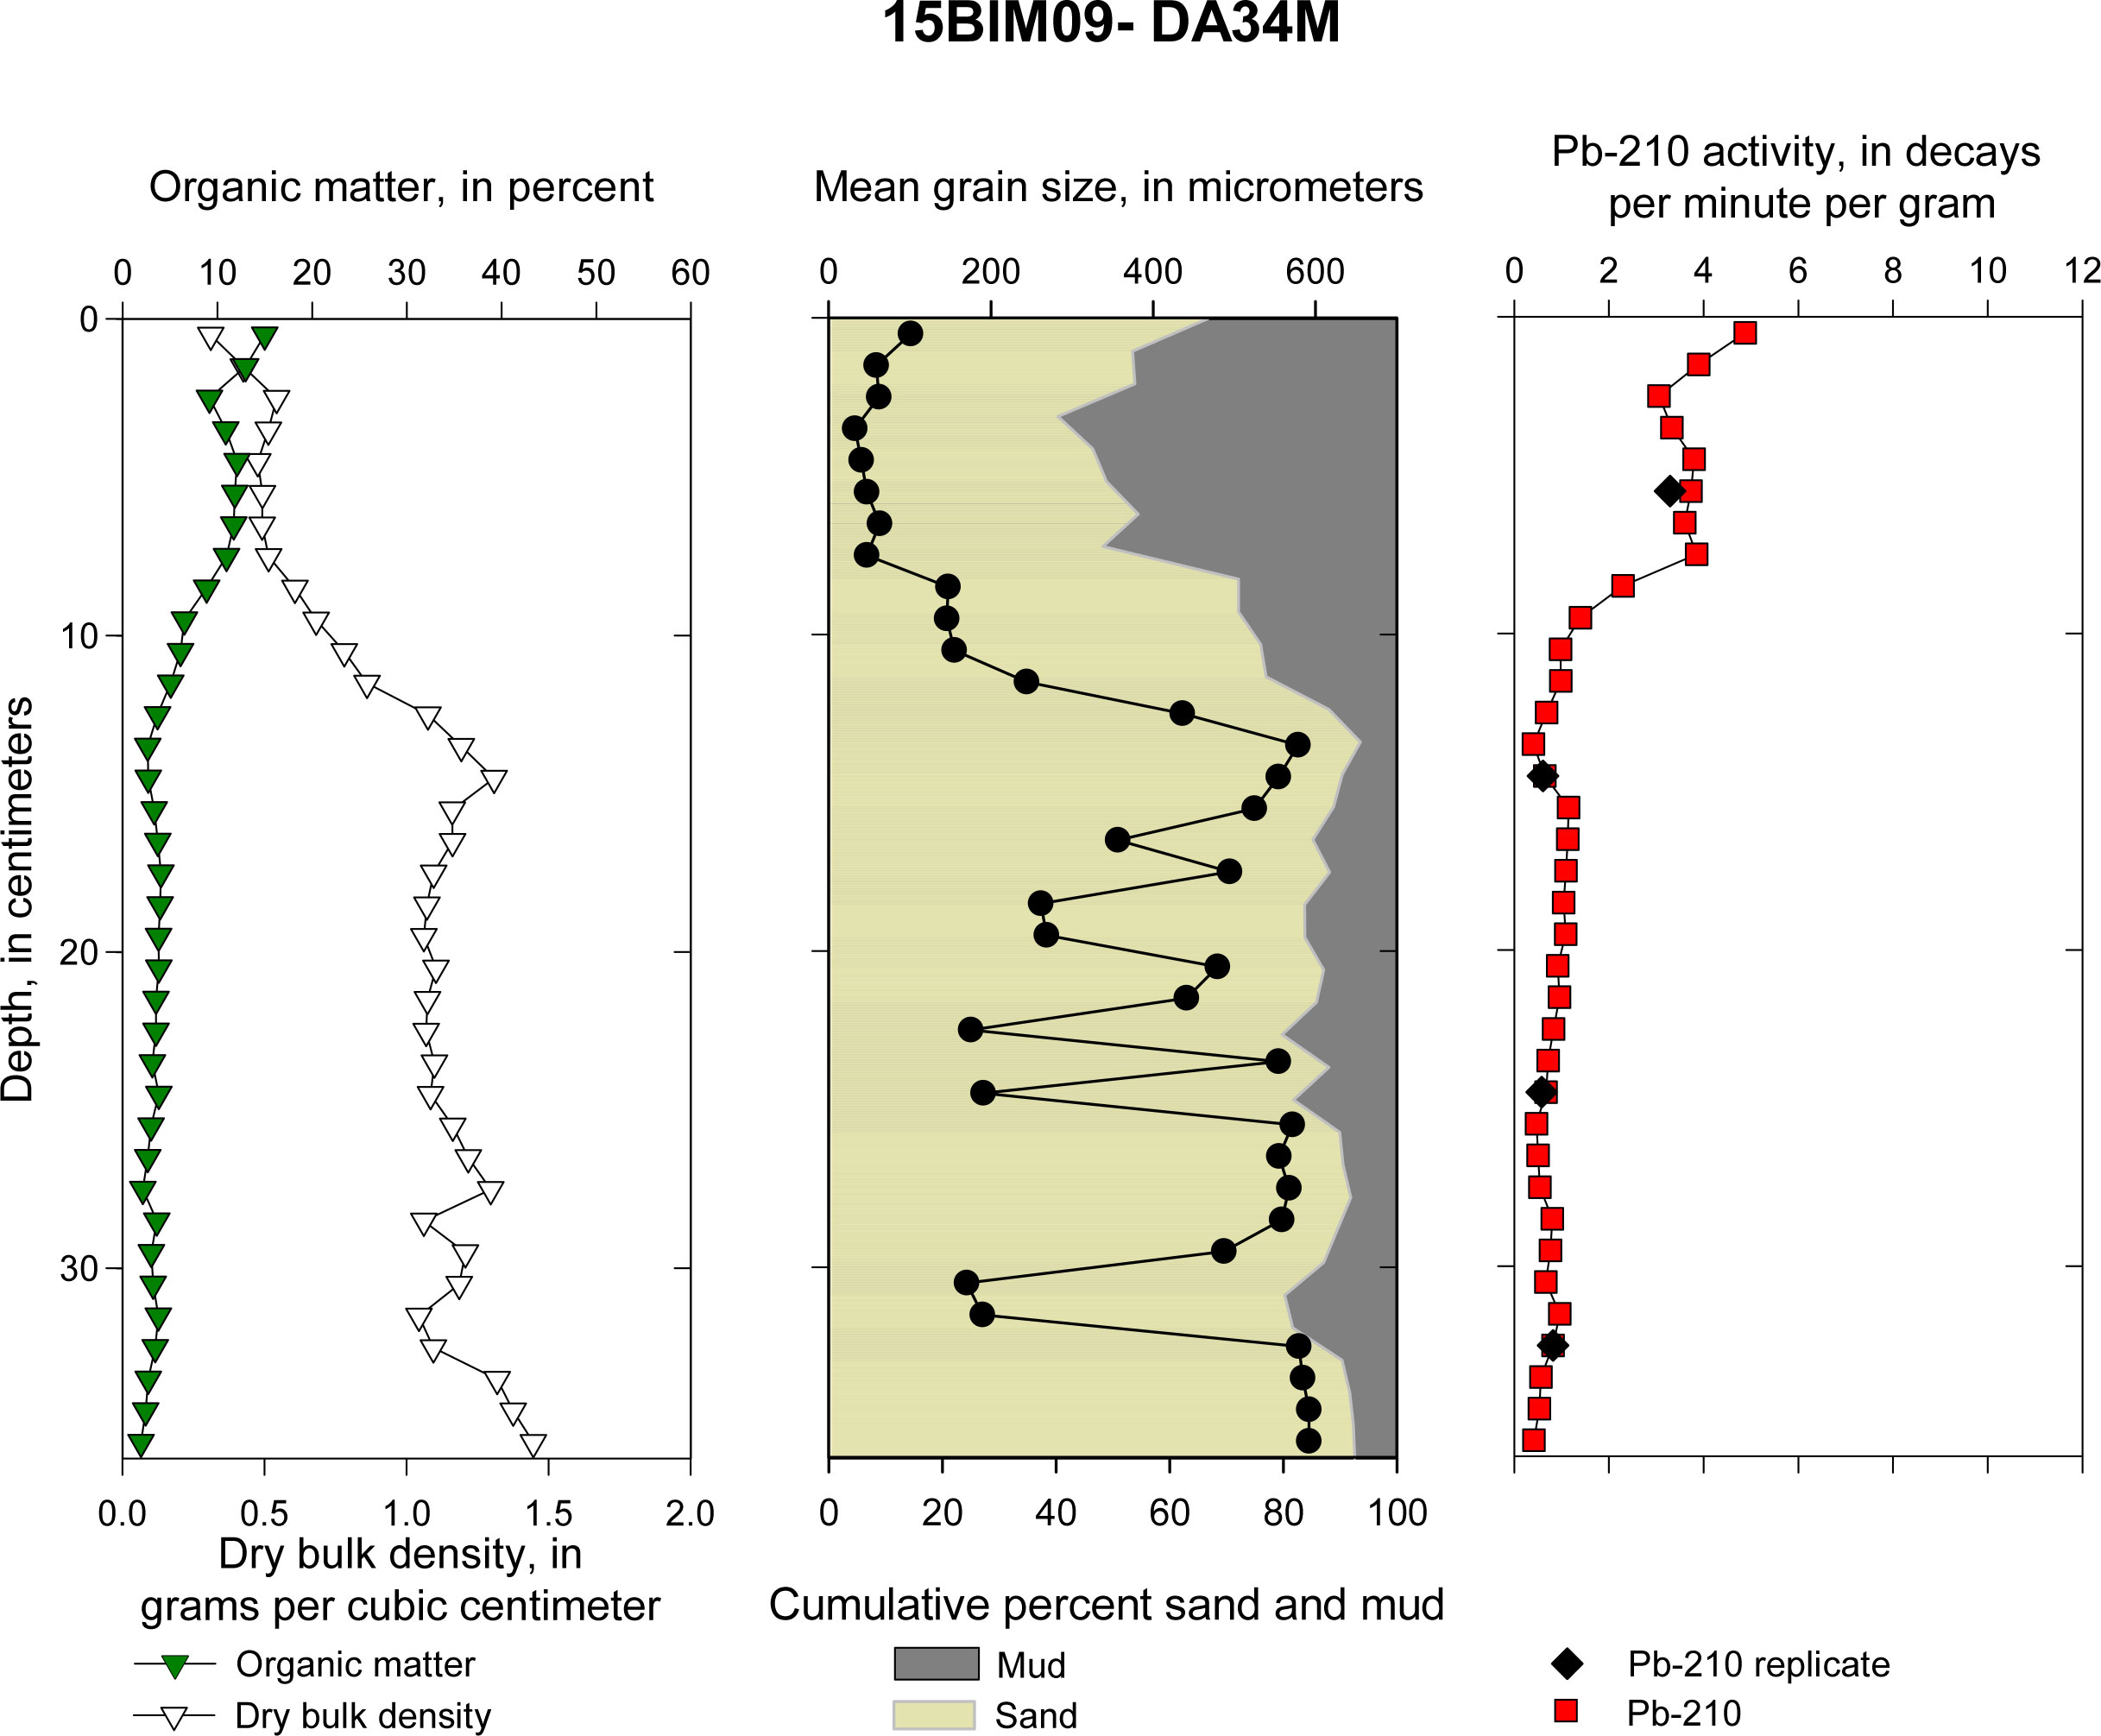 Figure 9. DA34M: Down-core plots of sediment parameters (dry bulk density and organic matter), sediment texture (percent sand, percent mud, and mean grain size), and total extracted Pb-210 activity with sample replicates. .jpg) Figure 10. DA31M(A): Down-core plots of sediment parameters (dry bulk density and organic matter), sediment texture (percent sand, percent mud, and mean grain size), and total extracted Pb-210 activity with sample replicates. .jpg) Figure 11. DA31M(B): Down-core plots of sediment parameters (dry bulk density and organic matter), sediment texture (percent sand, percent mud, and mean grain size), and total extracted Pb-210 activity with sample replicates. 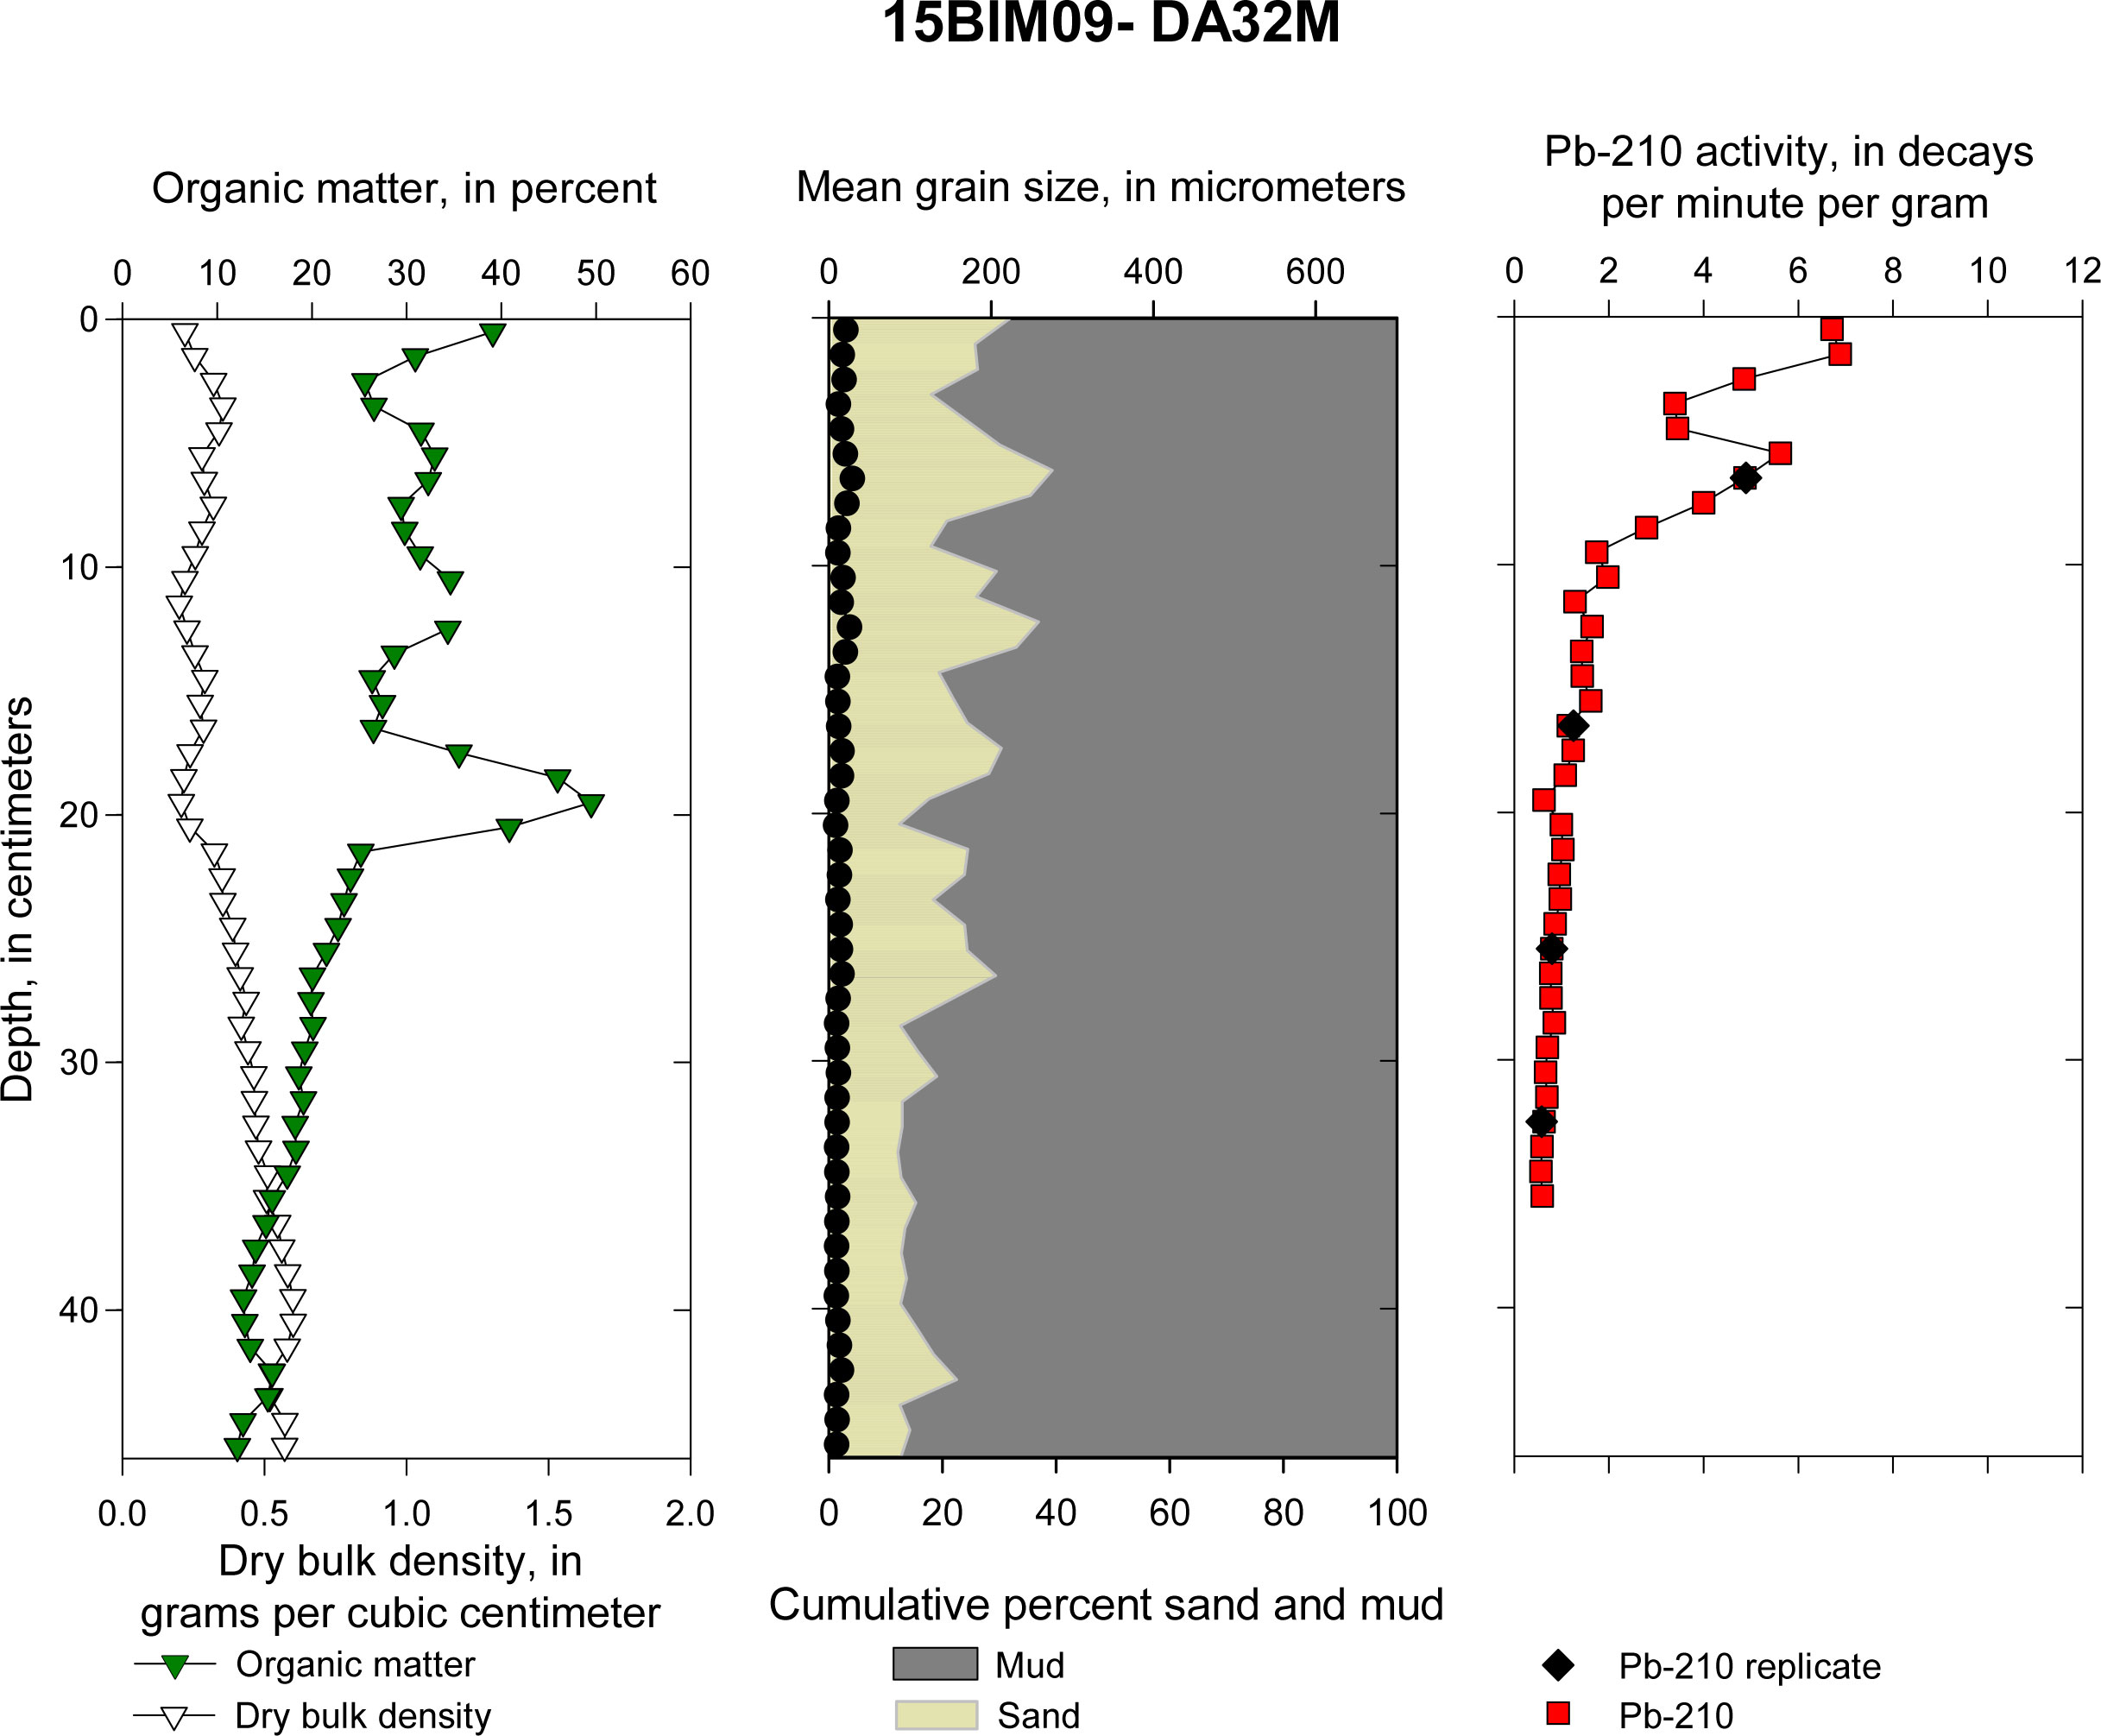 Figure 12. DA32M: Down-core plots of sediment parameters (dry bulk density and organic matter), sediment texture (percent sand, percent mud, and mean grain size), and total extracted Pb-210 activity with sample replicates. 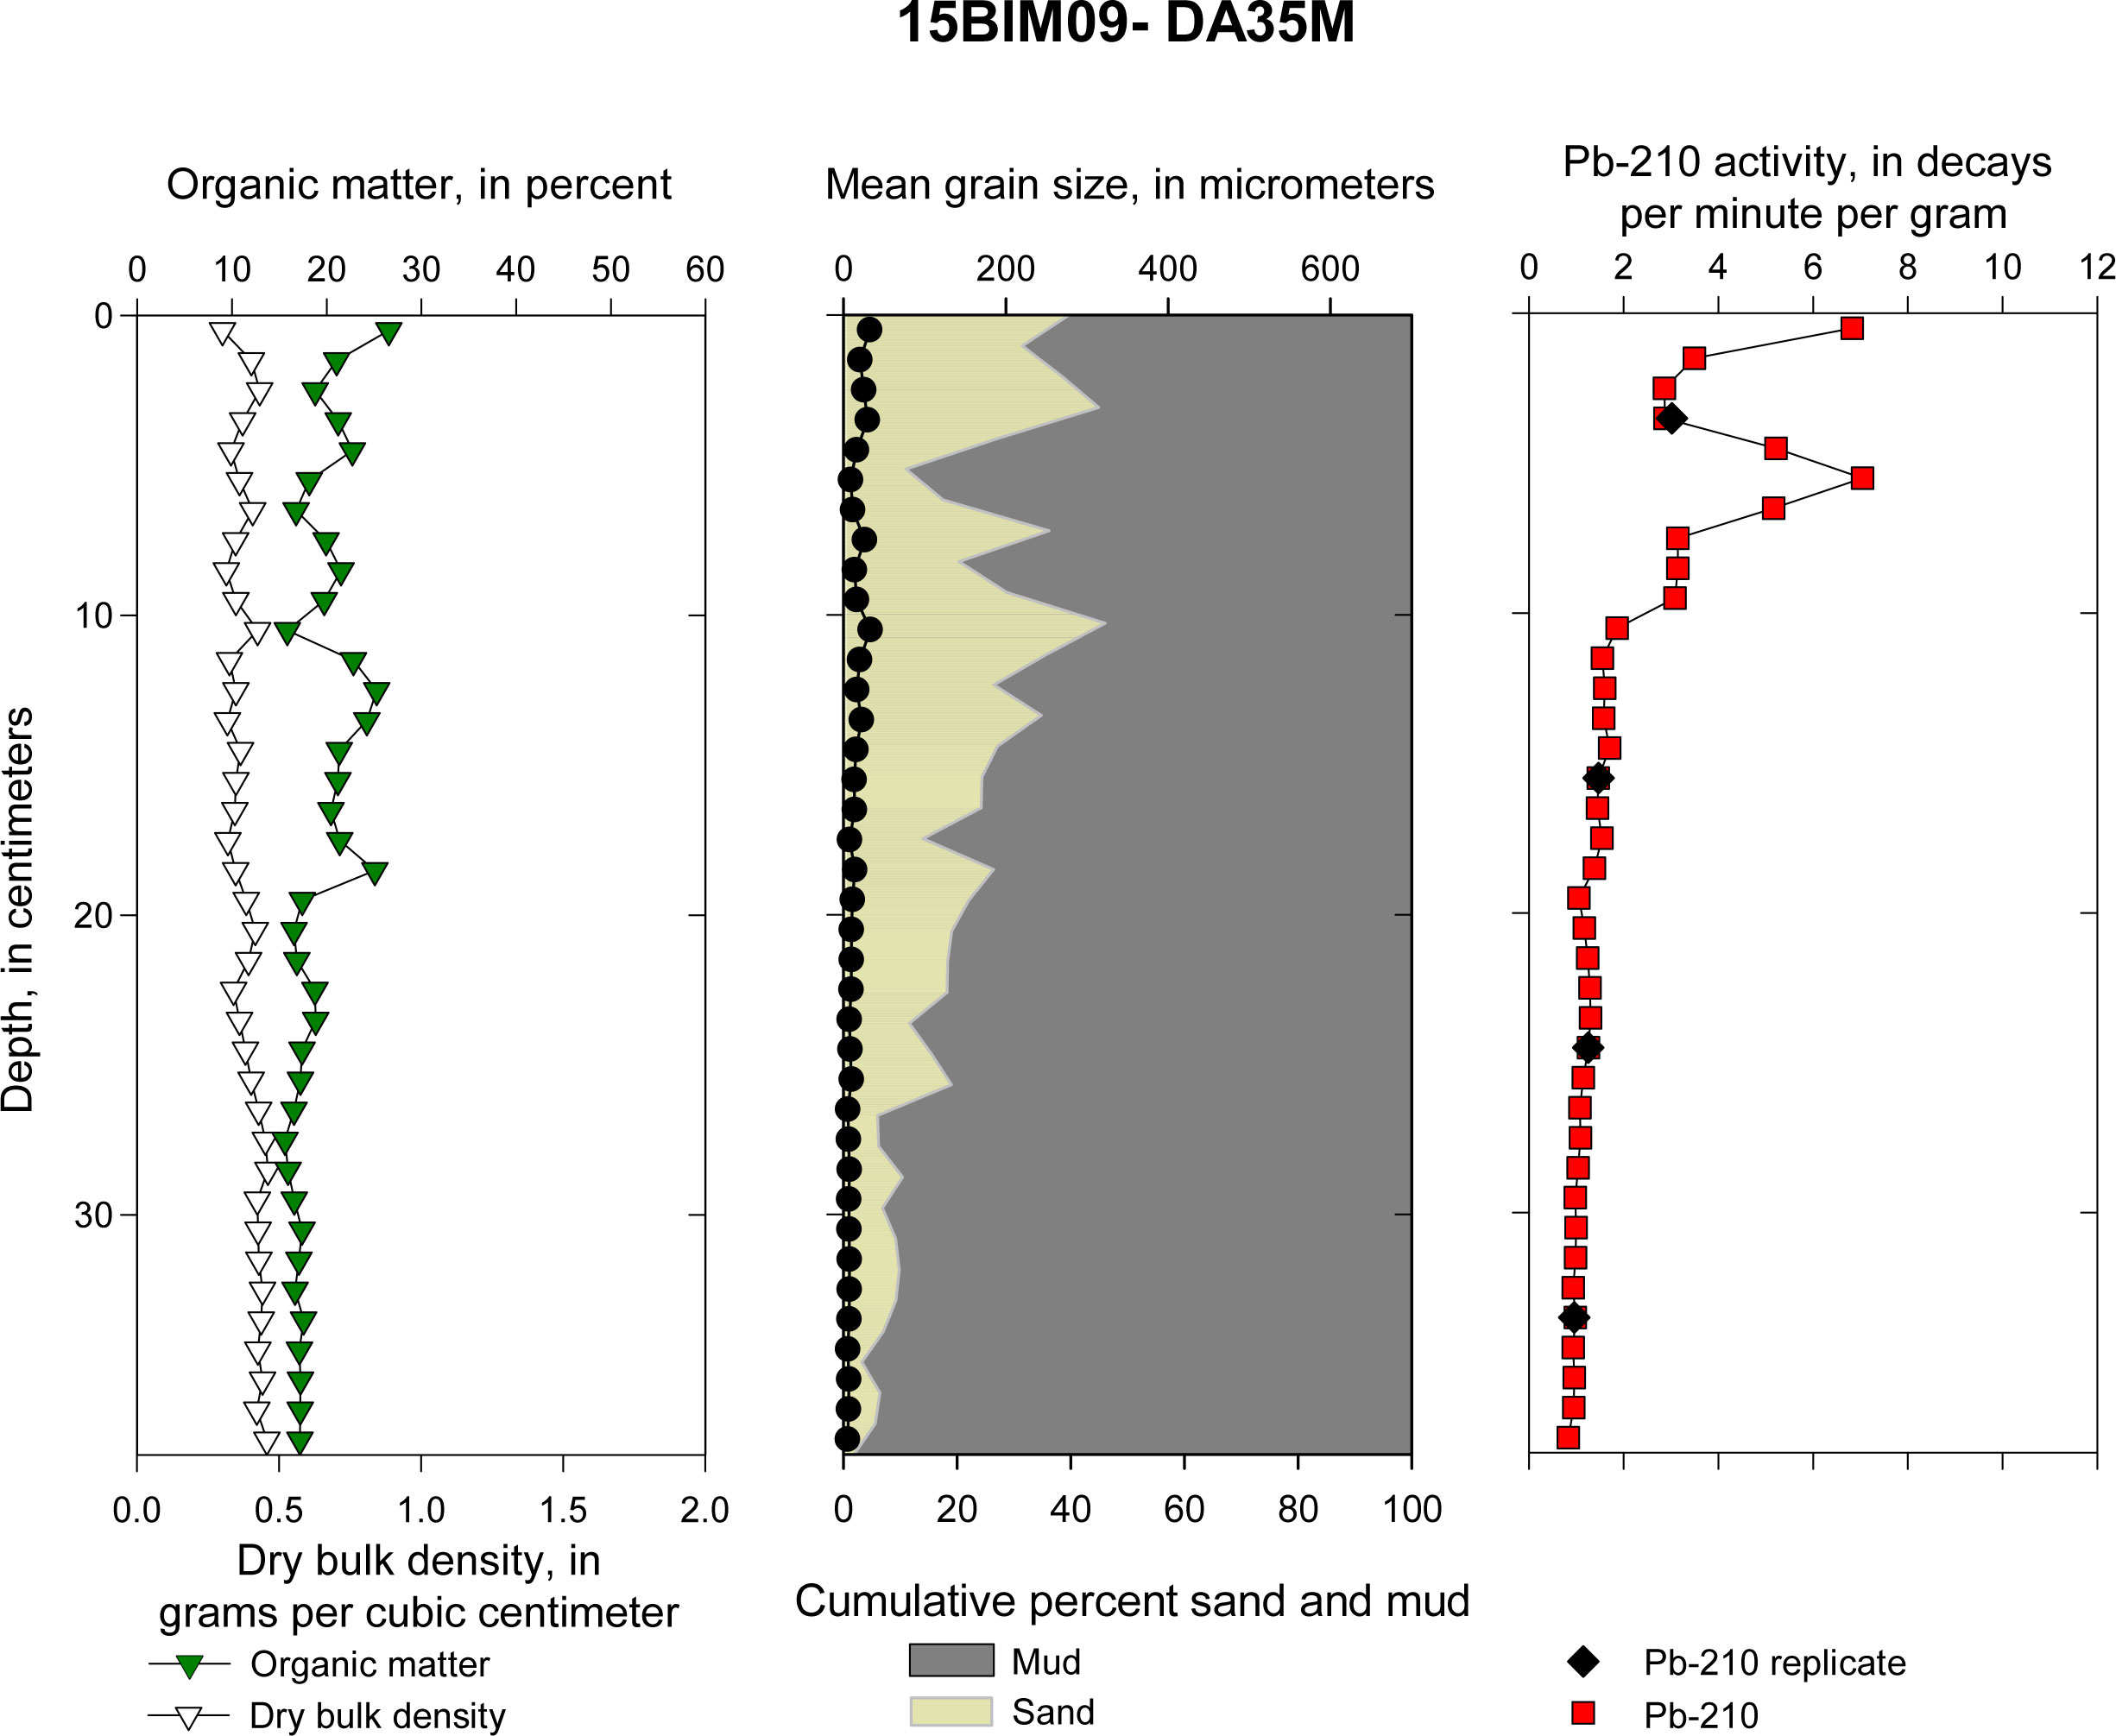 Figure 13. DA35M: D Down-core plots of sediment parameters (dry bulk density and organic matter), sediment texture (percent sand, percent mud, and mean grain size), and total extracted Pb-210 activity with sample replicates. 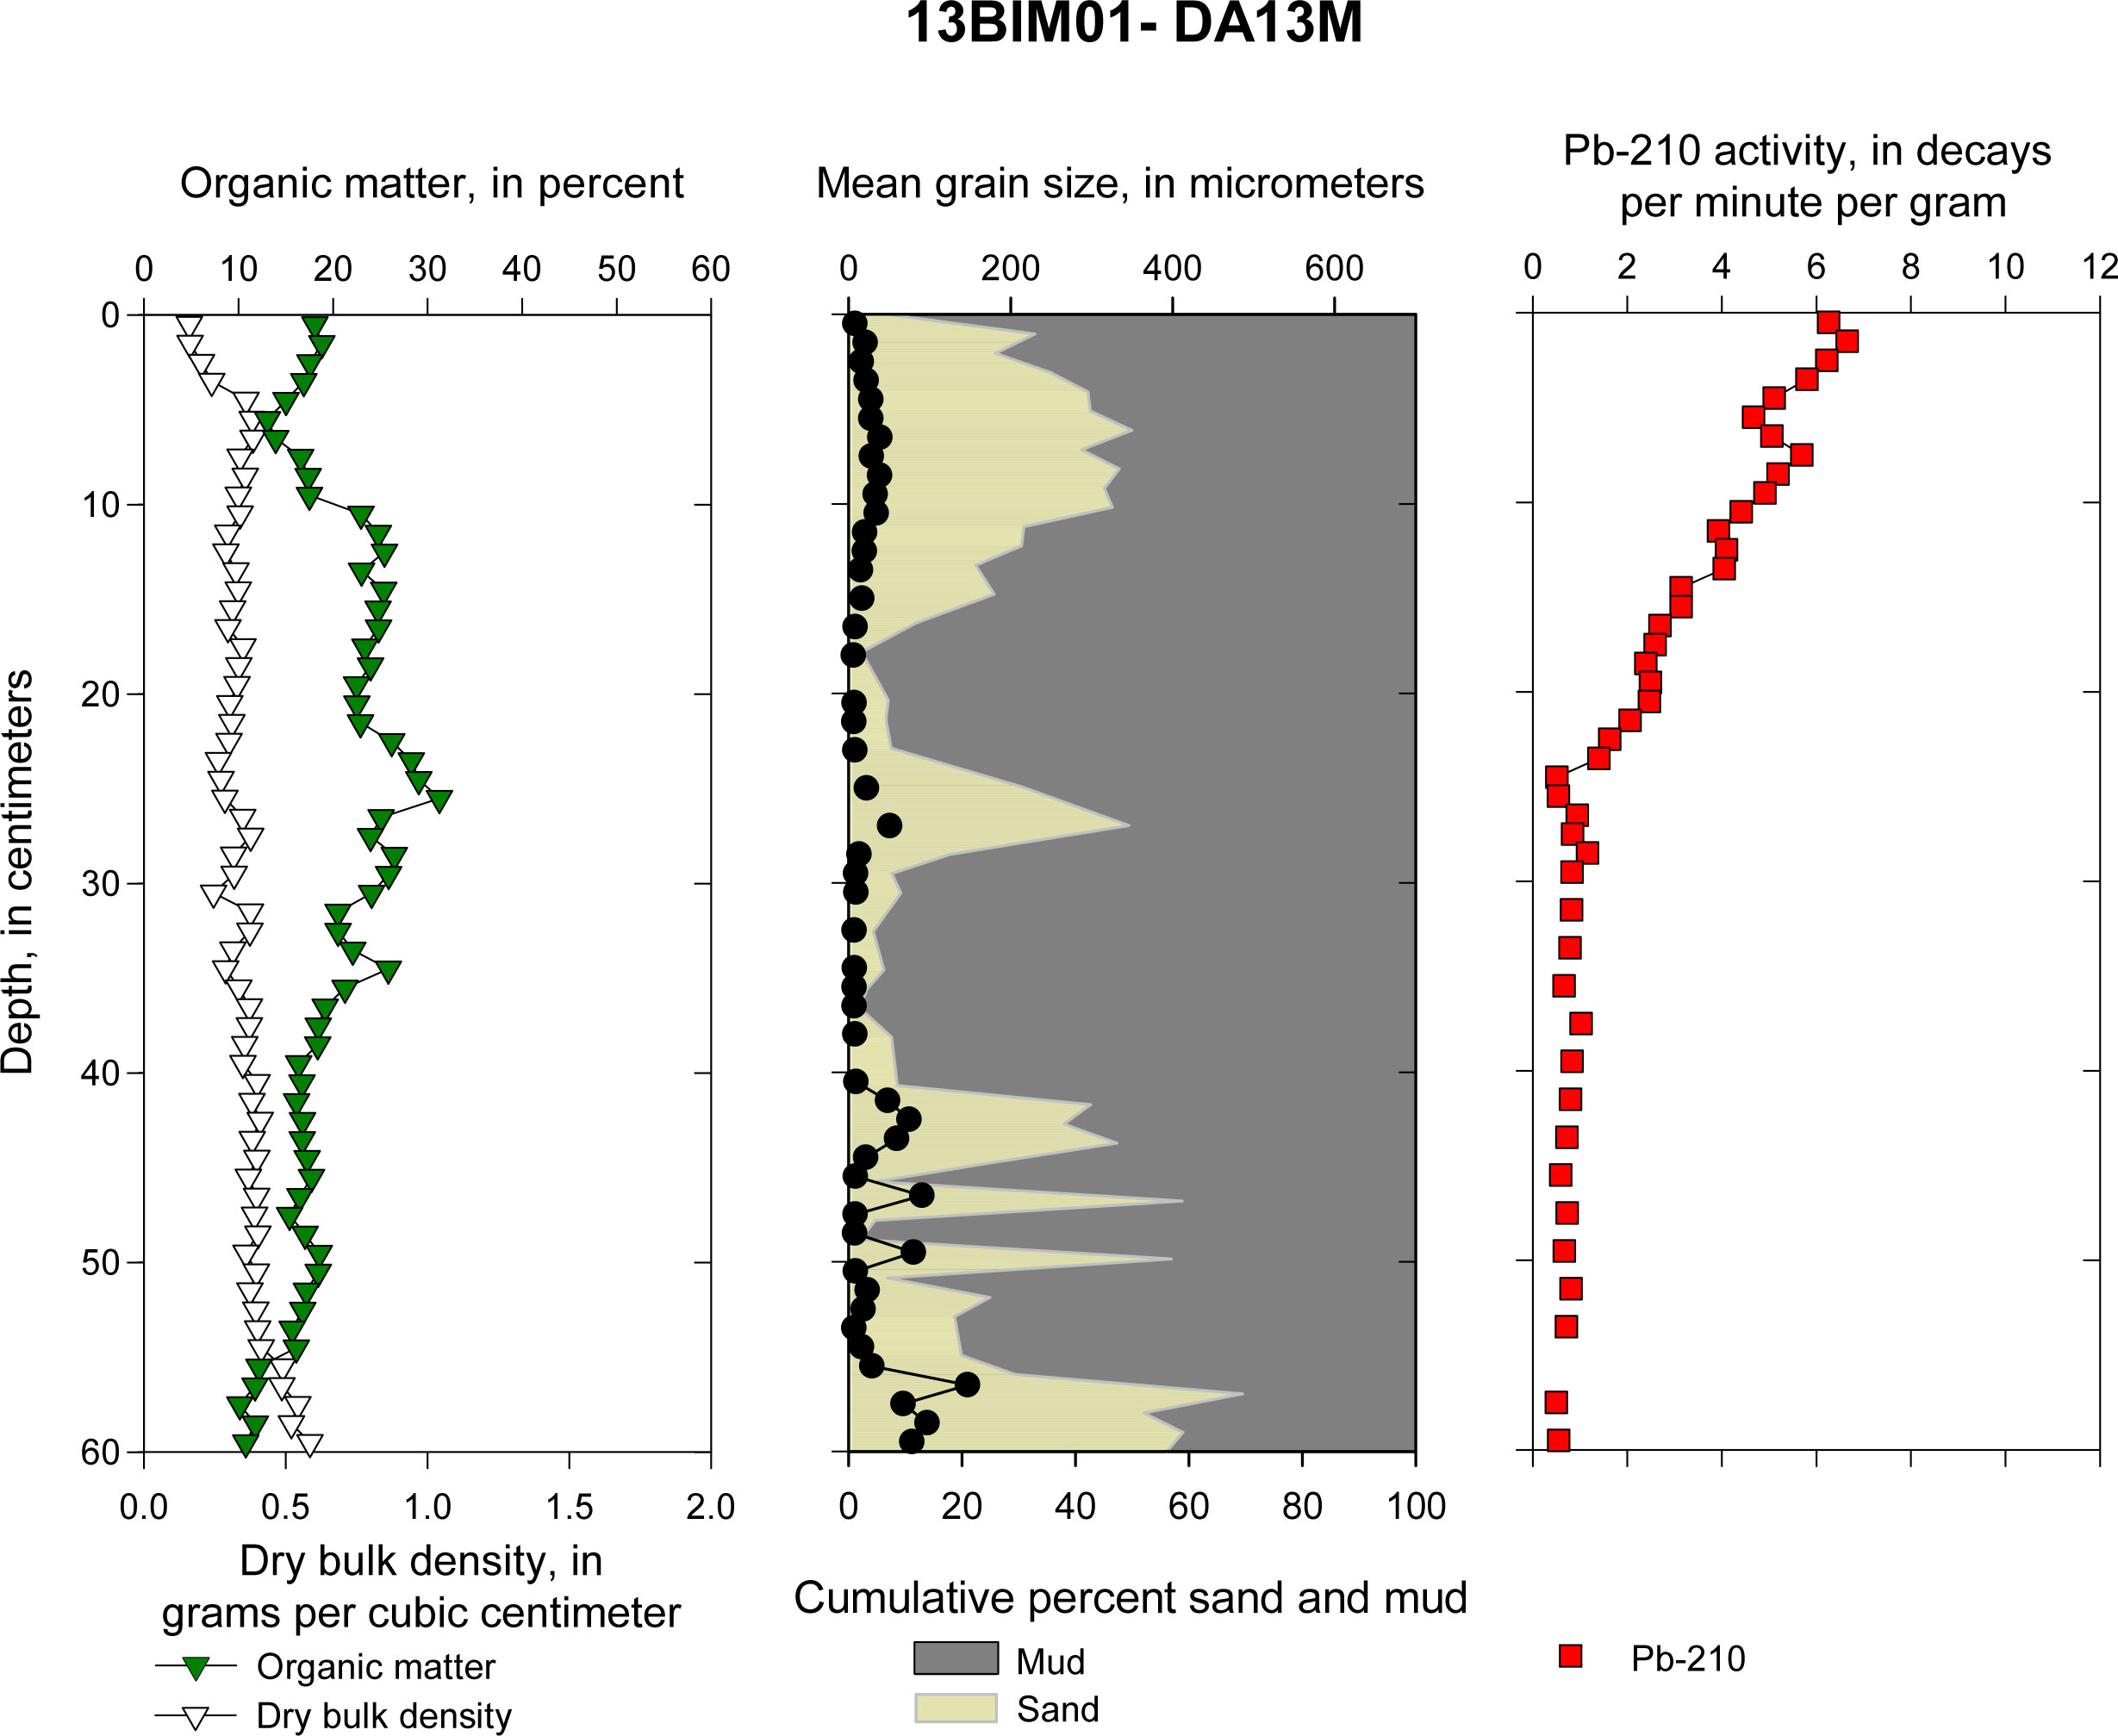 Figure 14. DA13M: Down-core plots of sediment parameters (dry bulk density and organic matter), sediment texture (percent sand, percent mud, and mean grain size), and total extracted Pb-210 activity. 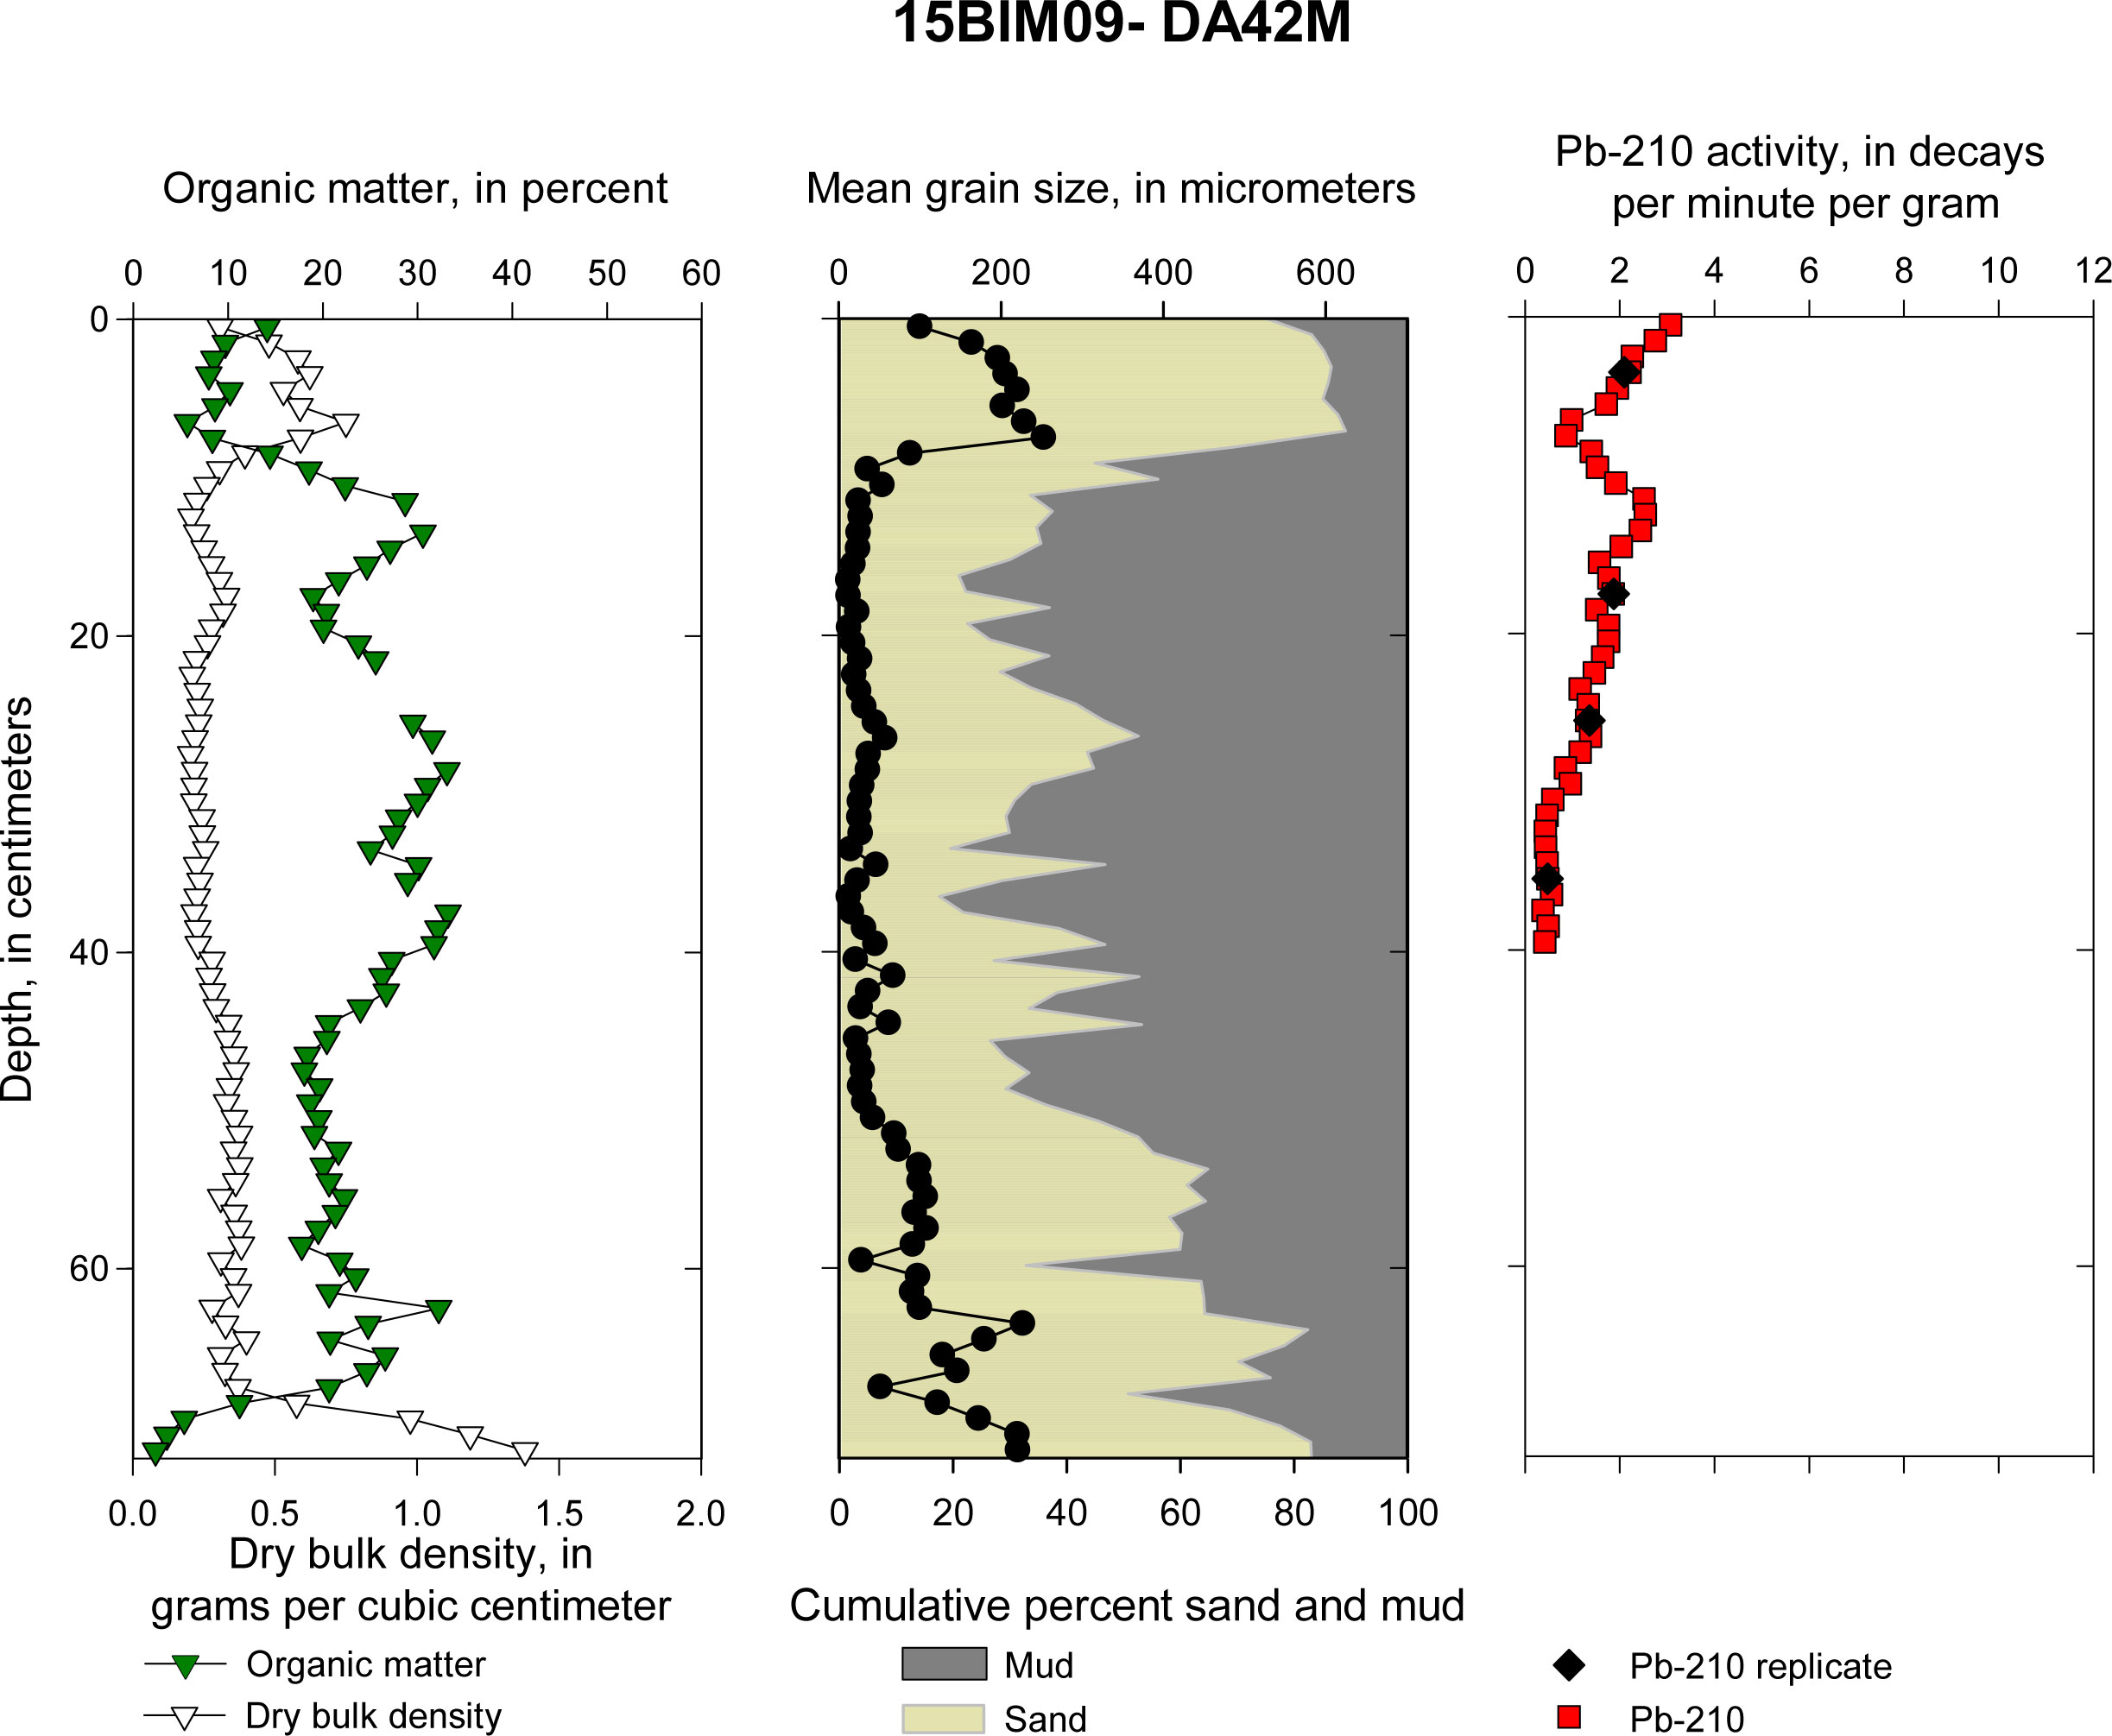 Figure 15. DA42M: Down-core plots of sediment parameters (dry bulk density and organic matter), sediment texture (percent sand, percent mud, and mean grain size), and total extracted Pb-210 activity with sample replicates. 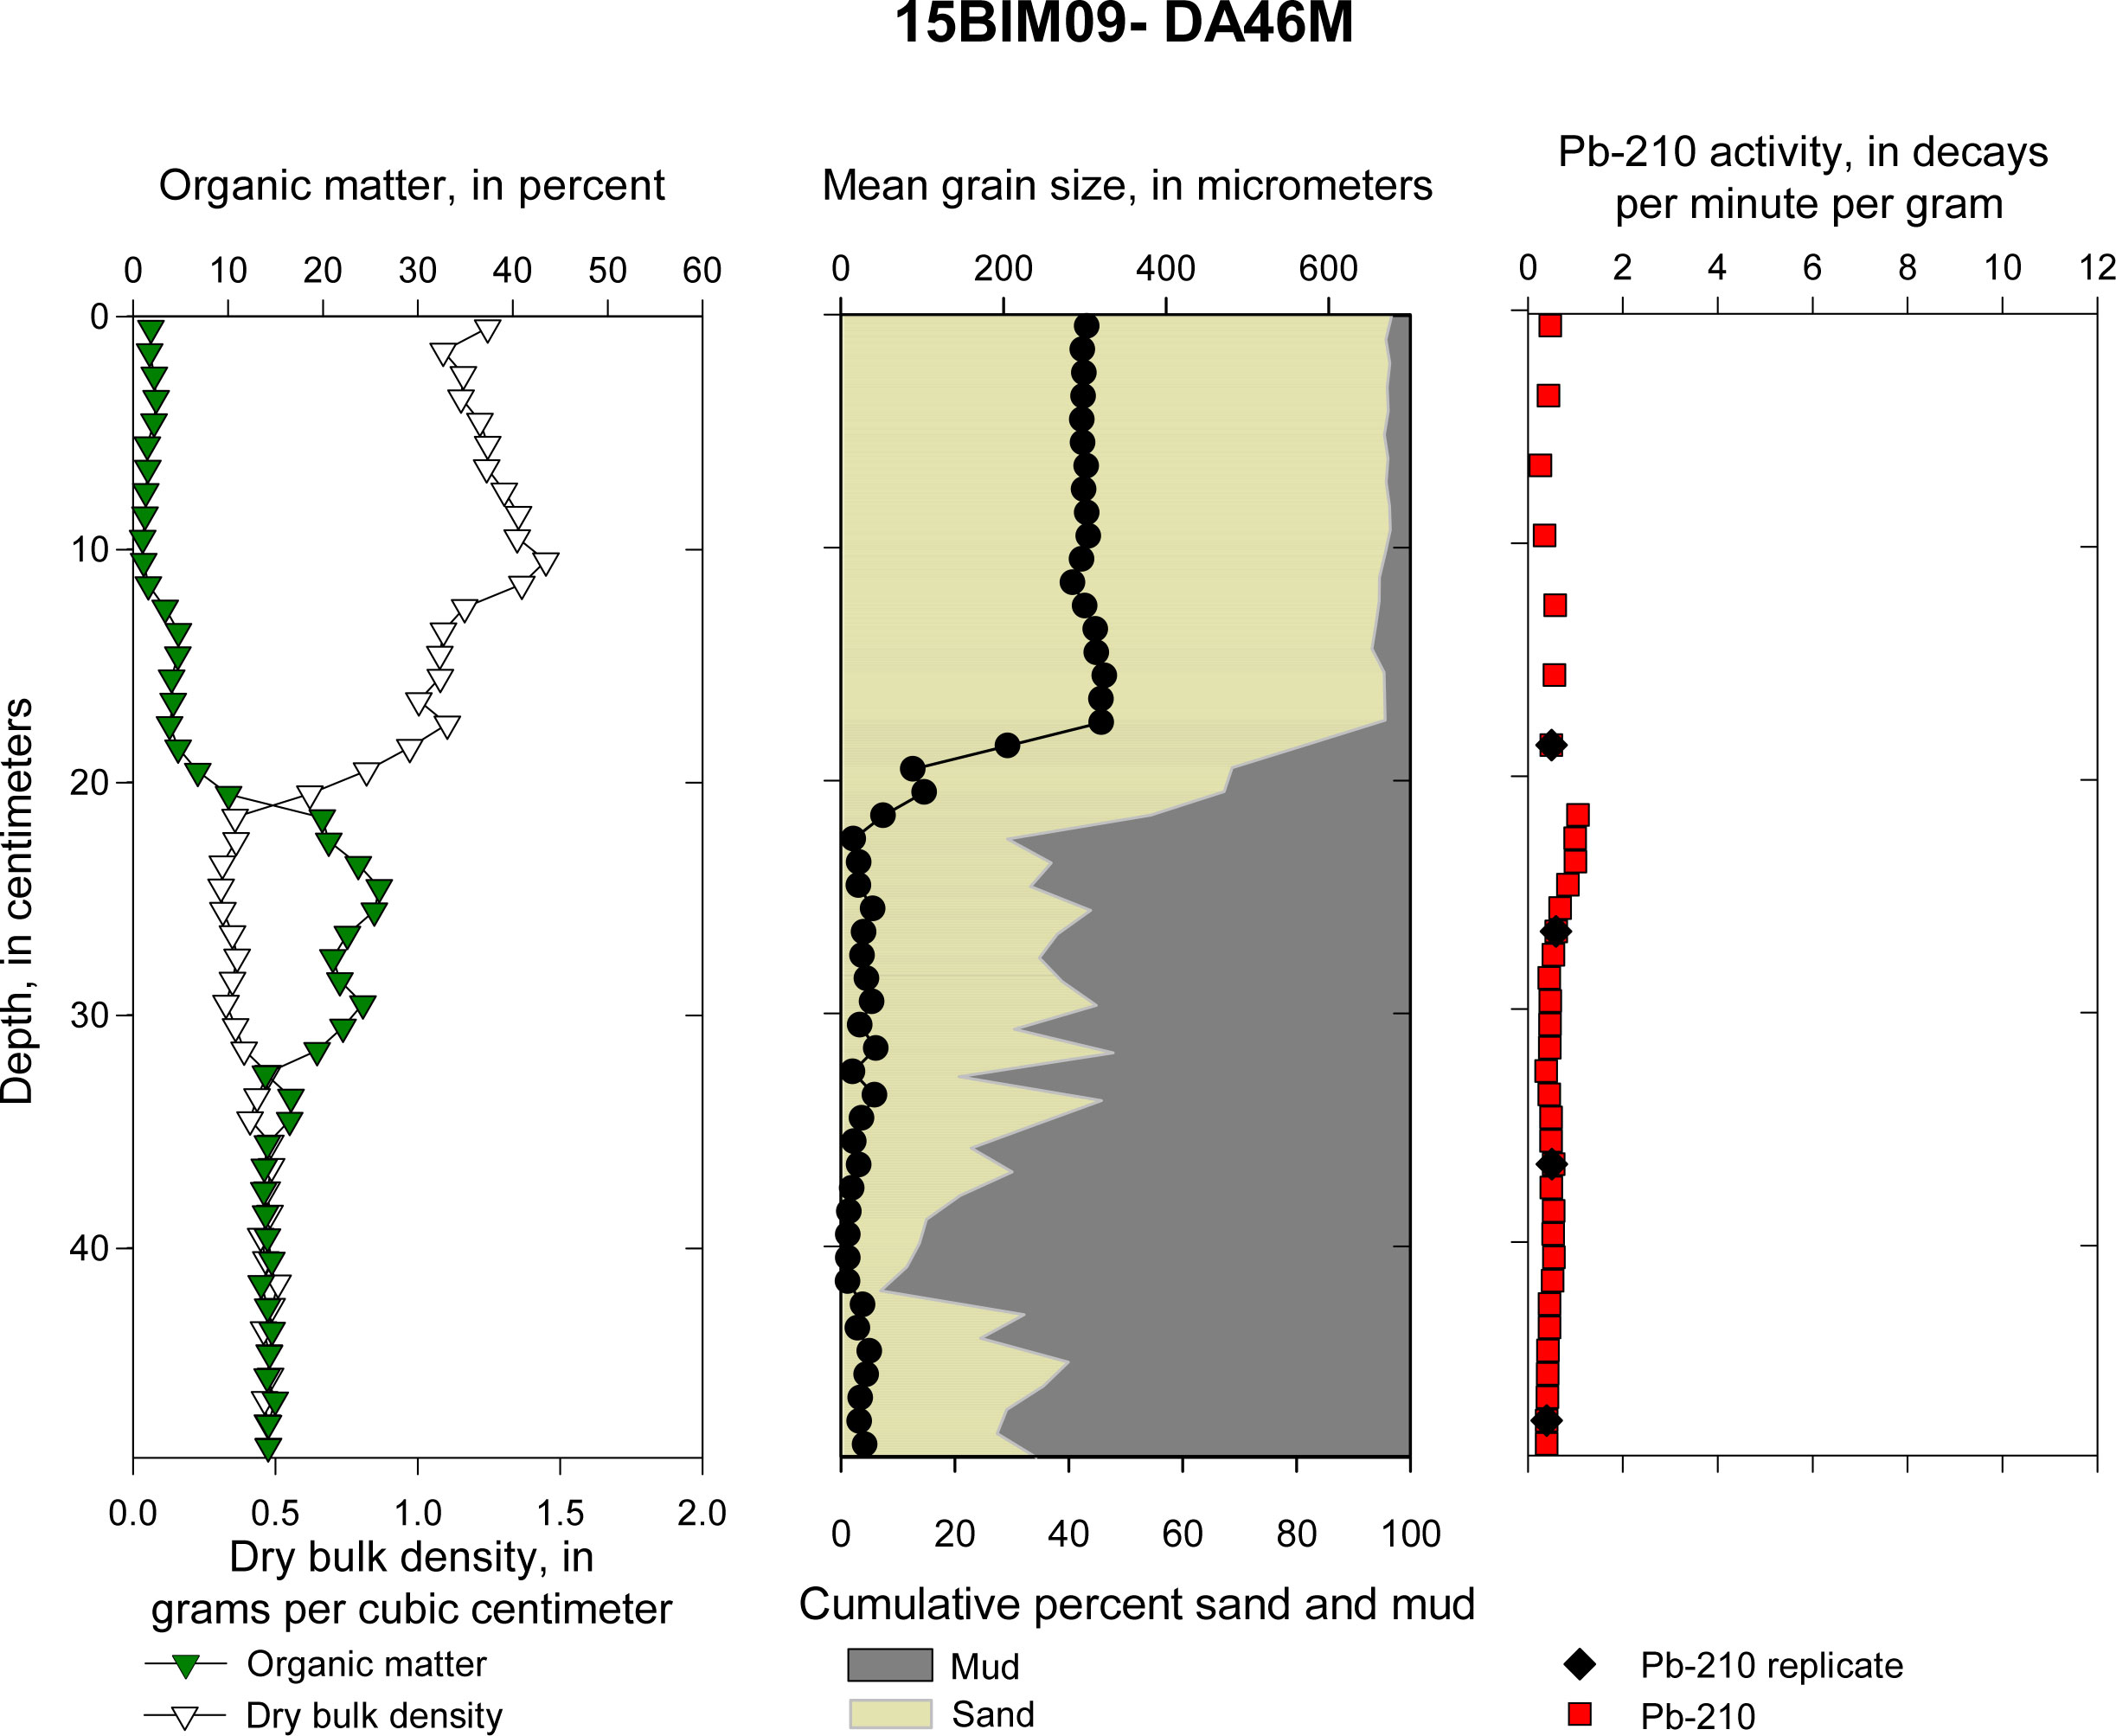 Figure 16. DA46M: Down-core plots of sediment parameters (dry bulk density and organic matter), sediment texture (percent sand, percent mud, and mean grain size), and total extracted Pb-210 activity with sample replicates. 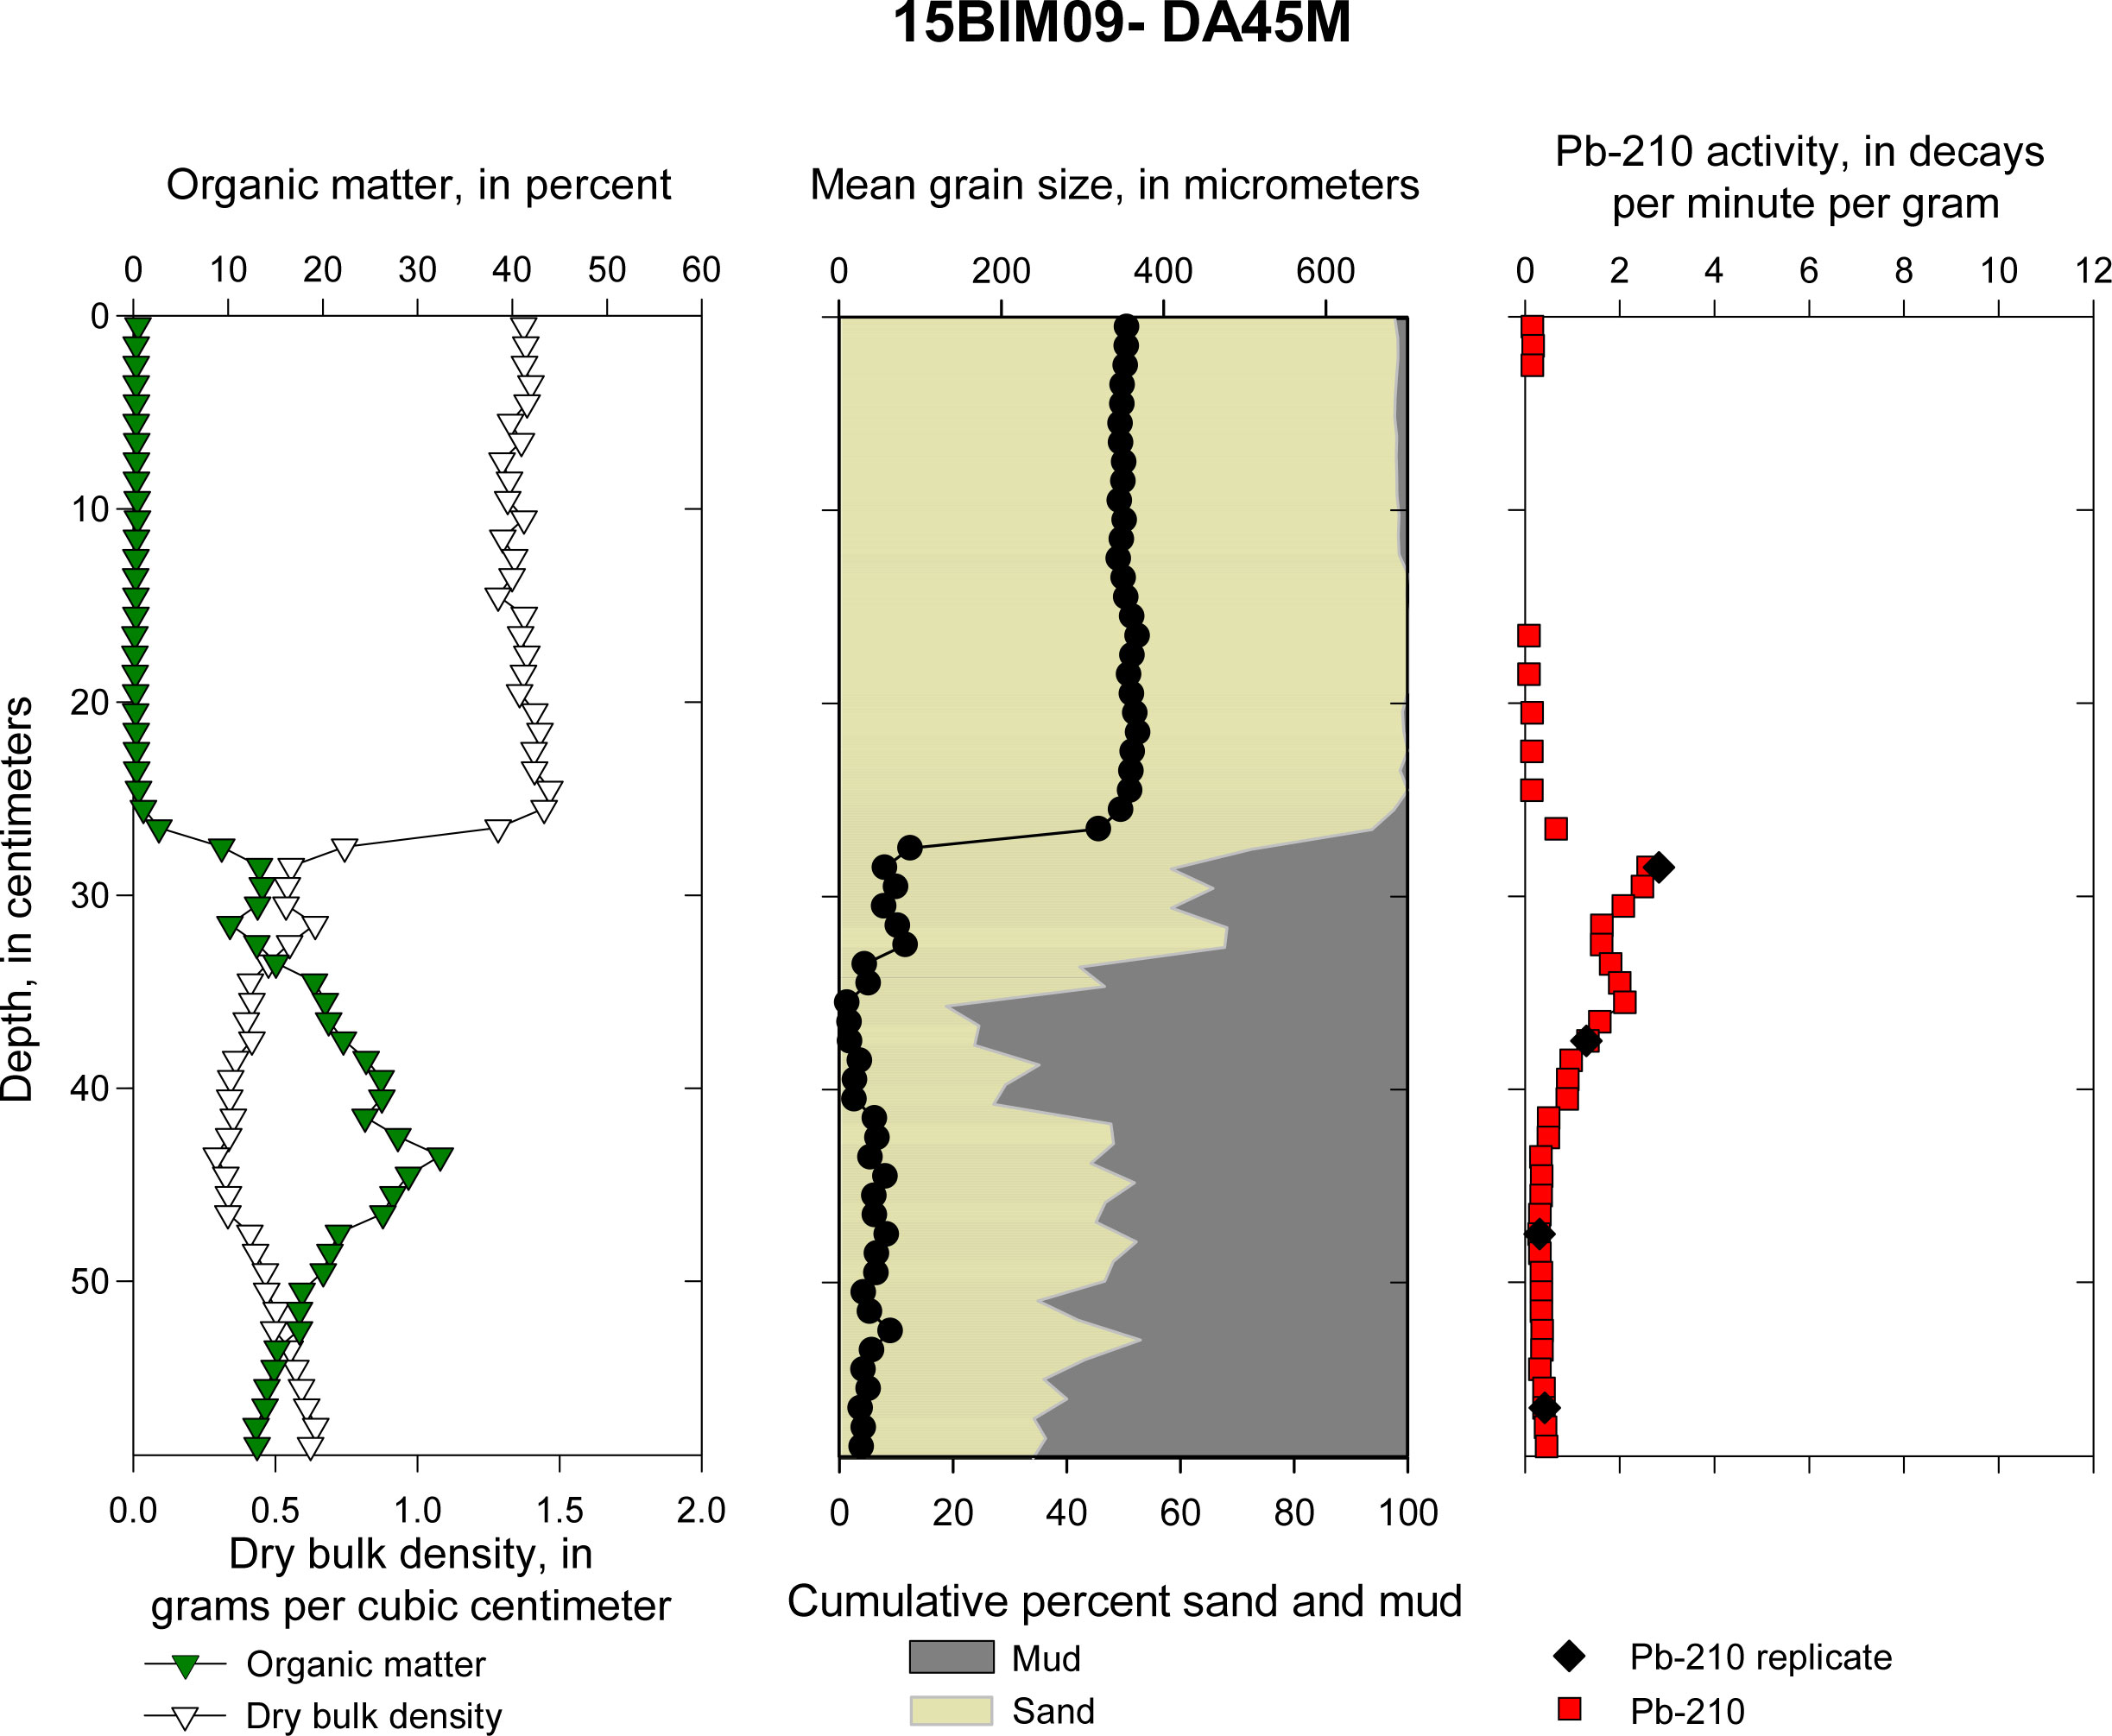 Figure 17. DA45M: Down-core plots of sediment parameters (dry bulk density and organic matter), sediment texture (percent sand, percent mud, and mean grain size), and total extracted Pb-210 activity with sample replicates. 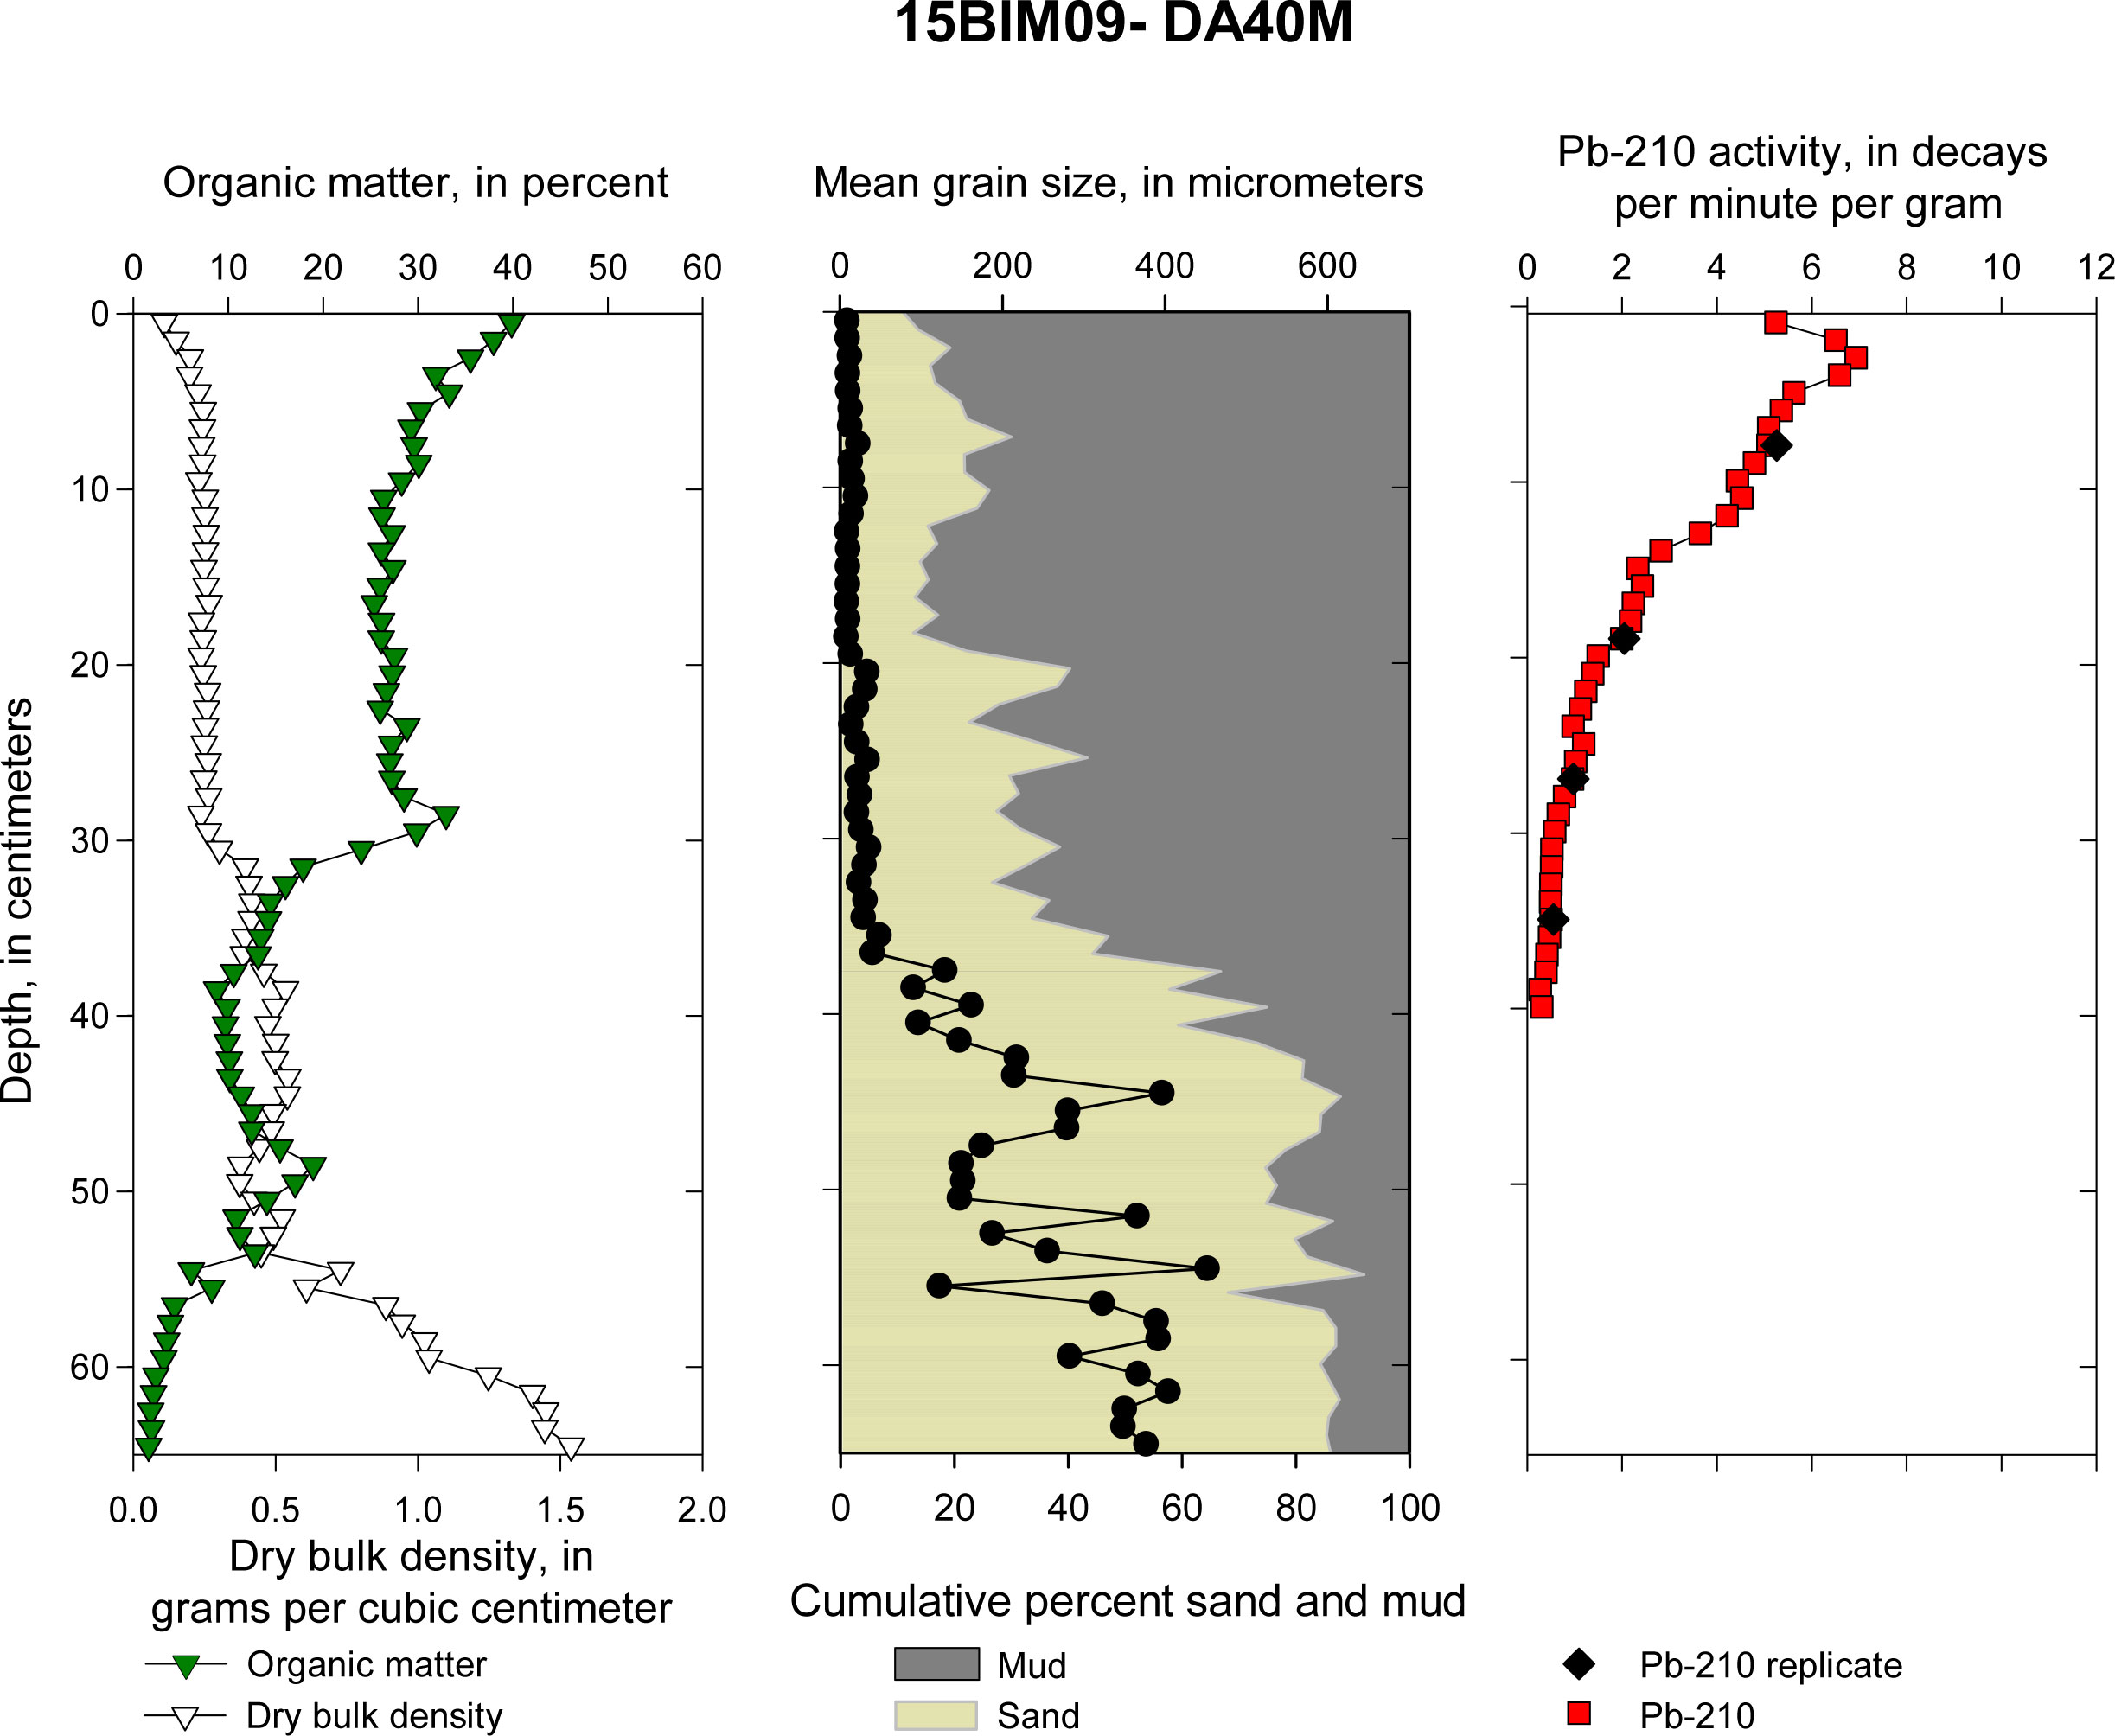 Figure 18. DA40M: Down-core plots of sediment parameters (dry bulk density and organic matter), sediment texture (percent sand, percent mud, and mean grain size), and total extracted Pb-210 activity with sample replicates. 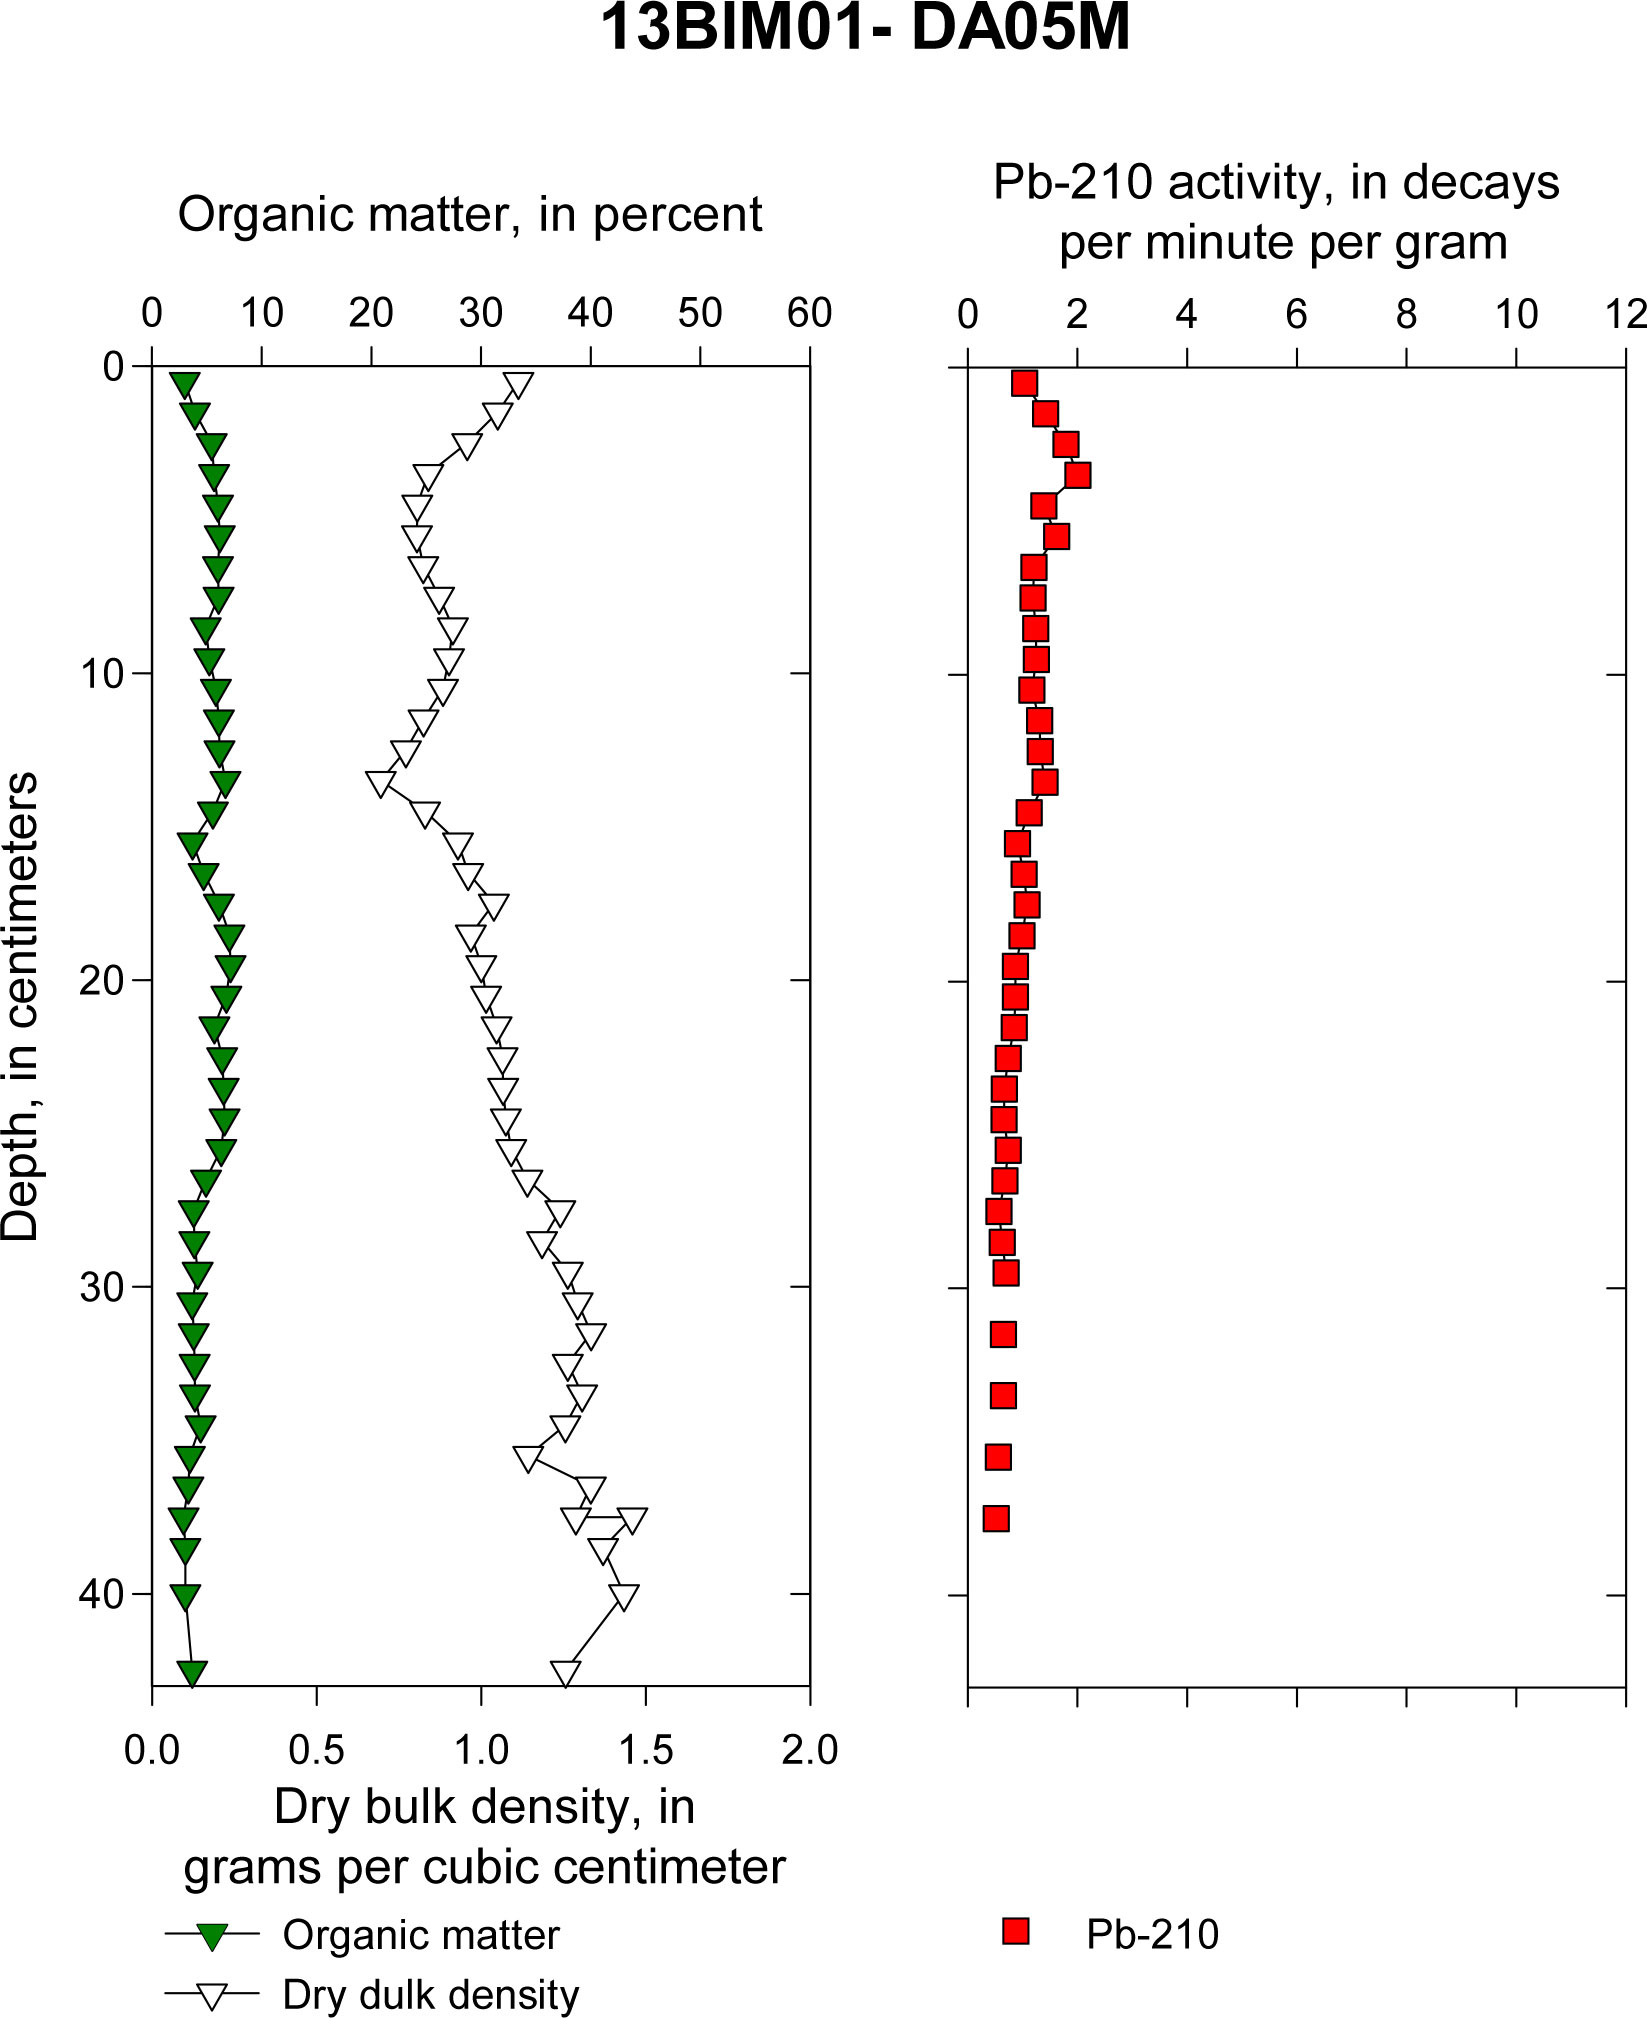 Figure 19. DA05M: Down-core plots of sediment parameters (dry bulk density and organic matter) and total extracted Pb-210 activity. 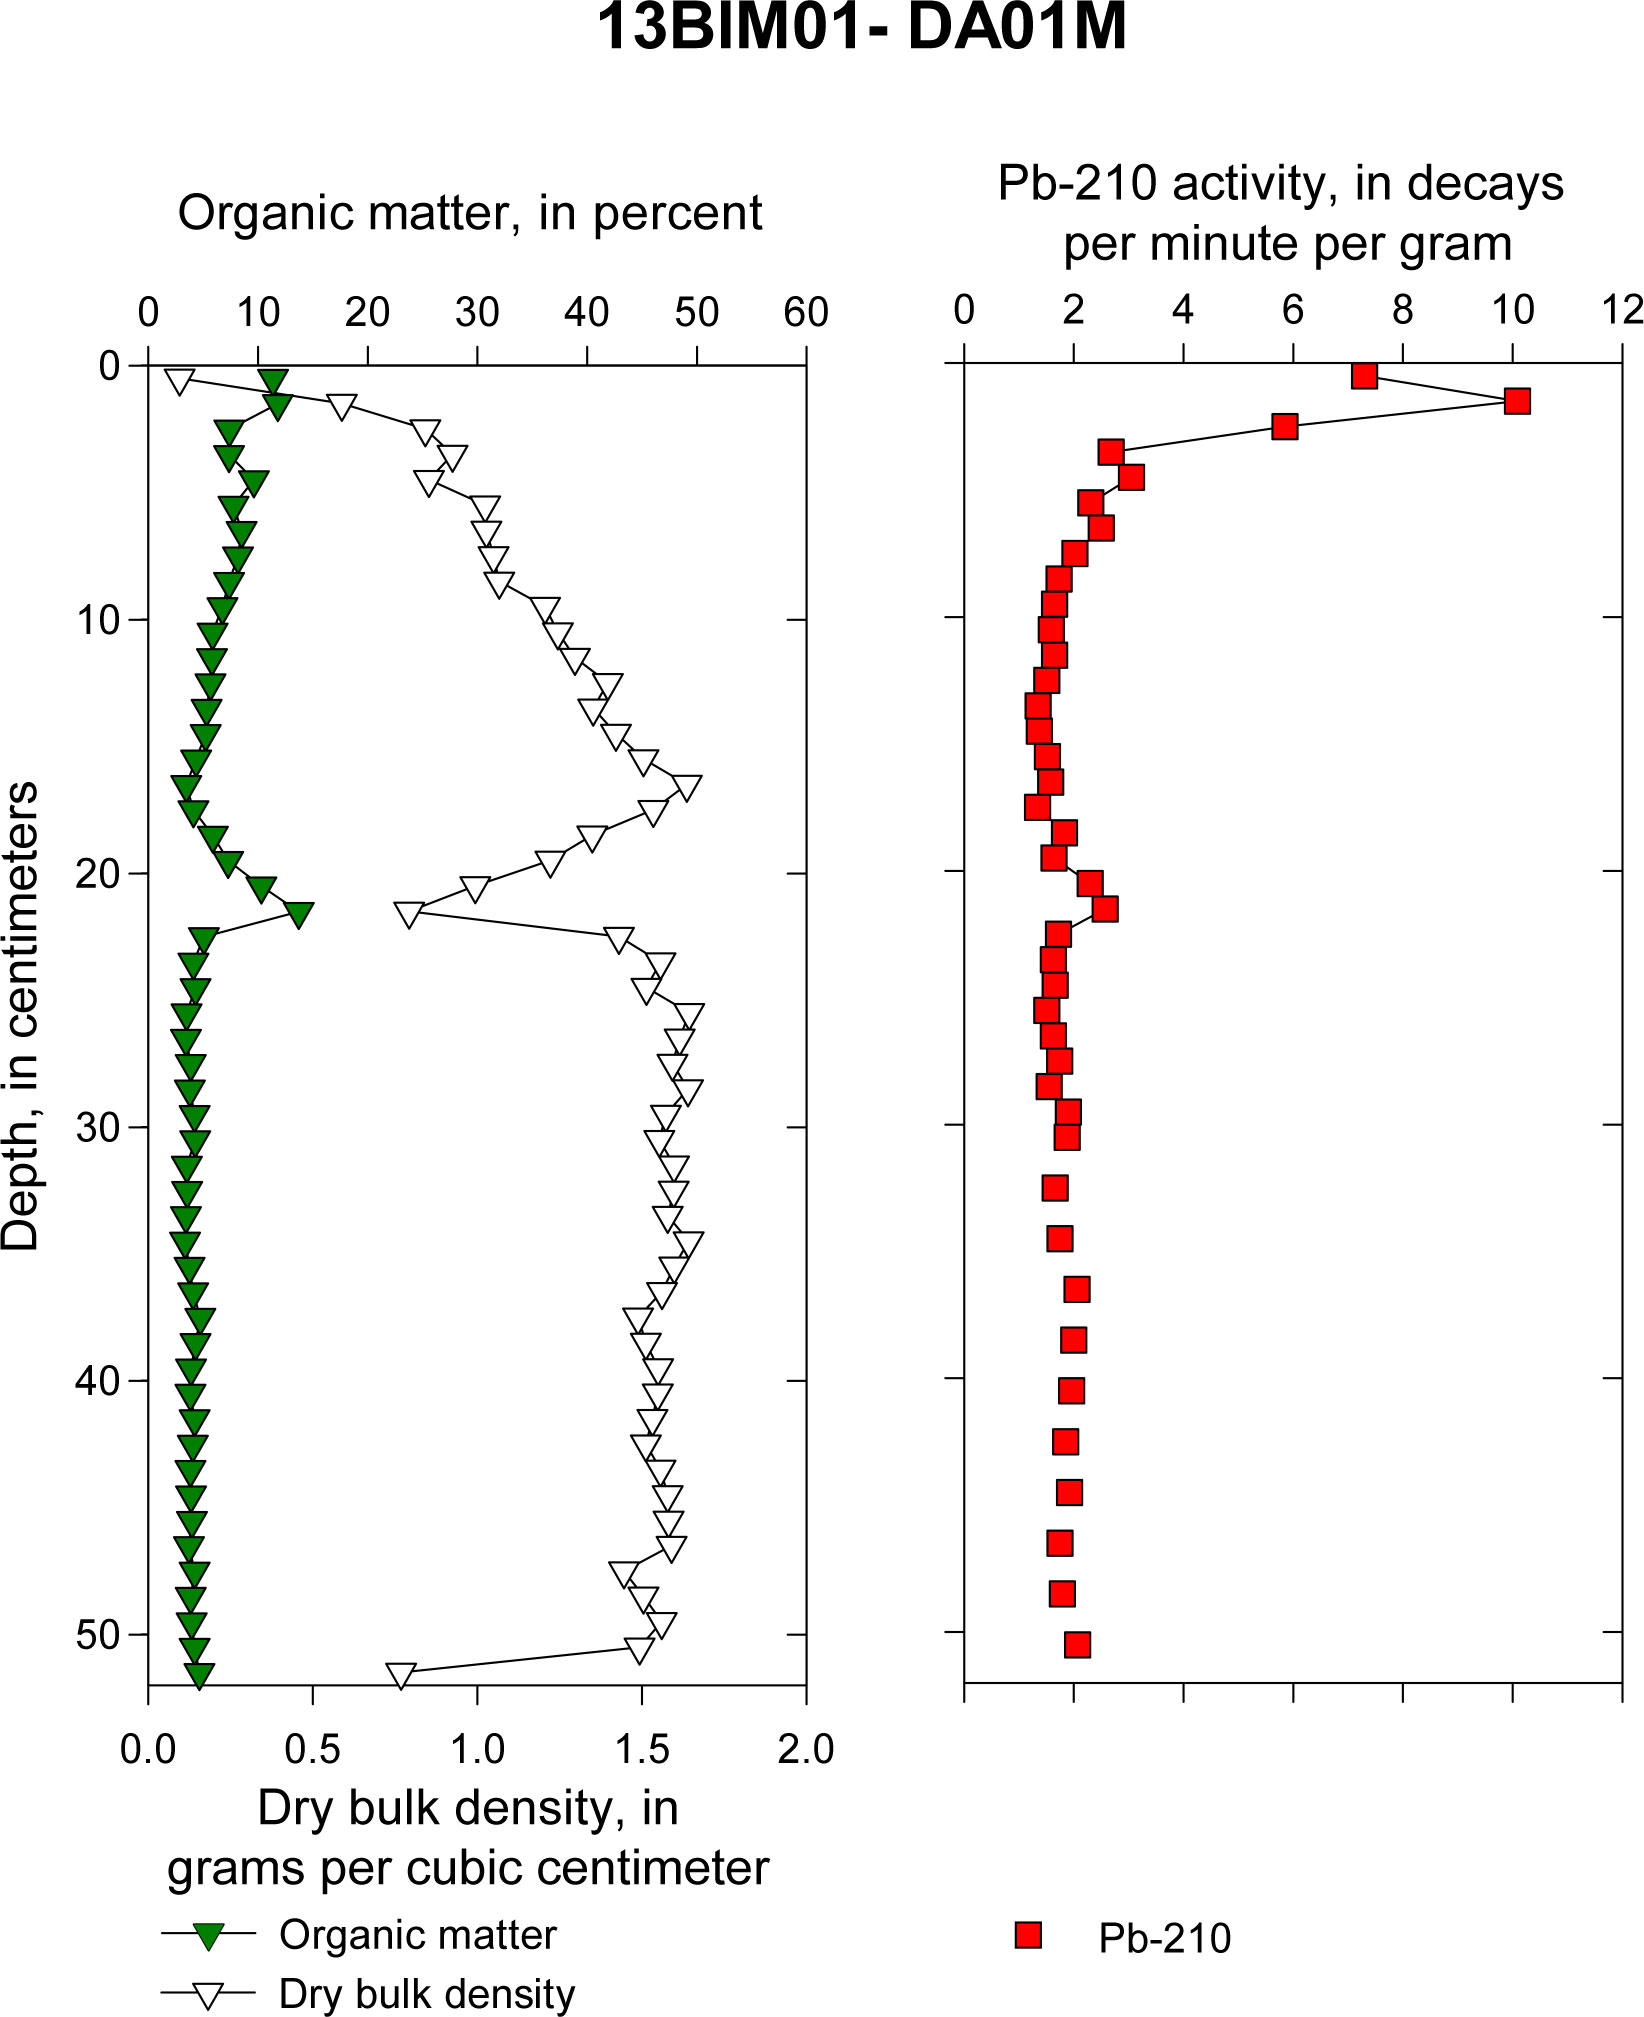 Figure 20. DA01M: Down-core plots of sediment parameters (dry bulk density and organic matter) and total extracted Pb-210 activity. Cores DA30M and DA33M, the northernmost cores in transects 1 and 2, respectively, are located closest to the sandy shoreface and contain the greatest percentage sand throughout (averages of 74.4 percent and 86.0 percent, respectively) (figs. 5 and 6). These cores, along with intermediary DA04M and DA27M from transect 1, and DA34M from transect 2, exhibit a bulk density of approximately 1.3 g/cm3 with a minimal amount of OM (<2 percent at all sites, except DA30M) at the base (figs. 5–9). These properties indicate that at the base of these cores is a sandy substrate similar to what is currently found on the northeast shoreface of Little Dauphin Island. In comparison, the southernmost cores from transect 1 [DA31M(A), DA31M(B), and DA32M] and transect 2 (DA35M) all have a bulk density of approximately 0.5 g/cm3 at the base of the core and are dominated by mud throughout (figs. 10–13). All cores collected from transect 1 and transect 2 generally decrease in bulk density up core and increase in OM from bottom to top, indicating the emergence of the organic-rich marsh unit that is currently present at the sites (figs. 5–13). However, trends in grain size up core are more variable in transect 1 than those in transect 2. Regarding transect 1, the top 30 cm of intermediary DA27M has the finest grain size and greatest percentage mud (average mean grain size 4.6±0.4 μm, fine silt) of all cores (fig. 7). It also has the greatest depth-integrated 210Pb inventory of all cores (55.2±3.4 dpm/cm2), which is likely a result of its close proximity to the marsh edge and regular inundation, which provides a nonatmospheric supply of 210Pb via the decay of 226Ra and radon-222 (222Rn) dissolved in the water column (table 1). Nearby DA04M, which does not have any grain-size data, has the second highest depth-integrated 210Pb inventory and highest total surface activity of all samples (38.6±2.9 dpm/cm2 and 10.17±0.66 dpm/g, respectively) (table 1). Replicate cores DA31M(A) and DA31M(B) were collected a couple meters apart in a Spartina alterinflora and Spartina-Juncus mixed marsh and have the lowest MARs for both method 1 and compaction corrected method 2 (0.055±0.002 grams per square centimeter per year [g/cm2/y] and 0.067±0.005 g/cm2/y, respectively) (table 2). In contrast to most cores on the island, DA32M, furthest south, exhibits an increase in percentage sand from bottom to top, potentially indicating an estuarine or aeolian influence (fig. 12). The sediment cores from transect 2 exhibit a north-to-south gradient from sand dominant (DA33M) to mud dominant (DA35M), with intermediary DA34M more transitional, with an apparent increase in percentage mud and OM from bottom to top (figs. 6, 13, and 9). Northernmost core DA33M was collected from a high marsh dominated by Juncus sp. and is the least organic of the cores collected and yields the highest MAR for method 1 (0.532±0.087 g/cm2/y) and the second highest MAR for compaction corrected method 2 (0.564±0.085 g/cm2/y) among all cores (table 2). Core DA34M exhibits slightly higher MARs and LSRs than DA35M and has a greater depth-integrated 210Pb inventory (22.5±1.4 dpm/cm2) than DA33M or DA35M (tables 1 and 2). To the south, cores DA34M and DA35M, collected in Spartina marshes, have LSRs and MARs that are half the rate (or less) as those calculated for DA33M for both method 1 (DA34M LSR 0.243±0.054 cm/y, MAR 0.238±0.038 g/cm2/y; DA35M LSR 0.201±0.025 cm/y, MAR 0.075±0.007 g/cm2/y) and compaction corrected method 2 (DA34M LSR 0.239±0.038 cm/y, MAR 0.231±0.031 g/cm2/y; DA35M LSR 0.296±0.026 cm/y, MAR 0.110±0.009 g/cm2/y) (table 2).
Table 1. The supported lead-210 activity and depth integrated lead-210 inventory for each core collected in 2013 and 2015.
*M, Marsh push core; A, first sample collected; B, second sample collected at the same site. The Back-Barrier Marshes Surrounding Graveline BayTransect 3, comprised of cores DA45M, DA46M, DA42M, and DA13M (south to north), were chosen to assess the partially submerged Spartina marsh island located between Graveline Bay and Dauphin Island and the impact and recovery of a potential washover deposit of well-sorted, symmetrical, medium sand (mean grain size 352.9±9.5 μm at site DA45M, 0–27 cm) (figs. 2, and 14–17). With the exception of the sandy washover unit present at the top of cores DA45M (0–27 cm), DA46M (0–18 cm), and DA42M (0–8 cm) to a lesser extent, the cores are largely comprised of poorly sorted sandy mud with an average grain size of very coarse silt (41.7±19.6 μm, 35.4±37.7 μm, and 59.9±54.0 μm, respectively) (figs. 14–16). The base of core DA46M (35–49 cm) is defined by a steady OM content of 14.2 percent ± 0.4 percent with a mean grain size of 19.9±9.0 μm (coarse silt), similar to the less-defined base of nearby core DA45M (54–59 cm) characterized by an average OM content of 13.8 percent ± 0.8 percent with a mean grain-size of 29.9±3.8 μm (coarse silt). Both cores increase in OM initially, following the base unit and subsequently decrease, indicating a change to a more clastic sediment source prior to the washover deposit (figs. 14 and 15). The MAR calculated for core DA45M below the washover deposit yielded the highest rate for compaction corrected method 2 of 0.606±0.093 g/cm2/y among all cores, though no LSR or MAR could be calculated for DA46M (table 2). Core DA42M, which is more centrally located on the island, exhibits a fining upward sequence, which generally corresponds with an increase in OM from the base up to 11 cm near the base of the sandy washover deposit (8 cm) and possesses the greatest LSR of all sites on the island of 0.446±0.087 cm/y and 0.539±0.058 cm/y for method 1 and compaction corrected method 2, respectively(fig. 16 and table 2). Core DA13M, located on the northern face of the marsh island, steadily increased in percent OM from the base (10.8 percent) to 28.5 cm (26.5 percent), after which OM decreased up core with multiple fluctuations. The shift in OM corresponds with an increase in percent sand that tapers off at the top of the core, potentially indicating an increased estuarine influence at that site (fig. 17). For comparison with the marsh island on the southern side of Graveline Bay, DA40M was collected from a dominantly Spartina marsh on the eastern side of Graveline Bay closest to the airport (fig. 2). The base unit (56–65 cm) is a low-organic (2.7 percent), poorly sorted, very finely skewed, medium sand that transitions to a medium silt at 20 cm, analogous to the surface sediment. Percent OM gradually increases up core, maxing out at 39.9 percent at the surface (fig. 18). In comparison with the other Graveline Bay cores, it has an intermediary 210Pb inventory (17.4±0.3 dpm/cm2) and LSRs (0.268±0.017 cm/y and 0.383±0.020 cm/y for methods 1 and 2, respectively), and one of the lowest MARs (0.064±0.003 g/cm2/y and 0.383±0.20 g/cm2/y for methods 1 and 2) (tables 1 and 2). Table 2. The linear sedimentation rates and mass accumulation rates with their respective errors for each core collected in 2013 and 2015. The rates for methods 1 and 2 were calculated using the constant flux constant sedimentation model; method 1 does not incorporate compaction while method 2 does incorporate compaction into the rates.
*M, Marsh push core; A, first core collected; B, second core collected at the same site. The Protected Back-Barrier Marsh Bordering Southern Dauphin Island Bay and the Exposed Audubon Bird Sanctuary Freshwater SwampMarsh core DA05M was collected in a Juncus marsh and is characterized by having the lowest total surface 210Pb activity of all sites (1.04±0.17 dpm/g) though the MARs for method 1 and compaction corrected method 2 (0.415±0.056 g/cm2/y and 0.416±0.056 g/cm2/y, respectively) are greater than the majority of sites around Graveline Bay (except DA45M) and Little Dauphin Island (except DA33M and DA27M) (tables 1 and 2). It exhibits an overall decrease in dry bulk density from the base (1.26 g/cm3) up to 13 cm (0.69 g/cm3), following a general increase to the top of the core from 0.77 to 1.11 g/cm3, a trend similar to that exhibited by DA33M on Little Dauphin Island (figs. 19 and 6). An inverse trend is observed, to a lesser extent, in the OM record down core, indicating a change in sediment source and type at approximately 13 cm depth. Core DA01M from the freshwater swamp, designated as an Audubon Bird Sanctuary on the southern face of Dauphin Island, has the lowest LSRs of 0.105±0.013 cm/y and 0.122±0.014 cm/y of all sites assessed (table 1). Dry bulk density and percent OM are indicative of a sandy base unit, which is relatively constant from the base up to 22 cm depth, at which point there is a dramatic shift in both parameters, followed by a trend of increasing organics and decreasing dry bulk density up core potentially marking the transition from a sandy shoreface to a freshwater swamp following a change in sediment source and type (fig. 20). SummaryTransects 1 and 2, located on Cedar Island and Little Dauphin Island, exhibit a fining upward trend from the sandy shoreline to marsh shoreline, consistent with washover-dominated (unidirectional) sediment transport. Considering the protection Dauphin Island and Little Dauphin Island provide to the back-barrier shore of Dauphin Island and how fetch-limited Dauphin Island Bay and Bayou Aloe are, a unidirectional sediment-transport pattern is logical for Cedar Island and Little Dauphin Island. In contrast, transect 3, on the partially submerged Spartina marsh island between Graveline Bay and Dauphin Island, exhibits sediment textures and accretion rates that favor strong bidirectional sediment inputs. Large storms and anthropogenic activities can transport sediment landward across Dauphin Island and onto these marshes. Meanwhile, frontal storms moving parallel to the island have increased fetch, which can set up large waves in Mississippi Sound and entrain and deposit estuarine sediments onto the marshes. | |||||||||||||||||||||||||||||||||||||||||||||||||||||||||||||||||||||||||||||||||||||||||||||||||||||||||||||||||||||||||||||||||||||||||||||||||||||||||||||||||||||||||||||||||||||||||||||||||||||||||||||||||||||||||||||||||||||||||||||||||||||||||||||||||||||||||||||||||||||||||||||||||||||||||||||||||||||||||||||||||||||||||||||||||||||||||||||||||||||||||||||||||||||||||||||||||||||||||||||

![]() U.S. Department of the Interior |
U.S. Geological Survey
U.S. Department of the Interior |
U.S. Geological Survey
URL: http://pubsdata.usgs.gov/pubs/of/2017/1165/ofr2017-1165_results.html
Page Contact Information: GS Pubs Web Contact
Page Last Modified: Tuesday, 20-Mar-2018 14:22:53 EDT
