

Bathymetric Maps, Surface Areas, and Storage Capacities of Council Grove Lake and Marion Reservoir, Kansas, and Pine Creek Lake, Oklahoma, 2024
Links
- Document: Pamphlet (1.23 MB pdf) , HTML , XML
- Sheets:
- Sheet 1 (10.4 MB pdf) - Multibeam Bathymetric Data and Total Propagated Uncertainty for Council Grove Lake and Marion Reservoir, Kansas, and Pine Creek Lake, Oklahoma, 2024
- Sheet 2 (4.29 MB pdf) - Bathymetric Map, Surface Area, and Storage Capacity for Council Grove Lake, Kansas, 2024
- Sheet 3 (3.13 MB pdf) - Bathymetric Map, Surface Area, and Storage Capacity for Marion Reservoir, Kansas, 2024
- Sheet 4 (8.32 MB pdf) - Bathymetric Map, Surface Area, and Storage Capacity for Pine Creek Lake, Oklahoma, 2024
- Data Release: USGS data release - Bathymetric maps, surface area and capacity of three selected lakes in central Kansas and southeastern Oklahoma, 2024
- NGMDB Index Pages:
- Download citation as: RIS | Dublin Core
Acknowledgments
The authors would like to thank William Chatron, Brian Johnson, Joseph Large, Jordan McQueen, Dylan Oney, and Eric Smith of the U.S. Army Corps of Engineers for initiating and supporting this project with their subject-matter expertise and logistical support.
The authors also thank U.S. Geological Survey colleagues for their contributions to this report. Stephen Bradford, Kyle Cothren, and James Hanlon contributed to data collection and surveying.
Abstract
The U.S. Geological Survey, in cooperation with the U.S. Army Corps of Engineers, completed high-resolution multibeam bathymetric surveys to compute new elevation-area-capacity tables for Council Grove Lake and Marion Reservoir, Kansas, and Pine Creek Lake, Oklahoma. Elevation-area-capacity tables identify the relation between the water-surface elevation, surface area, and storage capacity of the lake. The surface areas and storage capacities of each lake were computed from bathymetric surfaces combining multibeam echo sounder data collected in 2024 and light detection and ranging point-cloud data collected in 2016 and 2018.
Introduction
Elevation-area-capacity relations, which are constructed from bathymetric survey data, are used to identify the surface area and storage capacity of a lake at any given water-surface elevation (Wilson and Richards, 2006). Accurate knowledge of the elevation-area-capacity relation is critical for managing the daily water-supply, flood-control, recreation, or water-quality operations of a lake (U.S. Army Corps of Engineers [USACE], 2013). Elevation-area-capacity relations also may either be used to assess reductions in lake capacity caused by sediment and debris deposition primarily from tributaries draining into a lake (Hunter and others, 2020) or to analyze sediment deposition patterns (Huizinga and Heimann, 2018).
The USACE periodically updates elevation-area-capacity relations for USACE-managed lakes. The USACE is seeking updated elevation-area-capacity tables for Council Grove Lake and Marion Reservoir, Kansas, and Pine Creek Lake, Oklahoma (fig. 1; USACE, 2013). During July–September 2024, the U.S. Geological Survey (USGS), in cooperation with the USACE, conducted bathymetric surveys of Council Grove Lake, Marion Reservoir, and Pine Creek Lake and used data from those surveys to generate updated bathymetric maps and elevation-area-capacity tables for each lake.
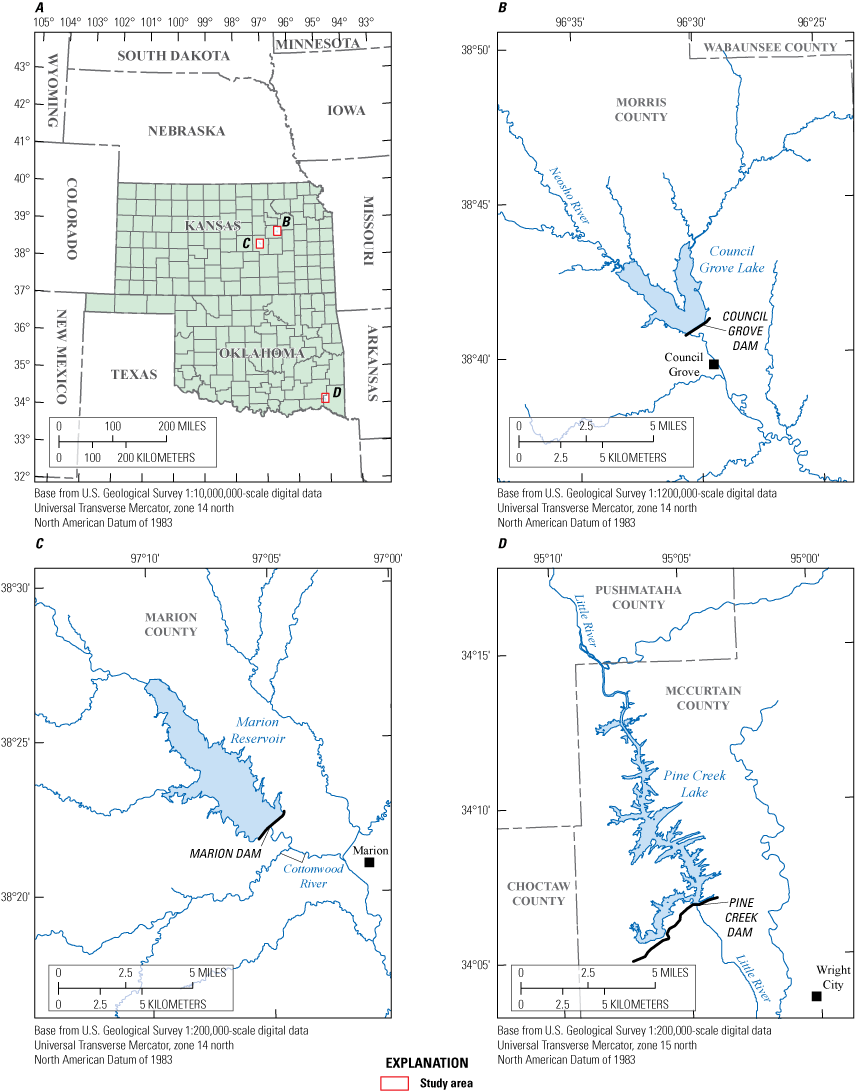
(A) Locations of surveyed lakes in this study, including (B) Council Grove Lake, Kansas, (C) Marion Reservoir, Kansas, and (D) Pine Creek Lake, Oklahoma.
Purpose and Scope
This report documents the data collection, post-processing, and uncertainty estimation methods for bathymetric surveys conducted during July–September 2024 on Council Grove Lake and Marion Reservoir, Kans., and Pine Creek Lake, Okla. This report also presents bathymetric contour maps and elevation-area-capacity tables for those lakes calculated from the processed bathymetric survey data and supporting data in an associated data release (Smith and others, 2026).
Description of Study Area Lakes
Council Grove dam, which is approximately 1.5 miles north of Council Grove, Kans. (fig. 1B), was completed in 1964 on the Neosho River (USACE, 2025a) to form Council Grove Lake. The lake is used for flood control, water supply, water-quality control, fish and wildlife, and recreation and has a conservation pool elevation of 1,274.0 feet (ft) above the National Geodetic Vertical Datum of 1929 (NGVD 29) and flood-control pool elevation of 1,289.0 ft above NGVD 29 (USACE, 2024a). For this report, which references elevations to the North American Vertical Datum of 1988 (NAVD 88), an offset of 0.5 ft was added to convert NGVD 29 elevations to NAVD 88 elevations at Council Grove Lake (National Oceanic and Atmospheric Administration [NOAA], 2025).
Marion dam, which is approximately 3.5 miles northwest of Marion, Kans. (fig. 1C), was completed in 1968 on the Cottonwood River (USACE, 2025b) to form Marion Reservoir. The reservoir is used for flood control, water supply, water-quality control, and recreation and has a conservation pool elevation of 1,350.5 ft above NGVD 29 and flood-control pool elevation of 1,358.5 ft above NGVD 29 (USACE, 2024b). For this report, an offset of 0.5 ft was added to convert NGVD 29 elevations to NAVD 88 elevations at Marion Reservoir (NOAA, 2025).
Pine Creek dam, which is approximately 5.0 miles northwest of Wright City, Okla. (fig. 1D), was completed in 1969 on the Little River (USACE, 2025c) to form Pine Creek Lake. The lake is used for flood control, water supply, water-quality control, recreation, and fish and wildlife and has a conservation pool elevation of 438.0 ft above NGVD 29 and flood-control pool elevation of 480.0 ft above NGVD 29 (USACE, 2024c). For this report, an offset of 0.1 ft was added to convert NGVD 29 elevations to NAVD 88 elevations at Pine Creek Lake (NOAA, 2025).
Methods of Bathymetric Surveying and Data Processing
A bathymetric survey involves using a survey-grade echo sounder and differential global positioning system (GPS) receivers to simultaneously collect water-depth and position data across a body of water. The bathymetric survey methods described in this report have been used previously by Huizinga and others (2019), Richards and others (2019), and Hunter and others (2020) for bathymetric contour maps and elevation-area-capacity table development, and the following method descriptions are largely adapted from those reports.
Bathymetric Data Collection
Bathymetric surveys of Council Grove Lake, Marion Reservoir, and Pine Creek Lake were conducted from July 8 to September 20, 2024, when the lakes were above their respective conservation pool elevations. The surveying vessel was a 22-ft, flat-bottom, aluminum-hull boat with an attached outboard motor. The vessel was equipped with two 12-volt, 100-ampere-hour (360,000-coulomb) marine deep-cycle batteries wired in parallel to provide power to a multibeam mapping system (MBMS) consisting of three components: (1) a multibeam echosounder (MBES), (2) an inertial navigation system (INS), and (3) a laptop computer for data collection and processing. The MBES was a 400-kilohertz NORBIT iWBMSh (NORBIT, 2014) mounted on the port side of the survey vessel. The MBES had a curved array that allowed data collection within a 210-degree beam angle (NORBIT, 2014). The beam angle was limited to 140 degrees (70 degrees each side of nadir, or directly below the MBES) to reduce noise in the collected data. The MBES array can be tilted to more accurately survey sloped banks. The tilted array was used during surveying to collect data along banks except where heavy vegetation limited the advantage of this array configuration.
The INS used for the bathymetric surveys was a Trimble Applanix OceanMaster (Trimble Inc., 2023). The INS positions the MBES in three-dimensional space based on the measured heave, pitch, roll, and heading of the survey vessel. The location of the vessel was determined by using a global navigation satellite system (GNSS) with two Trimble AT1675-540TS GPS antennas mounted to a NORBIT PORTUS Pole (a rigid carbon-fiber pole resistant to thermal expansion or contraction; NORBIT, 2021). During each day of surveying, a third GPS unit, the Trimble R12i GNSS (Trimble Inc., 2025), was used to collect GPS base data at a stable position on land. The GPS base was located on the dam intake structures at Council Grove and Pine Creek Lakes and on a concrete slab near a boat ramp at Marion Reservoir. The GPS base data were processed through the NOAA (2024) Online Positioning User Service to tie the local surveys to the National Spatial Reference System, thereby improving the raw GPS results collected by the base station. The GPS collected data were referenced to NAVD 88.
All motion-sensing and navigation data were processed through the Trimble Applanix POSPac Mobile Mapping Suite (Trimble Inc., 2024). This software suite is a post-processing software package designed to import and process position data. The software utilizes tools to identify and compensate for sensor and environmental uncertainties and compute an optimally accurate blended navigation solution. After post-processing, the INS and the GNSS data were blended to produce a smoothed best estimate of trajectory (SBET) file. The SBET file was used as the navigation data from each day to provide the best possible trajectory of the vessel. The file was then applied to the bathymetric data to georeference the survey data.
The MBES measures water depth using ultrasonic sound waves; however, the sound wave velocity is affected by changes in salinity and temperature through the water column (Wilson and Richards, 2006). The MBES has an integrated sound velocity probe that continuously measures sound velocity at the sonar head (lake surface), but sound velocity profiles (SVPs) of the water column were periodically collected by using an AML Oceanographic Base X2 sound velocity profiler (AML Oceanographic Ltd., 2024). A minimum of two SVPs were collected each day of the survey and covered the maximum survey depth for that day. The downloaded SVPs were analyzed with HYPACK/HYSWEEP software (Xylem, Inc., 2024) to verify that the profiles were correctly georeferenced by checking them against the created target in the software at the time and location that each SVP was collected. The SVP data were visually inspected for spikes or anomalies, which were subsequently removed. The SVPs were then incorporated into the bathymetric dataset during processing in the software as water-depth corrections. For some locations, slight temperature adjustments were made to the SVPs to correct mismatches of overlapping MBES water-depth data (Bian and others, 2018).
Water-depth data, SVP corrections, and SBET files were combined in HYPACK/HYSWEEP software to create bathymetric surface elevation points. Three filters were used to assist in removing anomalous elevation point values in the software. These filters included (1) a minimum or maximum elevation filter to remove any elevation point values above the water surface or below the lowest portions of the survey, (2) a matrix filter with a four-sigma limit to remove points with elevation values greater than four standard deviations from the cell statistic, and (3) an over or under filter to remove any elevation points that either overhang or undercut the previous or next beam. After the initial filtering, all data were visually inspected and any anomalous values that did not match the general trend from neighboring data points were removed.
Bathymetric Surface and Contour Map Creation
A bathymetric surface was developed for each lake from the corrected and filtered elevation point values by using the triangulated irregular network algorithm method with the Create Elevation Grid from 3D Vector Data tool in Global Mapper version 26.0.0 (Blue Marble Geographics, 2025) to generate digital terrain models (DTM). Light detection and ranging (lidar) point-cloud data classified as ground points (USGS, 2018, 2022a, b; downloaded tiles listed in Smith and others [2026]) were used to extend survey coverage to inundated, shallow, or debris-obstructed areas that could not be surveyed with the MBES. To reduce noise and improve the appearance of contours, the lidar point-cloud data were gridded to a 2-meter cell size by using the median elevation within the grid cell before input to the triangulated irregular network algorithm.
Linear enforcement was implemented by using methods described by Wilson and Richards (2006) to define bathymetric elevations in areas with gaps between the lidar data and the MBES data. Linear enforcement is the use of breaklines to force linear interpolation of elevations in the DTM to ensure linearity of valleys, ridges, channels, banks, and steep slopes (Wilson and Richards, 2006). USGS satellite imagery (USGS, 2009) was used in determining linear enforcement of portions of the shoreline where data gaps occurred in some shallow pools because the maximum depth was too shallow for the MBES survey or in areas obstructed by debris. The process of linear enforcement consisted of generating line features in the gap areas and interpolating elevations linearly at points along the line features based on the lidar data and MBES data. The DTM was then created from the interpolated elevations along the line features, the lidar data, and the MBES data. Bathymetric contours were then generated from the bathymetric surface DTM; the contours were generated at 2-ft intervals for Council Grove Lake and Marion Reservoir and at 10-ft intervals for Pine Creek Lake (Smith and others, 2026). Contours less than 1,000 ft in length were deleted to simplify the bathymetric maps. Some vertices of the Pine Creek Lake flood-control pool contour (480.1-ft above NAVD 88) were adjusted manually to prevent vector line intersections with the 480.0-ft (above NAVD 88) contour. Contours were smoothed for the bathymetry maps (shown later) utilizing the ArcGIS Pro 3.4.3 Smooth Line tool with the Polynomial Approximation with Exponential Kernel (PAEK) method using a smoothing tolerance of 30 meters and resolving topological errors with an input barrier of the top-most contour (Esri, 2025). Contours for the Council Grove Lake and Marion Reservoir bathymetry maps were filtered to 4-ft intervals.
Elevation-Area-Capacity Table Generation
Elevation-area-capacity tables indexed at 1-ft intervals were generated from the bathymetric surface DTM. The DTM elevation values (one per raster cell) were filtered to remove no-data values and sorted in descending order. A column of stage values was added by subtracting the DTM minimum elevation value from the sorted elevation values. Surface area at each indexed water-surface elevation was calculated as the count of all lesser sorted elevation values multiplied by the uniform DTM cell area. The storage capacity at each indexed water-surface elevation was calculated as the sum of all stage values associated with lesser sorted elevation values multiplied by the uniform DTM cell area.
Bathymetric Data-Collection Quality Assurance
Several methods were used for each bathymetric survey and for post-processing to ensure data quality and integrity. The MBES data collection was visually monitored to verify that the data being collected logically represented what the channel might look like. The data were visually monitored to ensure that anomalous soundings created by faulty system settings, such as an incorrect gate setting, were noted and the settings were quickly corrected. The MBES and INS have quality-control lights on the laptop computer that warn of potential problems during data collection. Data repeatability was visually verified during collection where MBES transects overlapped. Water depths were manually measured twice per day by using a steel tape with sounding weight and compared to the MBES water depths at specific locations that had been surveyed that day. The MBMS also estimates the lake water-surface elevation during the survey from GNSS and MBES data; this estimated lake water-surface elevation was compared with daily lake water-surface elevations measured using USACE wire weight gages (USACE, 2024d, e, f). Additional methods used include beam-angle and patch tests conducted during surveying and uncertainty estimates calculated during post-processing of the data.
Beam-Angle Test
The accuracy of depth readings obtained by the MBES outer beams are prone to greater error than readings obtained by the inner more nadir beams because of longer travel distances (Richards and others, 2019). A beam-angle test compares multibeam check lines to a reference surface and estimates the depth accuracy of the multibeam system at different angle limits (Xylem, Inc., 2024). The beam-angle test was performed by using USACE (2013) methods to verify the beams of the MBES were collecting MBES data at sufficient accuracy for the beam angles (up to 140 degrees) used in these lake bathymetric surveys. The beam-angle test results were within the recommended performance standards described by the USACE (2013).
Patch Tests
Patch tests were conducted near the beginning and end of each lake bathymetric survey by using methods described in Xylem, Inc. (2024). Patch tests are dynamic calibration checks that determine systematic errors propagated by the mounting angle, timing, and position of the MBES in relation to the INS and real-world coordinates (Huizinga, 2017). The offsets estimated by the patch tests were used to correct for systematic errors in latency, roll, pitch, and yaw. The offsets used for each lake were the results of the patch tests performed on that lake; however, each lake’s patch tests resulted in similar offsets, indicating the consistency of the systematic errors throughout the project. Proper calibration will yield consistent bathymetric results under various vessel and MBES orientations (Huizinga, 2017).
Uncertainty Estimation
Uncertainties in bathymetric elevation data were estimated by computing the total propagated uncertainty (TPU; sheet 1, figs. 2–4) as described in Huizinga (2017). The TPU was calculated for each grid cell in the surveyed area for each lake by using the Combined Uncertainty and Bathymetry Estimator (CUBE) method (Calder and Mayer, 2003; Richards and Huizinga, 2018) in the HYPACK software (Xylem, Inc., 2024). The CUBE method combines the uncertainty from all MBMS system-component and resolution effects to estimate the TPU.
The highest TPU uncertainties were located near high-relief features on the lakebed or along the outermost beam extents of the MBES swath, which typically yield the noisiest data (figs. 2–4). Some minor gaps in the data occurred where a segment of data collection was completed and the boat moved before the next segment was initiated. Other minor gaps in the data occurred because of swaths not overlapping. TPU statistics for each lake are described in table 1. The MBES bathymetric elevations estimated in this report were based on the CUBE “depth” as described in the HYPACK software (Xylem, Inc., 2024). The CUBE depth is the most probable elevation of an MBES survey point and is calculated using the TPU estimates (Calder and Mayer, 2003; Xylem, Inc., 2024). For this report, CUBE depths were reported as elevations above NAVD 88.
Table 1.
Summary of total propagated uncertainty results from multibeam bathymetric surveys (Smith and others, 2026) for Council Grove Lake and Marion Reservoir, Kansas, and Pine Creek Lake, Oklahoma, 2024.Bathymetric Map, Surface Area, and Storage Capacity Results
Results of the bathymetric surveys and data uncertainty estimation are provided on sheets 2–4, which contain figures 2–13 and tables 2–4; these sheets are available for download at https://doi.org/10.3133/sim3549. The bathymetric surfaces and contours derived from the 2024 survey are shown in figures 5, 8, and 11. The elevation-area and elevation-capacity relations derived from those data are plotted in figures 6–7, 9–10, and 12–13. Selected surface-area and storage capacity values derived from those data are listed in tables 2–4.
Council Grove Lake’s surface area (fig. 6) and storage capacity (fig. 7) were 3,060 acres and 42,500 acre-feet (acre-ft), respectively, at the conservation pool elevation of 1,274.5 ft above NAVD 88 (table 2). The lake’s surface area (fig. 6) and storage capacity (fig. 7) were 5,220 acres and 104,000 acre-ft, respectively, at the flood-control pool elevation of 1,289.5 ft above NAVD 88 (table 2).
Marion Reservoir’s surface area (fig. 9) and storage capacity (fig. 10) were 6,590 acres and 77,200 acre-ft, respectively, at the conservation pool elevation of 1,351.0 ft above NAVD 88 (table 3). The reservoir’s surface area (fig. 9) and storage capacity (fig. 10) were 9,410 acres and 140,000 acre-ft, respectively, at the flood-control pool elevation of 1,359.0 ft above NAVD 88 (table 3).
Pine Creek Lake’s surface area (fig. 12) and storage capacity (fig. 13) were 3,160 acres and 40,600 acre-ft, respectively, at the conservation pool elevation of 438.1 ft above NAVD 88 (table 4). The lake’s surface area (fig. 12) and storage capacity (fig. 13) were 16,900 acres and 442,000 acre-ft, respectively, at the flood-control pool elevation of 480.1 ft above NAVD 88 (table 4).
References Cited
AML Oceanographic Ltd., 2024, Sound velocity sensor—AML Base X2change: Victoria, British Columbia, Canada, AML Oceanographic Ltd. web page, accessed November 7, 2024, at https://amloceanographic.com/sensors/sound-velocity.
Bian, G., Huang, X., Lu, X., Huang, C., Wang, K., and Wang, M., 2018, Analysis of error sources and quality assessment for multibeam sounding products: International Hydrographic Review, v. 18, no. 1, accessed November 7, 2024, at https://ihr.iho.int/articles/the-analysis-of-error-sources-and-quality-assessment-for-multibeam-sounding-products/.
Blue Marble Geographics, 2025, Global Mapper Pro (ver. 26.0.0): Blue Marble Geographics web page, accessed June 2, 2025, at https://www.bluemarblegeo.com/knowledgebase/global-mapper/Create_Elevation_Grid_from_3D_Vector_Data.htm?tocpath=Global%20Mapper%20Menus%7CTerrain%20An alysis%20Menu%7CCreate%20Elevation%20Grid%20from%203D%20Vector%20Data%7C_____0.
Calder, B.R., and Mayer, L.A., 2003, Automatic processing of high-rate, high-density multibeam echosounder data: Geochemistry, Geophysics, Geosystems, v. 4, no. 6, 22 p., accessed December 12, 2024, at https://doi.org/10.1029/2002GC000486.
Esri, 2025, Smooth Line (Cartography) tool: Esri web page, accessed December 9, 2025, at https://pro.arcgis.com/en/pro-app/latest/tool-reference/cartography/smooth-line.htm.
Huizinga, R.J., 2017, Bathymetric and velocimetric surveys at highway bridges crossing the Missouri and Mississippi Rivers near St. Louis, Missouri, May 23–27, 2016: U.S. Geological Survey Scientific Investigations Report 2017–5076, 102 p., accessed November 7, 2024, at https://doi.org/10.3133/sir20175076.
Huizinga, R.J., and Heimann, D.C., 2018, Hydrographic surveys of rivers and lakes using a multibeam echosounder mapping system: U.S. Geological Survey Fact Sheet 2018–3021, 6 p., accessed November 7, 2024, at https://doi.org/10.3133/fs20183021.
Huizinga, R.J., Ellis, J.T., Sharpe, J.B., LeRoy, J.Z., and Richards, J.M., 2019, Bathymetric map and surface area and capacity table for Beaver Lake near Rogers, Arkansas, 2018: U.S. Geological Survey Scientific Investigations Map 3445, 2 sheets, accessed December 12, 2024, at https://doi.org/10.3133/sim3445.
Hunter, S.L., Trevisan, A.R., Villa, J., and Smith, K.A., 2020, Bathymetric map, surface area, and capacity of Grand Lake O’ the Cherokees, northeastern Oklahoma, 2019: U.S. Geological Survey Scientific Investigations Map 3467, 2 sheets, accessed November 14, 2024, at https://doi.org/10.3133/sim3467.
National Oceanic and Atmospheric Administration [NOAA], 2024, OPUS—Online Positioning User Service: National Oceanic and Atmospheric Administration, National Geodetic Survey database, accessed February 20, 2025, at https://geodesy.noaa.gov/OPUS/.
National Oceanic and Atmospheric Administration [NOAA], 2025, NGS Coordinate Conversion and Transformation Tool (NCAT): National Oceanic and Atmospheric Administration, National Geodetic Survey database, accessed June 30, 2025, at https://www.ngs.noaa.gov/NCAT/.
NORBIT, 2014, NORBIT iWBMSh high-end turnkey multibeam sonar system: Trondheim, Norway, NORBIT, 2 p., accessed December 11, 2024, at https://norbit.com/media/PS-150010-11_iWBMSh_A4.pdf.
NORBIT, 2021, NORBIT carbon fiber “PORTUS” mounting pole: Trondheim, Norway, NORBIT, 2 p., accessed December 11, 2024, at https://norbit.com/media/PS-190002-3_Carbon-Fiber-PORTUS-Pole_A4.pdf.
Richards, J.M., and Huizinga, R.J., 2018, Bathymetric contour map, surface area and capacity table, and bathymetric difference map for Clearwater Lake near Piedmont, Missouri, 2017: U.S. Geological Survey Scientific Investigations Map 3409, 1 sheet, accessed December 12, 2024, at https://doi.org/10.3133/sim3409.
Richards, J.M., Huizinga, R.J., and Ellis, J.T., 2019, Bathymetric contour map, surface area and capacity table, and bathymetric change map for Sugar Creek Lake near Moberly, Missouri, 2018: U.S. Geological Survey Scientific Investigations Map 3431, 1 sheet, accessed December 12, 2024, at https://doi.org/10.3133/sim3431.
Smith, K.A., Pierson, N.W., and Trevisan, A.R., 2026, Bathymetric maps, surface area and capacity of three selected lakes in central Kansas and southeastern Oklahoma, 2024: U.S. Geological Survey data release, https://doi.org/10.5066/P13U34QO.
Trimble Inc., 2023, Applanix POS MV—OceanMaster [datasheet]: Richmond Hill, Ontario, Canada, Trimble Inc., 2 p., accessed December 11, 2024, at https://assets.ctfassets.net/9k5dj5b59lqq/3jSmRh5WmTFiP5FdNfoUiE/4b7a4437d499ab6c4ce524e49557c89a/POS-MV-OceanMaster.pdf.
Trimble Inc., 2024, Applanix POSPac MMS: Richmond Hill, Ontario, Canada, Trimble Inc. web page, accessed December 11, 2024, at https://applanix.trimble.com/en/software/applanix-pospac-mms.
Trimble Inc., 2025, Trimble R12i GNSS receiver: Sunnyvale, California, Trimble Inc. web page, accessed November 7, 2024, at https://geospatial.trimble.com/en/products/hardware/trimble-r12i.
U.S. Army Corps of Engineers [USACE], 2013, Engineering and design—Hydrographic surveying: Washington, D.C., U.S. Army Corps of Engineers manual no. EM 1110–2–1003, 699 p., accessed December 12, 2024, at https://www.publications.usace.army.mil/Portals/76/Publications/EngineerManuals/EM_1110-2-1003.pdf.
U.S. Army Corps of Engineers [USACE], 2024a, Council Grove Lake—Pertinent data: U.S. Army Corps of Engineers web page, accessed December 11, 2024, at https://www.swt.usace.army.mil/Locations/Tulsa-District-Lakes/Kansas/Council-Grove-Lake/Pertinent-Data/.
U.S. Army Corps of Engineers [USACE], 2024b, Marion Reservoir—Pertinent data: U.S. Army Corps of Engineers web page, accessed December 11, 2024, at https://www.swt.usace.army.mil/Locations/Tulsa-District-Lakes/Kansas/Marion-Reservoir/Pertinent-Data/.
U.S. Army Corps of Engineers [USACE], 2024c, Pine Creek Lake—Pertinent data: U.S. Army Corps of Engineers web page, accessed December 11, 2024, at https://www.swt.usace.army.mil/Locations/Tulsa-District-Lakes/Oklahoma/Pine-Creek-Lake/Pertinent-Data/.
U.S. Army Corps of Engineers [USACE], 2024d, Council Grove Lake—Pool status: U.S. Army Corps of Engineers web page, accessed December 11, 2024, at https://www.swt-wc.usace.army.mil/COUN.lakepage.html.
U.S. Army Corps of Engineers [USACE], 2024e, Marion Reservoir—Pool status: U.S. Army Corps of Engineers web page, accessed December 11, 2024, at https://www.swt-wc.usace.army.mil/MARI.lakepage.html.
U.S. Army Corps of Engineers [USACE], 2024f, Pine Creek Lake—Pool status: U.S. Army Corps of Engineers web page, accessed December 11, 2024, at https://www.swt-wc.usace.army.mil/PINE.lakepage.html.
U.S. Army Corps of Engineers [USACE], 2025a, National Inventory of Dams—Council Grove Dam: U.S. Army Corps of Engineers web page, accessed June 2, 2025, at https://nid.sec.usace.army.mil/#/dams/system/KS00001/summary.
U.S. Army Corps of Engineers [USACE], 2025b, National Inventory of Dams—Marion Dam: U.S. Army Corps of Engineers web page, accessed June 2, 2025, at https://nid.sec.usace.army.mil/#/dams/system/KS00006/summary.
U.S. Army Corps of Engineers [USACE], 2025c, National Inventory of Dams—Pine Creek Dam: U.S. Army Corps of Engineers web page, accessed June 2, 2025, at https://nid.sec.usace.army.mil/#/dams/system/OK10306/summary.
U.S. Geological Survey [USGS], 2009, The National Map—USGSImageryOnly (MapServer): U.S. Geological Survey database, accessed November 18, 2024, at https://basemap.nationalmap.gov/arcgis/rest/services/USGSImageryOnly/MapServer.
U.S. Geological Survey [USGS], 2018, The National Map data download application—USGS lidar point cloud [OK Woodward UTM15 B5 2016 (dataset)]: U.S. Geological Survey database, accessed November 4, 2024, at https://www.usgs.gov/tools/download-data-maps-national-map.
U.S. Geological Survey [USGS], 2022a, The National Map data download application—USGS lidar point cloud [AR North Corridor FEMA R6 lidar 2016 D1 (dataset)]: U.S. Geological Survey database, accessed November 4, 2024, at https://www.usgs.gov/tools/download-data-maps-national-map.
U.S. Geological Survey [USGS], 2022b, The National Map data download application—USGS lidar point cloud [KS Statewide 2018 A18 (dataset)]: U.S. Geological Survey database, accessed November 4, 2024, at https://www.usgs.gov/tools/download-data-maps-national-map.
Wilson, G.L., and Richards, J.M., 2006, Procedural documentation and accuracy assessment of bathymetric maps and area/capacity tables for small reservoirs: U.S. Geological Survey Scientific Investigations Report 2006–5208, 24 p., accessed December 12, 2024, at https://pubs.usgs.gov/publication/sir20065208.
Xylem, Inc., 2024, HYPACK 2024 user manual—Version 2024.0: Middletown, Connecticut, HYPACK, Inc., 2,826 p., accessed November 7, 2024, at https://www.xylem.com/siteassets/brand/hypack/resources/manual/2024_hypack-user-manual.pdf.
Conversion Factors
U.S. customary units to International System of Units
Datum
Vertical coordinate information is referenced to the National Geodetic Vertical Datum of 1929 (NGVD 29) and North American Vertical Datum of 1988 (NAVD 88).
Horizontal coordinate information is referenced to the North American Datum of 1983 (NAD 83).
Elevation, as used in this report, refers to distance above the vertical datum.
Abbreviations
CUBE
Combined Uncertainty and Bathymetry Estimator
DTM
digital terrain model
GNSS
global navigation satellite system
GPS
Global Positioning System
INS
inertial navigation system
lidar
light detection and ranging
MBES
multibeam echosounder
MBMS
multibeam mapping system
NOAA
National Oceanic and Atmospheric Administration
SBET
smoothed best estimate of trajectory
SVP
sound velocity profiler
TPU
total propagated uncertainty
USACE
U.S. Army Corps of Engineers
USGS
U.S. Geological Survey
For more information about this publication, contact
Director, Oklahoma-Texas Water Science Center
U.S. Geological Survey
1505 Ferguson Lane
Austin, TX 78754–4501
For additional information, visit
https://www.usgs.gov/centers/ot-water
Publishing support provided by
U.S. Geological Survey Science Publishing Network,
Lafayette Publishing Service Center
Disclaimers
Any use of trade, firm, or product names is for descriptive purposes only and does not imply endorsement by the U.S. Government.
Although this information product, for the most part, is in the public domain, it also may contain copyrighted materials as noted in the text. Permission to reproduce copyrighted items must be secured from the copyright owner.
Suggested Citation
Smith, K.A., Pierson, N.W., and Trevisan, A.R., 2026, Bathymetric maps, surface areas, and storage capacities of Council Grove Lake and Marion Reservoir, Kansas, and Pine Creek Lake, Oklahoma, 2024: U.S. Geological Survey Scientific Investigations Map 3549, 4 sheets, includes 8-p. pamphlet, https://doi.org/10.3133/sim3549.
ISSN: 2329-132X (online)
Study Area
| Publication type | Report |
|---|---|
| Publication Subtype | USGS Numbered Series |
| Title | Bathymetric maps, surface areas, and storage capacities of Council Grove Lake and Marion Reservoir, Kansas, and Pine Creek Lake, Oklahoma, 2024 |
| Series title | Scientific Investigations Map |
| Series number | 3549 |
| DOI | 10.3133/sim3549 |
| Publication Date | June 10, 2026 |
| Year Published | 2026 |
| Language | English |
| Publisher | U.S. Geological Survey |
| Publisher location | Reston, VA |
| Contributing office(s) | Oklahoma-Texas Water Science Center |
| Description | Report: x, 8 p.; 4 Sheets: 36.00 x 40.80 inches; Data Release |
| Country | United States |
| State | Kansas, Oklahoma |
| Other Geospatial | Council Grove Lake, Marion Reservoir, Pine Creek Lake |
| Online Only (Y/N) | Y |
| Additional Online Files (Y/N) | N |