

Geology and Assessment of Coal Resources for the Cherokee Coal Bed in the Fort Union Formation, South-Central Wyoming
Links
- Document: Report (6.73 MB pdf) , HTML , XML
- Additional Report Pieces:
- Data Release: USGS data release - Cherokee coal bed drill hole data from the Fort Union Formation in the Little Snake River coal field and Red Desert area, Wyoming
- NGMDB Index Page: National Geologic Map Database Index Page (html)
- Download citation as: RIS | Dublin Core
Acknowledgments
The authors would like to acknowledge and thank Charles N. “Rocky” Thompson of TGSI and Dr. Peter J. Bethel of Marshall Miller & Associates for providing technical information utilized in this report. The authors would also like to acknowledge and thank Leslie F. “Jingle” Ruppert and James A. Luppens, both U.S. Geological Survey scientists emeriti, for providing peer reviews of this study. Their notes and comments on the manuscript contributed greatly to its improvement.
Abstract
The Cherokee coal bed is a locally thick and laterally continuous coal bed in the Overland Member of the Paleocene Fort Union Formation in south-central Wyoming. It represents a significant resource that is easily accessible and may be extractable through both surface and underground mining methods. A database of more than 600 data points, comprising coalbed methane wells, coal exploration drill holes, and measured sections, was compiled from a previously released geologic database and reinterpreted to provide a more detailed geologic model for the Cherokee coal bed. The thickest part of the Cherokee coal bed lies along the crest of the Wamsutter arch, an east-west trending anticlinal feature that separates the Great Divide subbasin to north from the Washakie subbasin to the south. The Cherokee coal bed consists of several laterally persistent benches separated by partings that range in thickness from one inch to greater than 100 feet. A series of detailed geologic cross sections through the study area show both the structural geology and the distribution and areal extent of the individual coal benches of the Cherokee coal bed.
Data generated from the geologic model were used in stochastic geostatistical analyses to estimate the remaining or in-place coal resources. Certain parameters, as described later in the text, were applied to calculate available coal resources for surface and underground mining. This study is part of an ongoing process by the U.S. Geological Survey (USGS) to transition from a distance-based approach to a probabilistic approach for determining uncertainty in coal resource assessment. This probabilistic approach uses quantitative statistical methods to determine the potential range of uncertainty in coal resource estimates, whereas the distance-based approach does not provide any mathematical method to determine the range of uncertainty. Using stochastic geostatistical methods, utilizing 100 realizations or gridding iterations of the data, in-place resources were calculated, with a 90 percent probability, to be 15.261 ± 0.464 billion short tons (bst). Available coal resources tonnages were calculated using separate sets of criteria for surface and underground mining methods, based on probable mining parameters. Tonnage values were calculated based on estimated coal densities determined from available coal quality data. Available coal resources that meet the parameters for surface mining methods were calculated, with a 90 percent probability, to be 0.813 ± 0.038 bst.
Available coal resources that meet the parameters for underground mining methods were calculated, with a 90 percent probability, to be 2.393 ± 0.055 bst. The calculations were based on estimates of the resources that meet the parameters for the optimum mining of the thickest coal benches of the Cherokee coal bed. This is depicted in a series of cross sections through the study area that show projected underground mining horizons in the Cherokee coal bed, based on the thickest combinations of individual coal benches.
Introduction
The Cherokee coal bed is a locally thick coal bed in the eastern part of the Greater Green River Basin in south-central Wyoming, lying stratigraphically in the upper part of the Paleocene Fort Union Formation. Because of its thickness and lateral extent in the study area, the Cherokee coal bed merits assessment as a significant resource that may be extracted through both surface and underground mining methods. The Cherokee coal bed provides an opportunity to use stochastic geostatistical methods to calculate the available coal resources within the study area. Available coal resources (fig. 1) are those that are available to be mined after exclusions due to environmental, land use, and societal restrictions, as well as those lost due to geological anomalies, weathering, excessive depths of cover, and technical or mining limitations, are subtracted from the remaining coal resources. In this study, the coal resources that are calculated are classified as available resources. Recoverable resources, however, are not calculated, because pit losses, recovery factors based on coal pillars or barriers, and coal lost in conveyance or processing will vary from operation to operation, depending on the geology, extraction methods, technology, and equipment utilized.
Flow chart showing the classification of coal resources and reserves used by the U.S. Geological Survey in coal assessment studies (modified from Luppens and others, 2009).
The U.S. Geological Survey (USGS) is transitioning from a distance-based approach in classifying coal resources, as defined in USGS Circular 891 (Wood and others, 1983), to a probabilistic approach using stochastic geostatistical methods for determining uncertainty in coal resources assessments. The use of stochastic geostatistical methods is preferable to the distance-based method because it uses quantitative statistical methods to determine the potential range of uncertainty in coal resource estimates, whereas the distance-based approach does not provide any mathematical method to determine the range of uncertainty, regardless of the data density. This study determines the in-place and available coal resources for the Cherokee coal bed in the study area using stochastic geostatistical methods. It is the second assessment to use stochastic geostatistical methods to calculate coal resources for a coal bed in this study area in Wyoming (Olea and others, 2021).
Study Area
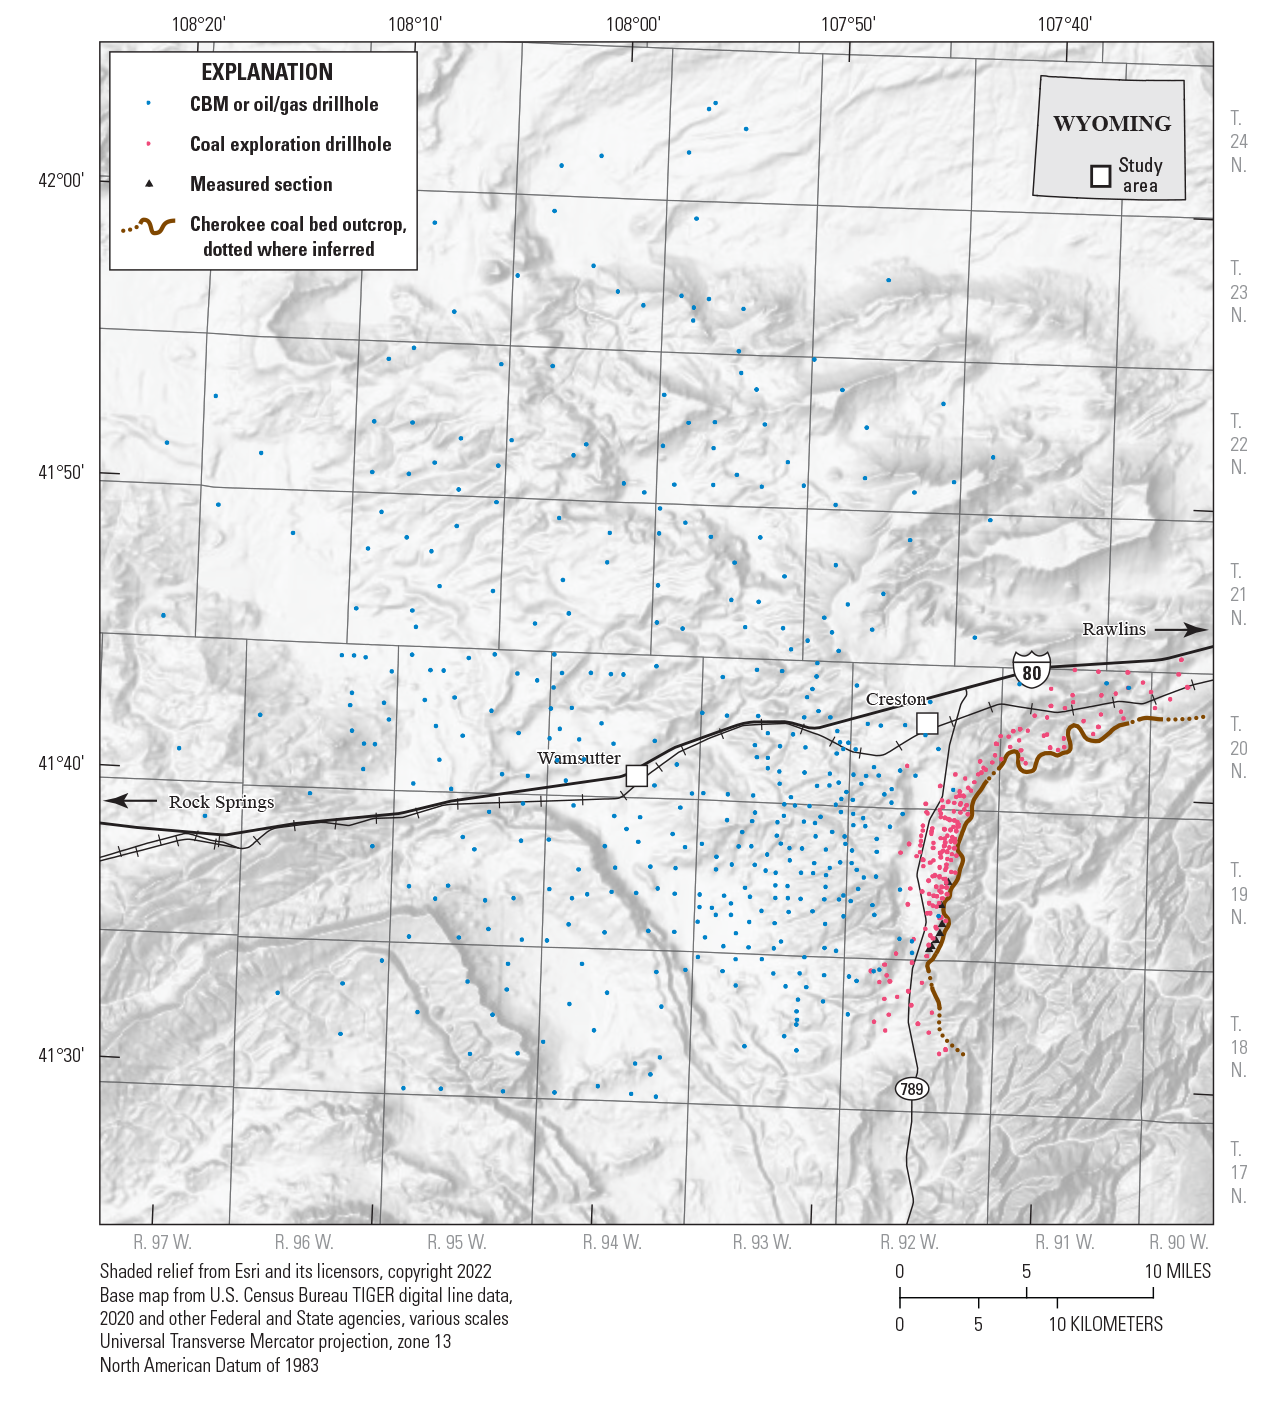
The study area is in Sweetwater and Carbon Counties in south-central Wyoming. The town of Rawlins lies just beyond the eastern edge of the study area, which extends westward approximately 60 miles from Rawlins. Highway Interstate 80 (I-80) crosses the study area in an east-west direction and essentially splits the study area into two halves. The study area extends northward approximately 20 miles from I-80 and southward approximately 15 miles from I-80. The major geographic features in the study area are shown in figure 2. The area to the north of I-80 is designated as the Red Desert assessment area and the area to the south of I-80 is defined as the Little Snake River coal field (Scott and others, 2019).
Map showing the major geographic features and subbasins of the Greater Green River Basin in the study area.
The study area lies in the eastern part of the Greater Green River Basin, which is divided into several subbasins. It encompasses the northeastern part of the Washakie subbasin and the southeastern part of the Great Divide subbasin (fig. 2).
Geology
The geology of the study area includes several distinct structural features, a fluvial/deltaic depositional setting, and thick, laterally extensive coal beds in the Overland Member of the Fort Union Formation.
Structural Features
Several structural geology features are prominent along the eastern margin of the Greater Green River Basin within the study area. The beds comprising the Overland Member generally dip from east to west across the study area, with the steepest dips observed along the eastern edge of the area. Erosion-resistant rock units form prominent ridges in the areas where these steeply dipping rocks crop out. One such ridge, known as the Red Rim, is present just to the east of the study area where the Upper Cretaceous Lance Formation crops out (Hettinger and others, 2008). The study area encompasses parts of the Great Divide and Washakie subbasins, which are separated by a roughly west to east trending anticlinal feature known as the Wamsutter arch (fig. 2). South of the Wamsutter arch, the rocks dip to the southwest into the Washakie Basin; north of the arch, the rocks dip to the north into the Great Divide Basin. The structural features are drawn on the base elevations of the main bench of the Cherokee coal bed. The generalized stratigraphy of the study area is shown in figure 3. The benches of the Cherokee coal bed shown in figure 3 are defined as follows:
-
• The Cherokee main bench is the stratigraphically lowest occurrence of the coal without any shale partings present.
-
• The Cherokee bench #2, where present, is a coal bed immediately overlying the Cherokee main bench and is separated from it by a shale or rock parting.
-
• The Cherokee bench #3, where present, is the first coal bed overlying the Cherokee bench #2 and is separated from it by a shale or rock parting of varying thickness.
-
• The Cherokee bench #4, where present, is the first coal bed overlying the Cherokee bench #3 and is separated from it by a shale or rock parting of varying thickness.
The structural geology features and base coal elevations for the main bench of the Cherokee coal bed in the study area are shown in figure 4.
Generalized stratigraphic column for the study area for the Overland Member of the Fort Union Formation, showing the individual benches of the Cherokee coal bed. (Mbr, Member)
Structural geology map of the study area. Structure contour isolines drawn on the base of the Cherokee coal bed. Contour interval is 100 feet. (CBM, coalbed methane)
Depositional Environment
The depositional environment of the Overland Member of the Fort Union Formation is interpreted to be fluvial dominated, with fluvial channels, flood plains, and paludal areas (Hettinger and others, 2008), which is reflected by the variable thicknesses of the partings that split the Cherokee coal bed into multiple benches. As interpreted from Hettinger and others (2008), the thickest partings are dominated by fine-grained sandstones that compose the core of fluvial channels flowing through the study area during the Paleocene. Away from the channel core, the partings become thinner and are composed of sandy siltstones, silty mudstones, and mudstones representing floodplain deposits. The part of the floodplain nearest the fluvial channels contains very fine-grained sandstones, sandy shales, and siltstones that represent levee, crevasse splay, and overbank sediments. Away from the fluvial channels, the floodplain sediments become thinner and continue to decrease in overall grain size. The distal parts of the floodplain are mainly comprised of mudstones and silty mudstones, with rare siltstone or very fine-grained sandstone lenses, representing sporadic flooding events. The transition from the floodplain to the paludal environment is marked by continued thinning of the sediments owing to the absence of any sand or silt in the mudstones and an increase in the carbonaceous content of the sediments. The distal parts of the floodplain at the transition to the paludal environment are composed of black carbonaceous clay shales. The paludal environment is represented by the central core of the thick Cherokee coal bed interval, with little or no sediment input and uninterrupted plant growth, allowing for the thick accumulation of peat.
Stratigraphy
The Cherokee coal bed lies stratigraphically in the upper part of the Paleocene Fort Union Formation (fig. 3). The Fort Union Formation was subdivided into three members by Honey and Hettinger (2004). These three members, from youngest to oldest, are the Overland Member, the Blue Gap Member, and the China Butte Member. Both the Overland Member and the China Butte Member are coal-bearing units. The Blue Gap Member consists mainly of fine-grained sediments (mudstone and claystone, with lesser amounts of sandstone and siltstone) but pinches out in southern Wyoming just north of the Wyoming/Colorado State line (Honey and Hettinger, 2004). The China Butte Member, the lowermost unit in the Fort Union Formation, comprises interbedded sandstones, siltstones, and mudstones. It also contains several coal intervals with locally thick coal beds (Honey and Hettinger, 2004).
The stratigraphic position of the Cherokee coal bed places it in the middle to upper part of the Overland Member (fig. 3). The Overland Member contains several laterally extensive coal beds, including, from stratigraphically youngest to oldest, the High Point, the Cherokee, the Cow Butte, and the Horse Butte coal beds.
An unconformity separates the overlying Eocene Wasatch Formation from the Overland Member. The thickness of the stratigraphic interval from the unconformity to the High Point coal bed varies, with the thinnest interval in the eastern and southeastern part of the study area and the thickest interval in the northwest part of the study area.
The High Point coal bed overlies the Cherokee coal bed within the Overland Member. The High Point bed is generally 30–100 feet above the Cherokee bed (fig. 3) and in some places may be present in two or more benches. In some areas, it is difficult to interpret whether coal beds above the Cherokee coal correlate to the High Point coal or are sporadic rider coal beds of limited areal extent associated with the Cherokee coal.
The Cherokee coal bed is the thickest and most laterally extensive of the coal beds in the Overland Member, as shown in figure 3. The Cherokee coal bed attains a maximum thickness of greater than 50 feet near its outcrop on the eastern side of the study area. A parting-free coal zone greater than 30 feet thick is present in the east-central part of the study area along the cropline. Partings are present to the north, west, and south of this parting-free zone and split the Cherokee coal bed into multiple benches. These partings can range in thickness from one inch to greater than 100 feet. In many areas, two or more of the individual benches may be parting-free and appear to be combined into a single, thick bench. At least four benches of the Cherokee coal bed, separated by partings, can be correlated and mapped throughout the study area. These four benches can range in thickness from less than one foot to more than 10 feet. The benches generally thin from east to west across the study area, with several of the benches pinching out towards the western edge of the study area. The overall cumulative thickness of the benches of the Cherokee coal bed, excluding non-coal partings, are shown in figure 5.
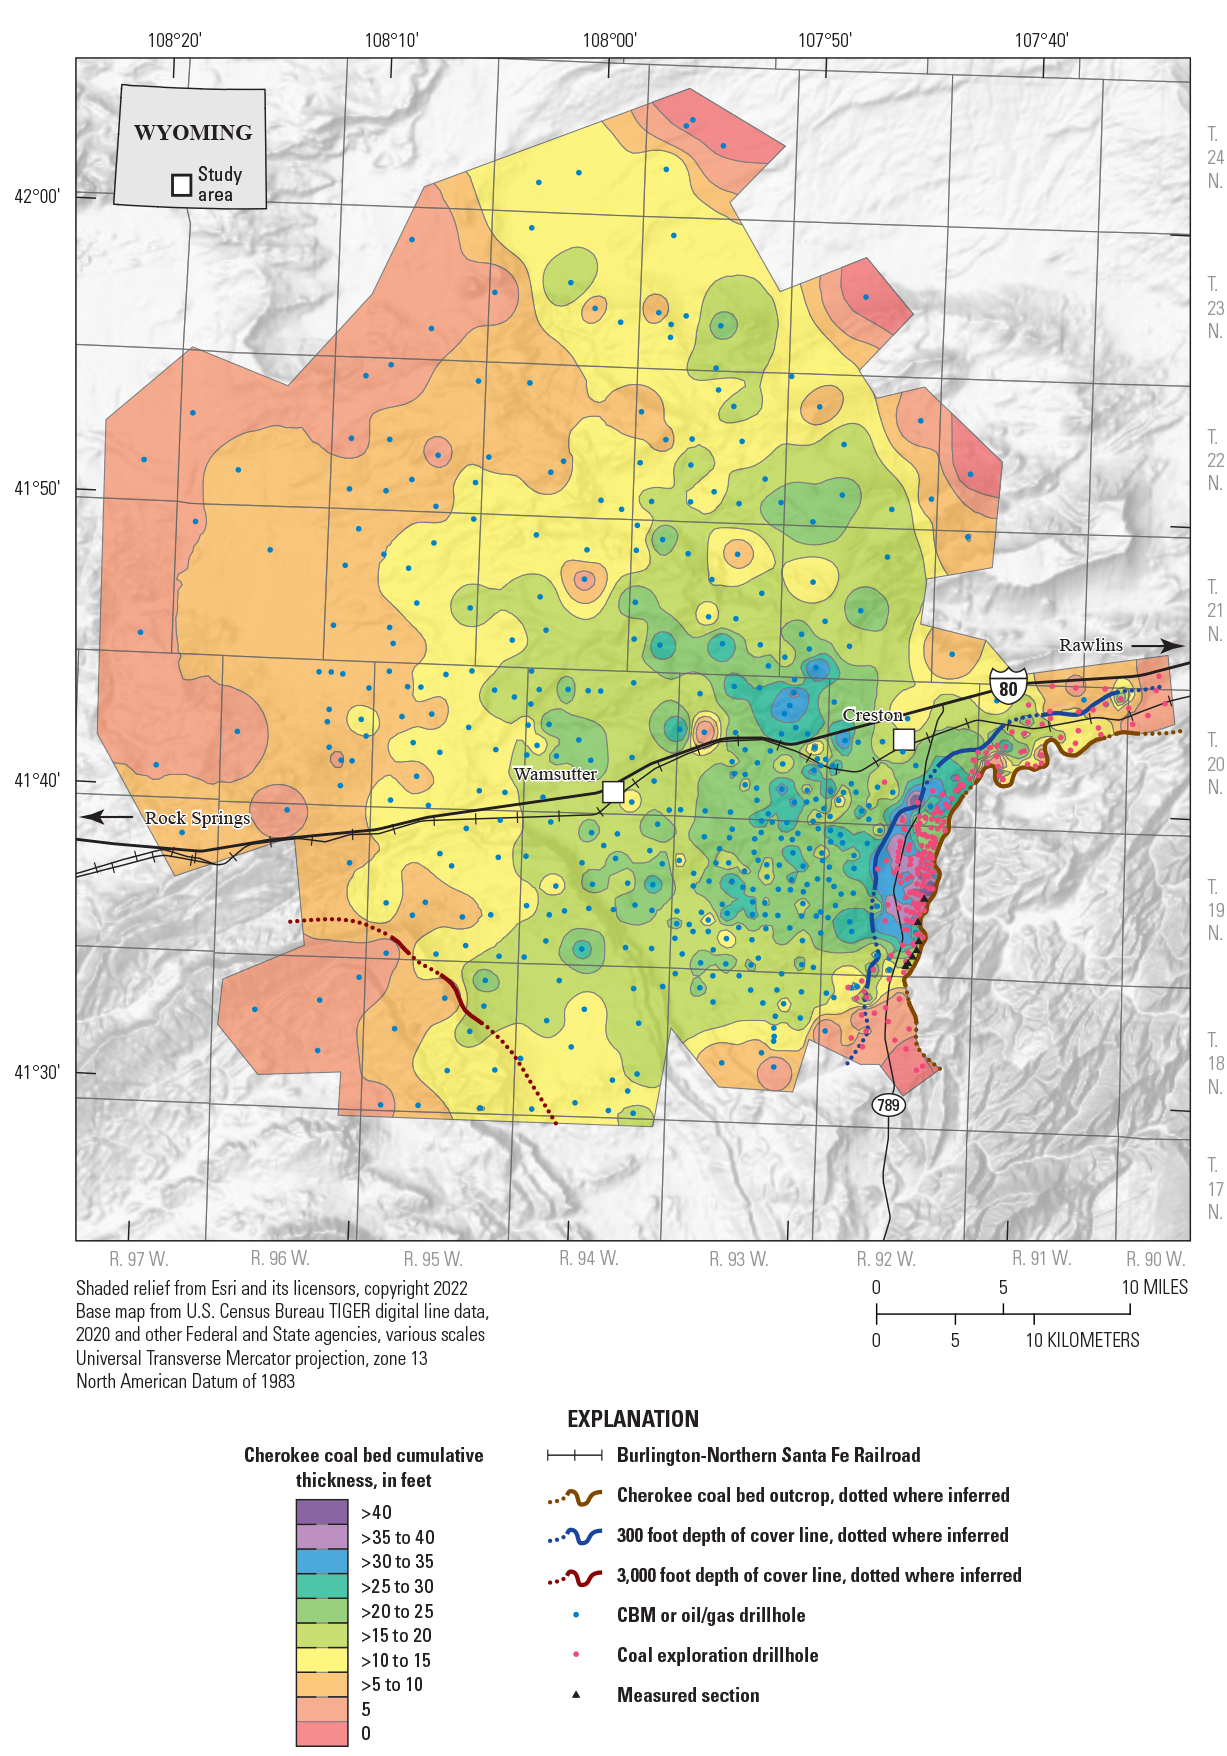
Map showing cumulative thickness of the individual benches of the Cherokee coal bed in the study area. The thickness values do not include non-coal partings. (CBM, coalbed methane)
Immediately below the Cherokee coal interval, a thick, but laterally discontinuous coal bed may be present, especially in the eastern part of the study area in association with the thickest occurrence of Cherokee coal. This coal bed, which locally may be more than 10 feet thick, is named the Cherokee leader coal. It splits into multiple benches away from these locally thick areas and quickly pinches out. The bed is rarely present in the central and western parts of the study area. The Cherokee leader coal bed appears to be separate from the Cherokee coal. Correlations of the two coal beds between available drill holes, based on comparisons of coal thicknesses in the Cherokee and Cherokee leader coal intervals, make it difficult to include the Cherokee leader coal bed as an individual bench of the Cherokee coal bed.
Below the Cherokee leader coal are the Cow Butte and Horse Butte coal bed intervals. The Cow Butte interval generally lies 90 to 125 feet below the Cherokee main bench (fig. 3) and in most places consists of two coal beds – the Cow Butte and upper bench. The Cow Butte coal beds may attain thicknesses of more than 10 feet locally, but they typically split and thin laterally away from these locally thick areas and in most places consists of two coal beds—a lower and upper bench.
The Horse Butte coal interval generally lies 150 to 220 feet below the Cherokee coal interval (fig. 3). The Horse Butte coal bed may attain thicknesses of more than 10 feet locally and is present in most of the study area as two persistent benches. The upper bench of the Horse Butte ranges in thickness from 5 to 8 feet. The lower bench may be 50 to 75 feet below the upper bench and in most areas is less than 2 feet thick. These multiple benches of the Horse Butte coal bed form the Horse Butte coal interval.
Below the Horse Butte coal interval, the lower part of the Overland Member contains a basal sandstone, up to 5 feet thick, containing lenses of very coarse-grained sandstone and isolated pebbles (Honey and Hettinger, 2004). The Overland Member of the Fort Union Formation lies unconformably on the China Butte Member (or the Blue Gap Member, where present).
Geologic cross sections A–A’, B–B’, and C–C’ show the Overland Member containing the coal beds described above. The locations of the cross sections in the study area are shown in figure 6. Some drill hole numbers shown on the cross sections have letter prefixes; these letter prefixes are defined as follows:
-
• API: coalbed methane or petroleum drill holes identified by their American Petroleum Institute (API) number.
-
• CR, H, HP, PPL: coal exploration boreholes drilled by various companies in the study area using company-specific naming conventions.
Cross section A–A’ (fig. 7) is a west to east cross section showing the thick Cherokee coal bed along the eastern edge of the section splitting into individual benches as the section trends downdip to the west. The Cow Butte coal interval is also persistent in the eastern half of the cross section, but pinches out to the west, whereas the Horse Butte coal interval becomes more persistent to the west. Structurally, the coal beds of the Overland Member dip to the west from their outcrops along the eastern rim of the Greater Green River Basin.
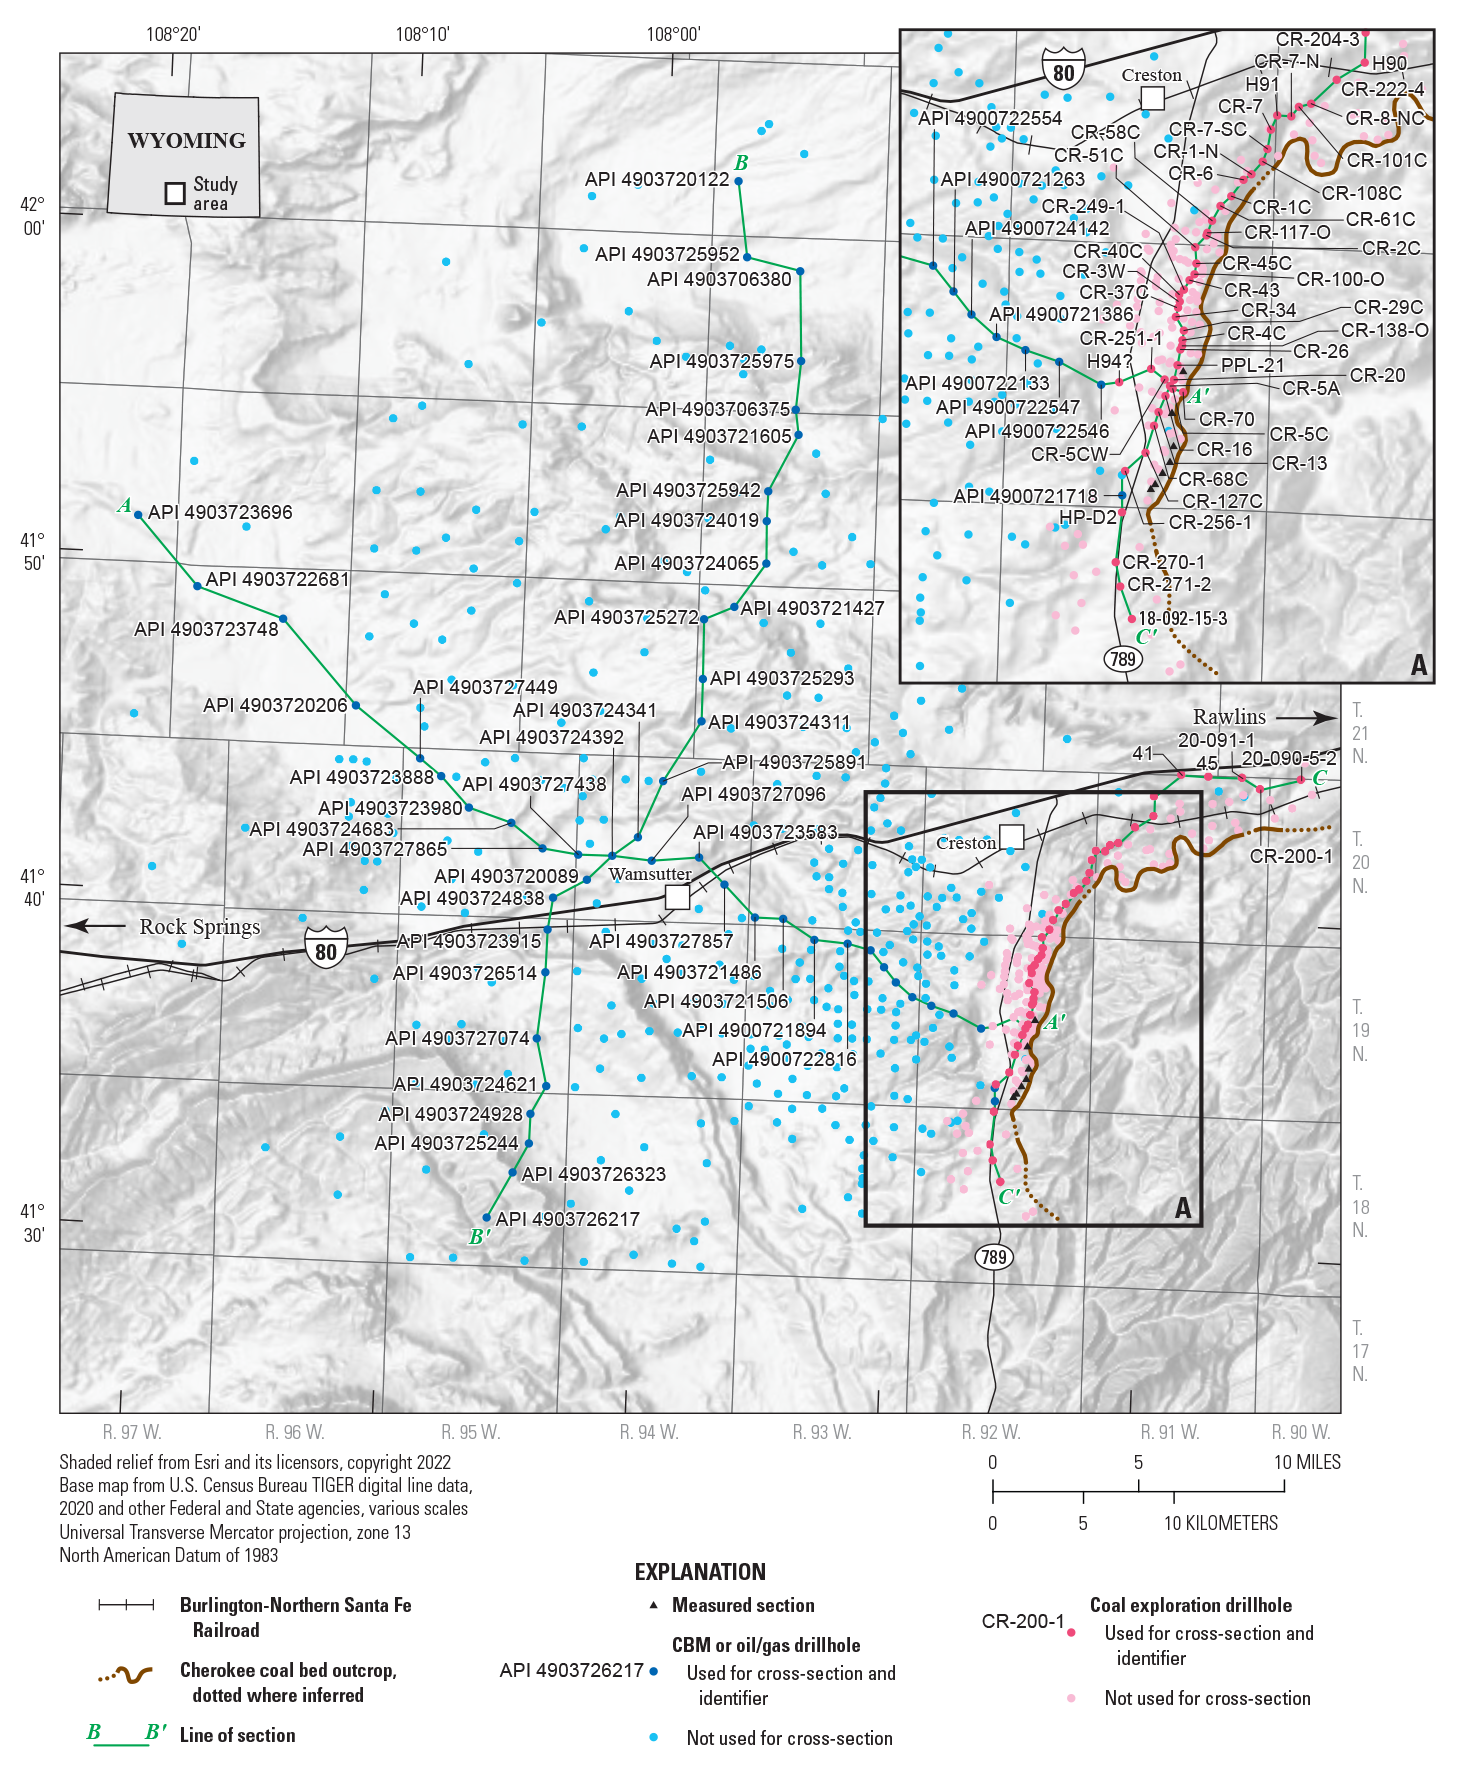
Map showing location of geologic cross sections across the study area. Identification numbers are shown for drill holes used in the sections. (CBM, coalbed methane)
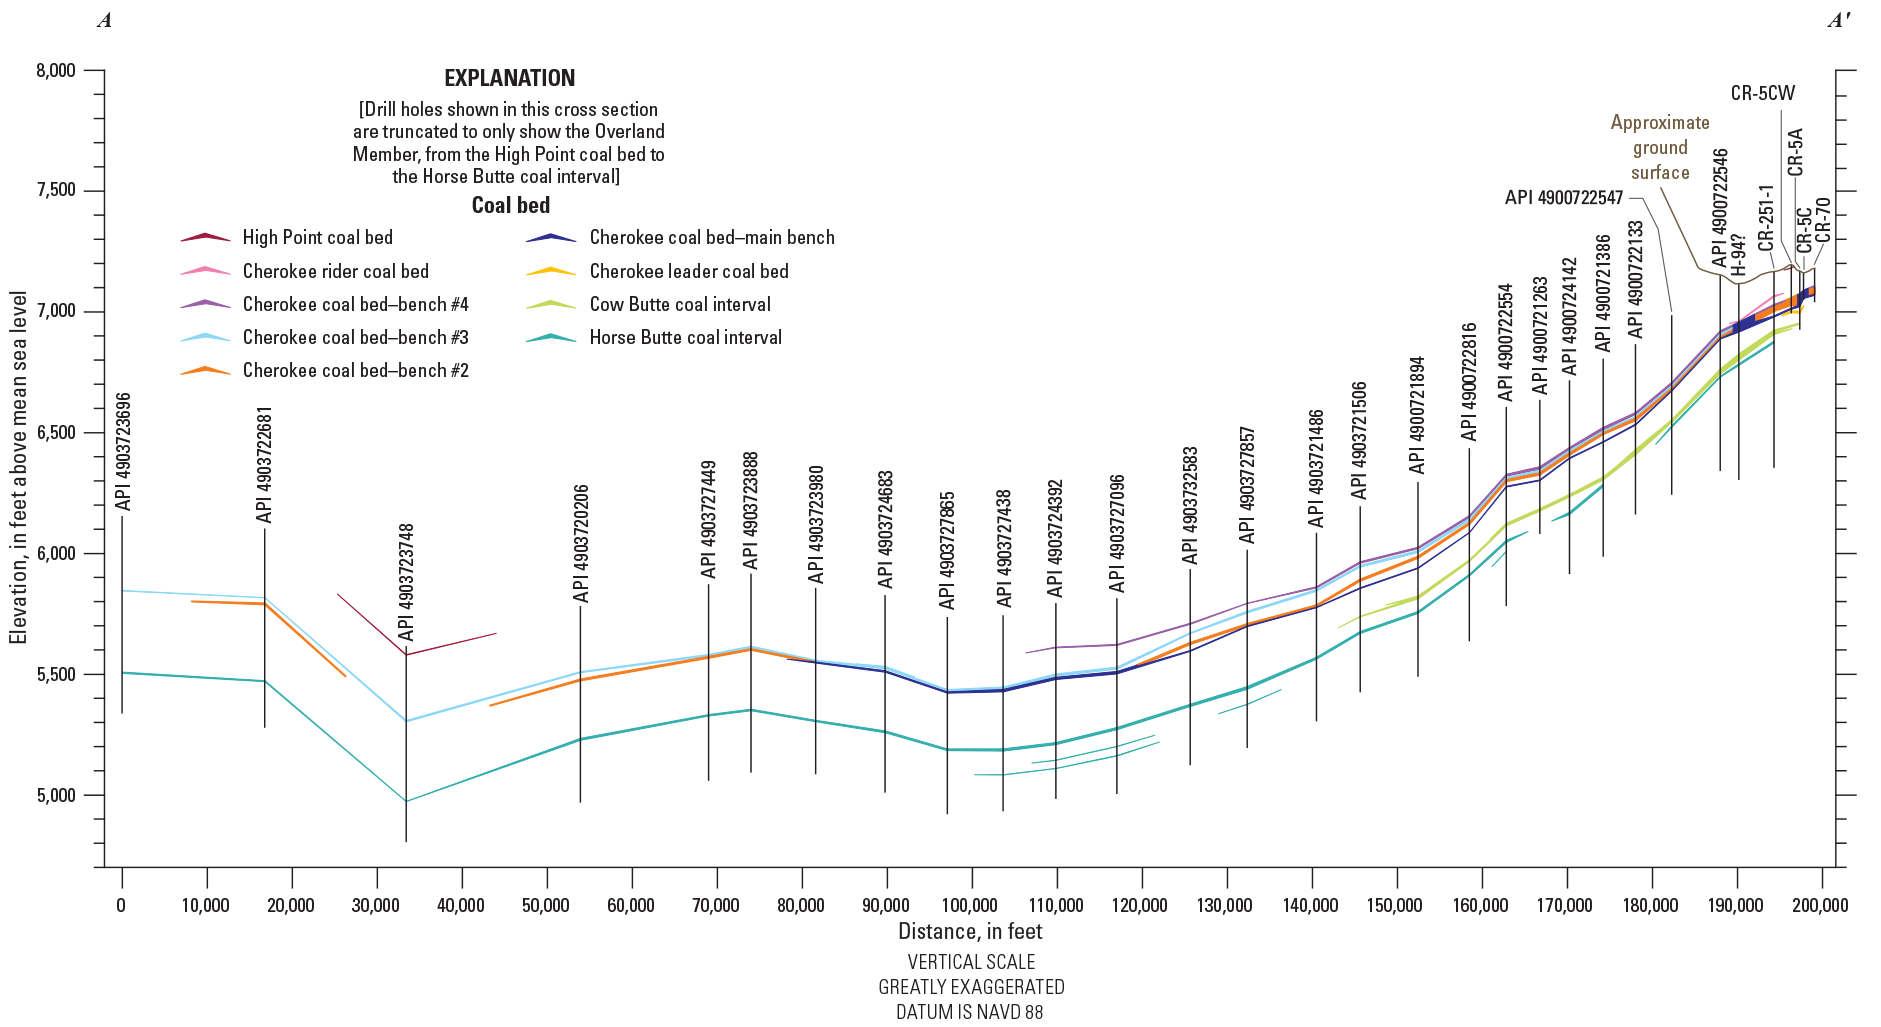
Geologic cross section A–A’. Location of the cross section is shown in figure 6. [A full-size version of figure 7 is available at https://doi.org/10.3133/sir20235067.]
Cross section B–B’ (fig. 8) is a north to south section showing the individual benches of the Cherokee coal bed in the central and western parts of the study area. The Cherokee bench #2 is combined with the Cherokee main bench in most of the section. Where the benches are combined, the bed is referred to as the Cherokee main bench. The lateral persistence of the Horse Butte coal interval in this part of the study area should also be noted. The coal beds in this cross section ride over the anticlinal Wamsutter arch.
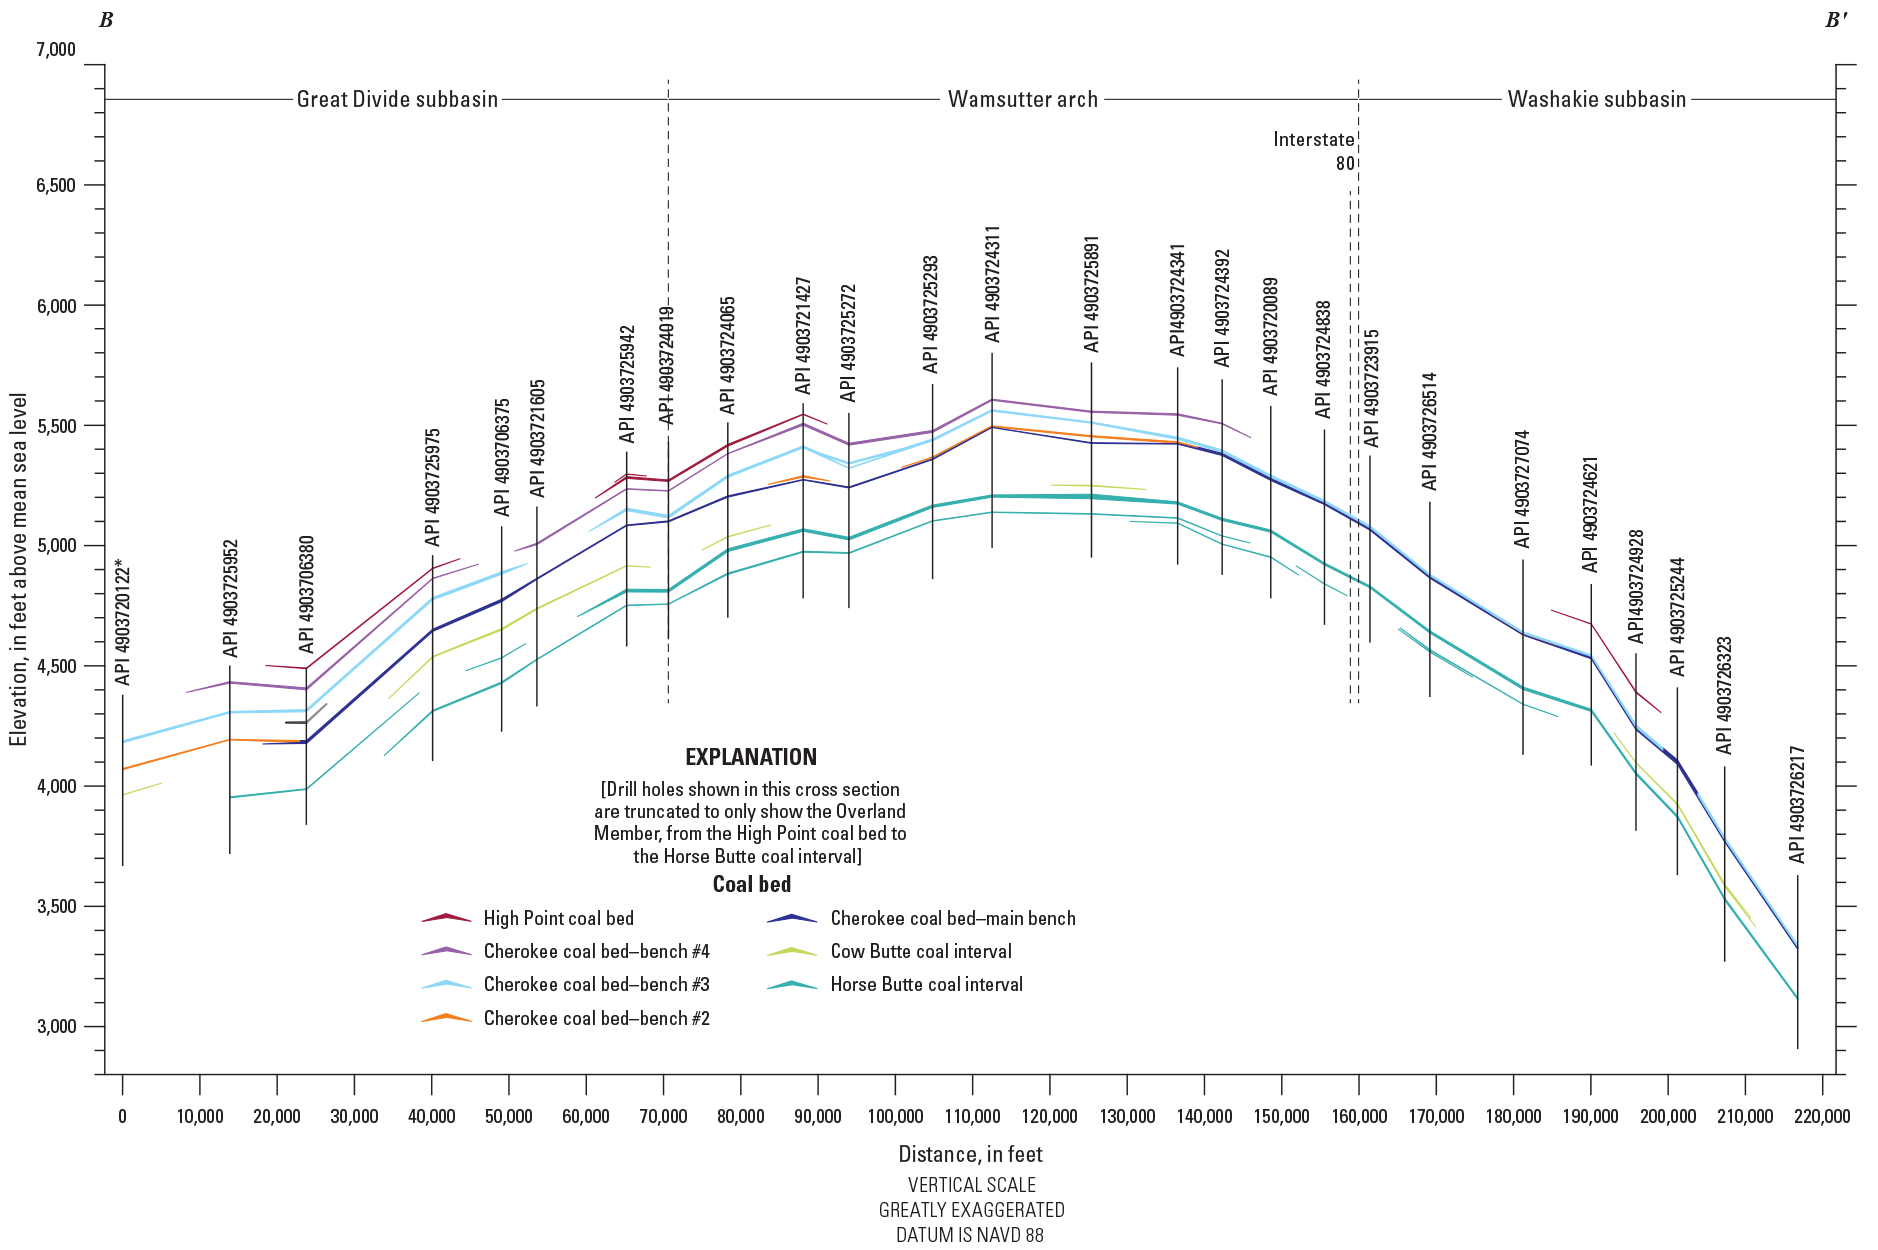
Geologic cross section B–B’. Location of the cross section is shown in figure 6. [A full-size version of figure 8 is available at https://doi.org/10.3133/sir20235067.]
Cross section C–C’ (fig. 9) is another north to south section along the eastern margin of the study area, passing through the area of the thickest Cherokee coal. Cherokee coal bench #4 splits off the thickest part of the Cherokee coal bed in the south-central part of the section. The Cherokee leader coal bed is found mainly in the north-central part of the section. The Cow Butte coal bed is thick and laterally persistent in this cross section. The coal beds in the central part of cross section C-C’ are draped over the Wamsutter arch.
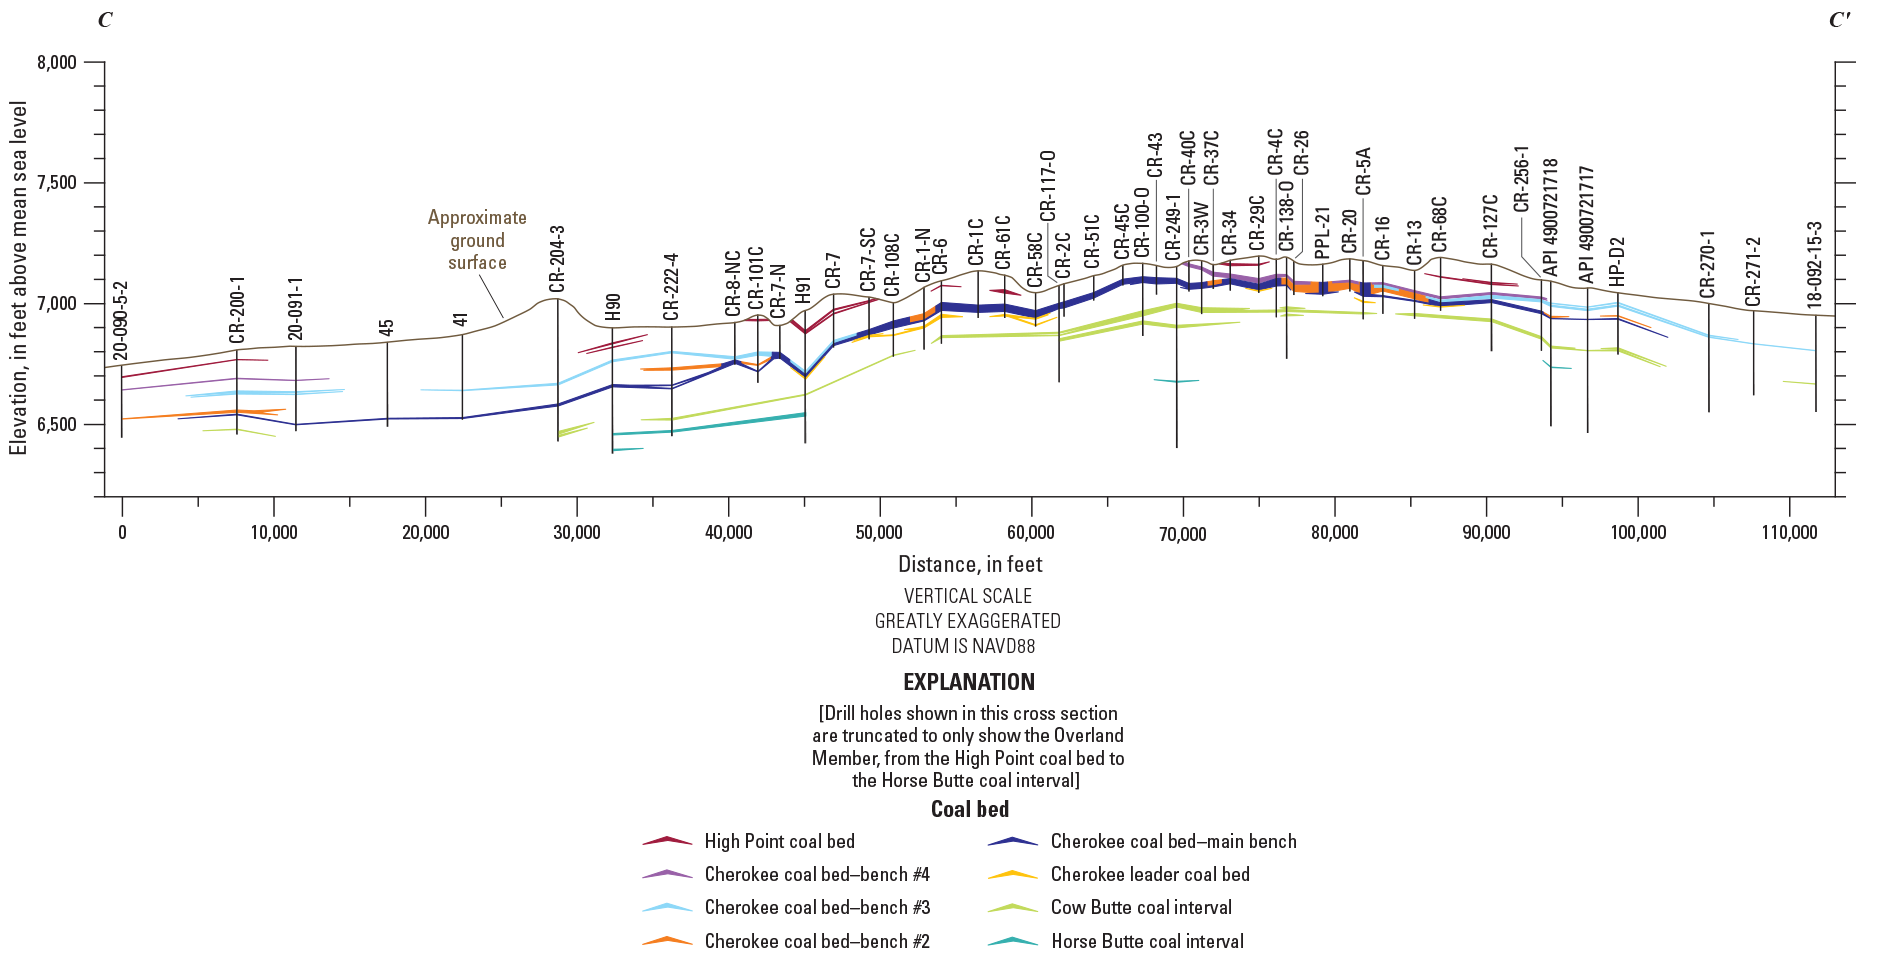
Geologic cross section C–C’. Location of the cross section is shown in figure 6. [A full-size version of figure 9 is available at https://doi.org/10.3133/sir20235067.]
Data Sources
The geological database utilized in this assessment study was compiled from data that were acquired from various sources, including the National Coal Resources Data System (NCRDS), the Wyoming Oil and Gas Conservation Commission (WOGCC), and from individual coal companies. The individual data points in the database in the study area consist of drill hole records and measured sections from outcrops (fig. 10). The database is composed of 621 data points, of which 614 are drill hole records and 7 are measured sections. Of the 614 drill hole records, 418 records are oil, gas, and coalbed methane wells downloaded from the WOGCC’s online database (Wyoming Oil and Gas Conservation Commission, 2014). The other 196 drill holes are shallower coal exploration holes from NCRDS and coal companies. All the drill hole data that comprise the geologic database used in this assessment were previously utilized in the geologic model for the recent USGS assessment of coal resources and reserves in the Little Snake River coal field and Red Desert assessment area (Scott and others, 2019) and have been published by the USGS (Haacke, 2018). These previous data have been recorrelated to provide a more detailed geologic model for the Overland Member and the Cherokee coal bed. The data with the revised correlations used in the study are available in Shaffer (2022). The thickness of the coal beds from the WOGCC drill holes (API drill holes) are interpreted from available geophysical logs by USGS personnel.
Map showing the locations and types of drill holes penetrating the Overland Member of the Fort Union Formation, and locations of measured geologic sections in the study area. (CBM, coalbed methane)
Cherokee Coal Bed Assessment
The assessment of the Cherokee coal bed in this study uses a modified assessment methodology that incorporates stochastic geostatistical methods to determine in-place and available coal resources.
Coal Density Calculations
The density value assigned to the Cherokee coal bed that was used to calculate coal resource tonnage was derived from 32 coal quality analyses reported in USGS Professional Paper 1836 (Scott and others, 2019). Analytical results for the Upper Cherokee and Lower Cherokee coal beds were not used, because they were not whole bed samples from the Cherokee coal interval.
Coal density can be calculated in terms of specific gravity using equation 1, as derived from linear regression analysis (Peter J. Bethell, Marshall Miller & Associates, Inc., unpub. data1 ):
At the time of publication, data were not available from Marshall Miller & Associates, Inc.
The coal-quality data for ash provided in Scott and others (2019) is on an as-received basis. To use the equation shown above, the ash content must be converted to a dry basis. That can be accomplished using equation 2 (American Society for Testing and Materials, 2015):
The average raw ash content of the 32 samples of the Cherokee coal bed is 13.53 percent. The average total moisture for those 32 samples is 22.38 percent. This yields an average raw, dry ash value for the Cherokee of 17.43 percent.
Using equation 1, an approximate density can be estimated from the calculated raw, dry ash value, yielding a specific gravity for the Cherokee coal bed of 1.424. Multiplying 1.424 by 62.4 (density of water in pounds per cubic foot) yields a density of 88.87 pounds per cubic foot of coal for the Cherokee coal bed in the study area. Although the density estimated for the Cherokee coal bed is higher than the values typically used for a subbituminous coal, as referenced in Wood and others (1983), the Cherokee coal bed has a relatively high average ash content that accounts for the high-density value.
Because of the relatively small number of samples (n=32) analyzed, it should be noted that the estimated average density value may have an impact on the calculation of available resources in the study. If the estimated average density was skewed by anomalous samples, then the calculated quantity (in short tons) of available resources would be similarly skewed.
Resource Assessment Calculations
The USGS is transitioning from the traditional distance-based approach to determining uncertainty in coal resources, described in Wood and others (1983), to a probabilistic approach that utilizes stochastic geostatistical methods. The coal resources for the Cherokee coal bed are calculated from data generated using the geological interpretations and the geologic model. This study builds off the application of stochastic geostatistical methods to determine uncertainty in coal resource assessments presented in Olea and others (2021). The key to the utilization of the stochastic geostatistical methodology is the generation of numerous realizations or versions of the modeled deposit that are compatible with the data and the style of spatial fluctuations. Examples of the generation of multiple realizations are shown in figure 11. Other examples of the generation of multiple realizations for in-place resources and available resources will be shown in later sections.
In-Place or Remaining Resources
The in-place or remaining coal resources for the Cherokee coal bed within the study area were calculated using stochastic geostatistical methods. One hundred different realizations, all compatible with what is known about the coal bed, were generated by sequential Gaussian simulation, with each realization being an equally likely possibility of the actual tonnage (Olea and others, 2021). Four different realizations of Cherokee coal bed in-place resources are illustrated by maps in figure 11. The first three maps (fig. 11A–C) shows three different realizations, with figure 11A showing the realization with the fifth smallest tonnage calculation, figure 11B showing the realization with the median tonnage, and figure 11C showing the realization with the fifth largest tonnage. Figure 11D shows the average in-place tonnage (E-type realization) for each cell for all 100 realizations.
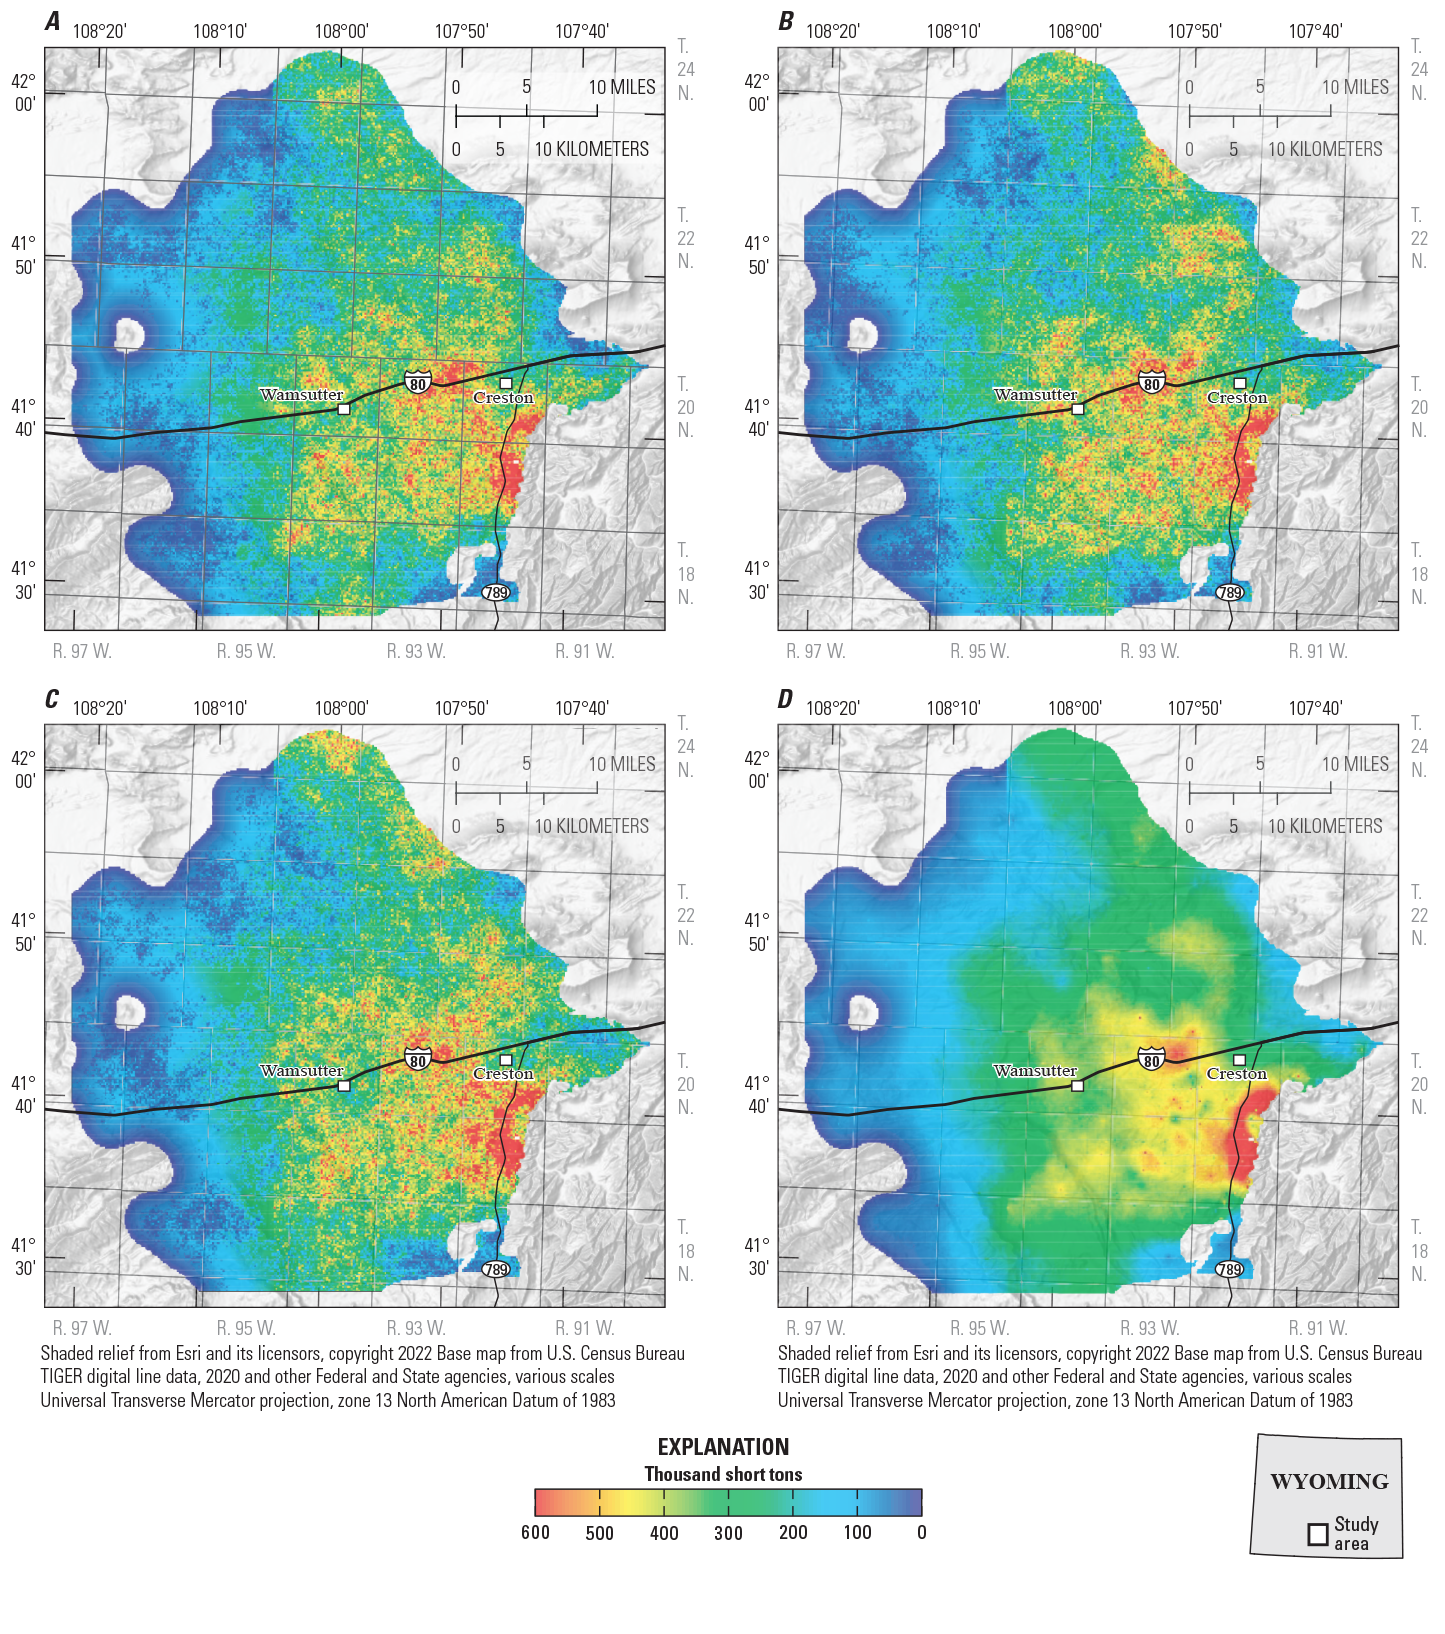
Maps showing realizations for in-place resources calculations using stochastic geostatistical methods. A, Map showing the fifth lowest tonnage calculation; B, Realization with median tonnage; C, Realization with the fifth largest tonnage; D, Average available coal resources for all 100 realizations.
If the extent and geology of a coal deposit were precisely known, which is rarely the case, it could be described by a single tonnage value. More commonly, the nature of the coal deposit is imperfectly known, which introduces uncertainty about the true tonnage, because numerous values can be calculated from the different iterations of the data. In stochastic geostatistical methodology, the difference between the 5th percentile and the 95th percentile of all possible tonnage values, called the 5–95 spread, defines the 90-percent confidence interval for the calculated tonnages. Figure 12A summarizes all the possible in-place tonnage values generated from the 100 realizations. Several facts can be discerned from figure 12A, including:
-
• There is a 75-percent probability (upper quartile) that the actual in-place tonnage is not going to exceed 15.434 billion short tons (bst).
-
• There is a 50-percent probability (median) that the actual in-place tonnage could either exceed or be less than 15.223 bst.
-
• There is a 5-percent probability (5th percentile) that the actual in-place tonnage will be less than or equal to 14.797 bst and a 95-percent probability (95th percentile) that it will be less than or equal to 15.724 bst. This implies that there is a 90-percent probability that the actual in-place tonnage is going to lie between those two values (14.797 bst and 15.724 bst).
-
• There is a 90-percent probability that the actual in-place tonnage will be 15.261 ± 0.464 bst. The value of 15.261 bst is the average of the values from the 5th percentile and the 95th percentile. The value ± 0.464 is half of the interval between the 5th percentile and 95th percentile. The formulas used to calculate the values are:
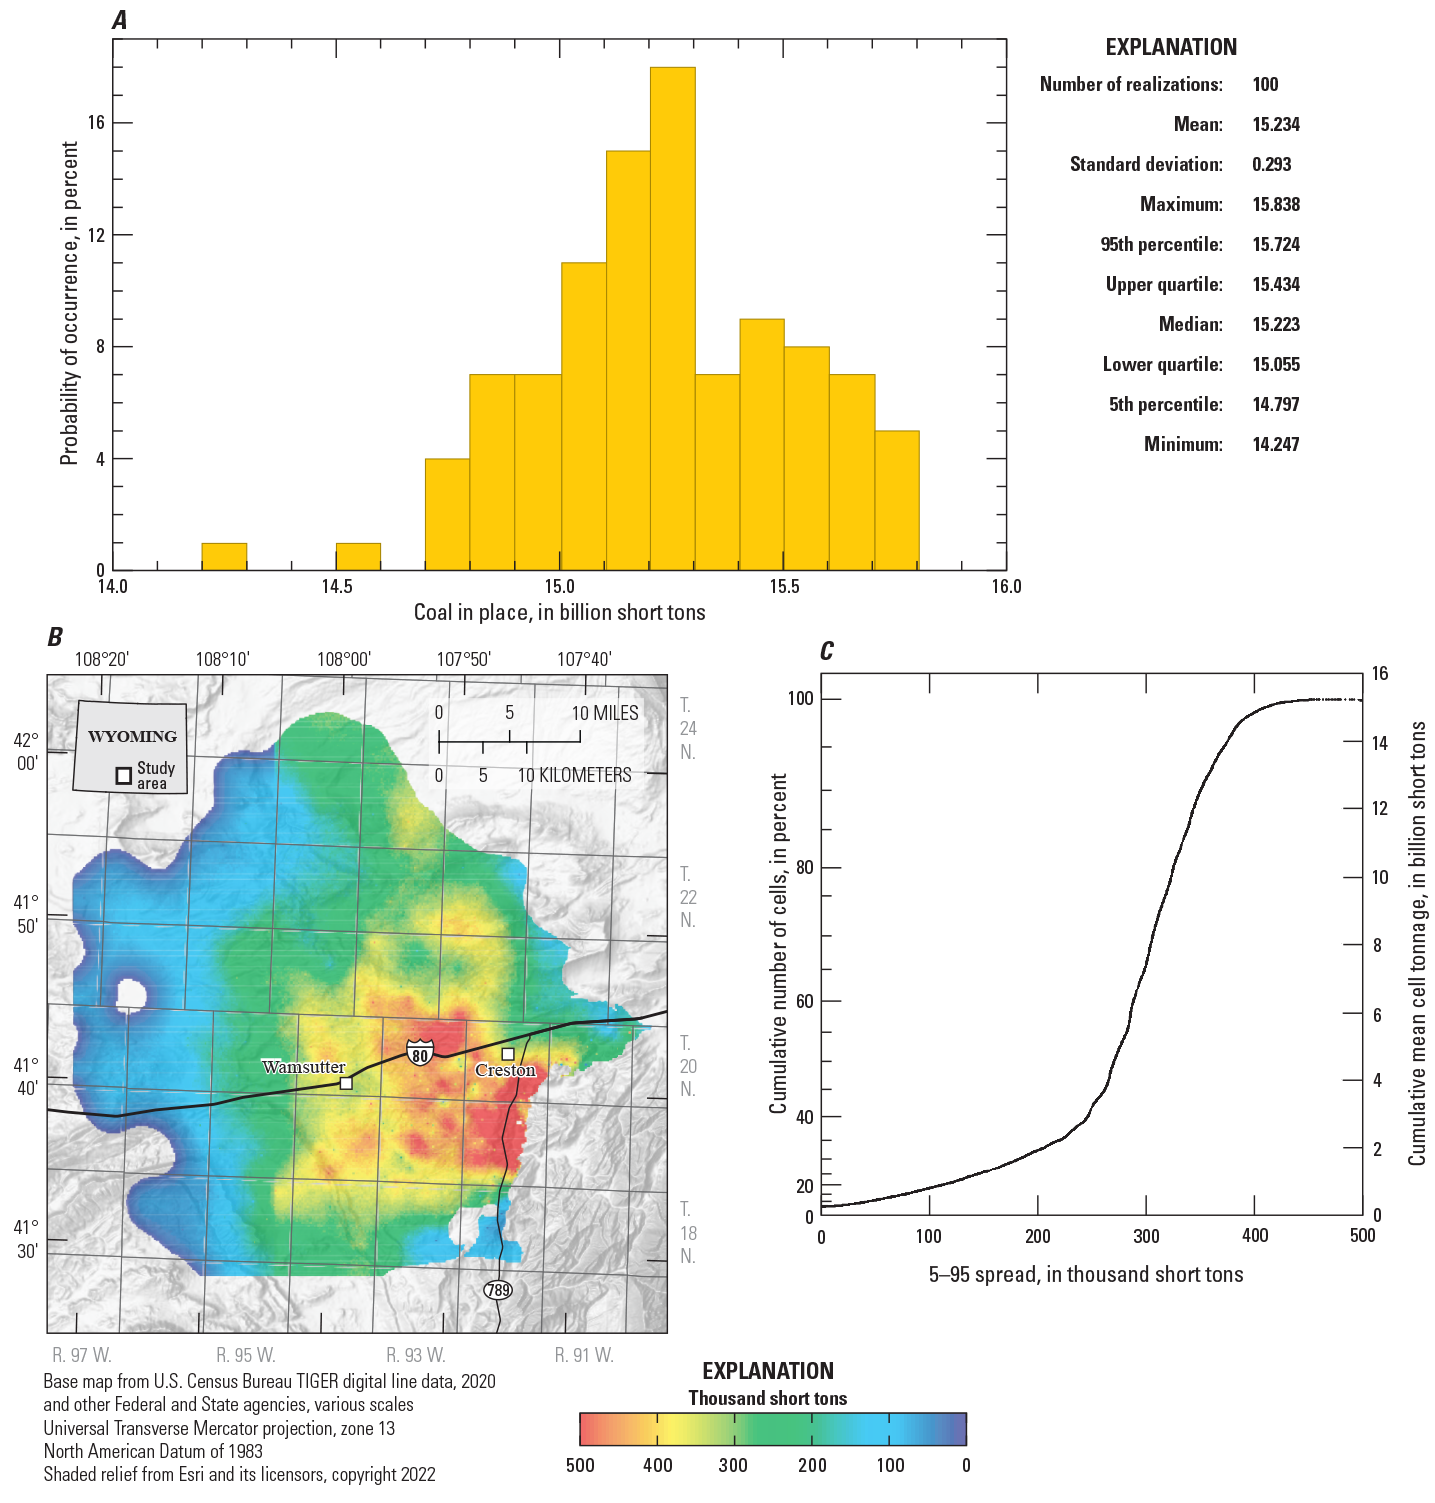
Determination of the uncertainty for in-place coal resources using 100 realizations. A, Graph showing the uncertainty in total in-place tonnage ranging from a minimum of 14.247 billion short tons (bst) to a maximum of 15.838 bst. These results are based on the 100 realizations shown in figure 11. B, Map showing the spatial fluctuations in uncertainty according to the 5–95 spread for total in-place tons at each cell in the 100 realizations in figure 11. C, Graph showing the cumulative frequency distribution fluctuations in uncertainty according to the 5–95 spread for total in-place tons at each cell in the 100 realizations in figure 11.
In mining-related assessments, there is a need to know the uncertainty not only in the total in-place tonnages, but also in the cell-by-cell uncertainty. In the distance-based approach to determining uncertainty in tonnage calculations, as described in Wood and others (1983), the magnitude of the uncertainty in the calculations was intended to be expressed within a range of distances from a data point or drill hole to the next nearest data point or drill hole. An improved method is to utilize the data generated by the 100 realizations, in which 100 values are generated for each cell. This method constitutes an improvement over the distance-based methodology of Wood and others (1983) because the uncertainty in the tonnage calculations is based on values calculated from the realizations on a cell-by-cell basis, rather than determined arbitrarily based on the distance between data points. An individual histogram could be prepared to show the tonnage fluctuations within each cell, which would result in thousands of histograms to be processed and analyzed. A more efficient approach is to prepare a map that plots the 5–95 spread for each cell. The 5–95 spread has proven to be a fairly accurate predictor of calculated tonnage, as validated with additional drilling data (Olea, 2018). The spread of 5-percent to 95-percent probability is a commonly used spread in resource assessments that provides a 90-percent certainty that the calculated tonnage will fall within that range. The stochastic geostatistical methodology used in this study allows resources to be calculated to any degree of certainty desired by the modeler. For example, a 10–90 spread may be desired, which would provide an 80-percent certainty that the calculated resources would fall within that specified range.
Figure 12B shows the spatial fluctuations in uncertainty in tonnage calculations, according to the 5–95 spread, for the total in-place tons at each cell in the 100 realizations shown in figure 11. Figure 12C shows the cumulative frequency distribution fluctuations in uncertainty, according to the 5–95 spread for the total in-place tons at each cell in the 100 realizations.
Determining Available Resources
Available coal resources are those resources that remain after certain resources are lost from the remaining or in-place resources defined in figure 1. To accurately determine the available coal resources within the study area, parameters that would limit the amount of remaining coal resources that could be available for either surface or underground mining must be defined. One set of parameters includes coal resources lost to environmental, land use, or societal restrictions. Another set of parameters are based on a variety of factors, such as geological anomalies or irregularities, weathering or oxidation zones, depths of cover, technical or mining equipment limitations (fig. 1), and regional mining methods analogs (modified from Scott and others, 2019).
Surface Mining Methods
Some of the available coal resources reported could be mined using surface mining methods. To determine available coal resources that meet the parameters for using surface mining methods, parameters for surface mining need to be established. Those parameters can then be applied to the geologic model to determine the aerial extent of hypothetical surface mining. The available coal resources are calculated from the aerial extent of the hypothetical surface mining, based on the surface mining parameters.
Methods Parameters
The following parameters are used in this study to determine available resources that meet the parameters for surface mining methods:
-
• A minimum depth of cover of 25 feet, to avoid inclusion of weathered and oxidized coal.
-
• A maximum depth of 300 feet.
-
• A maximum stripping ratio of 10:1.
-
• A minimum coal thickness of 2.0 feet for the extraction of individual coal benches.
-
• A minimum cumulative coal thickness of 4.0 feet for the extraction of multiple coal benches.
The stripping ratio is the ratio of cubic feet of overburden to the tons of coal underlying the same area of overburden. For example, 75 feet of overburden overlying a coal bed, assuming a 1 yard by 1 yard area, converts to 675 cubic feet or 25 bank cubic yards of overburden. The term “bank” indicates that the overburden is intact, and no bulking factor has been applied. If the coal bed is 10 feet thick, with a density of 80 pounds per cubic feet, then there would be 7,200 pounds or 3.6 short tons of coal beneath the overburden. The stripping ratio would be 25 cubic yards of overburden to 3.6 short tons of coal, or 6.94:1.
Available Surface Mining Resources
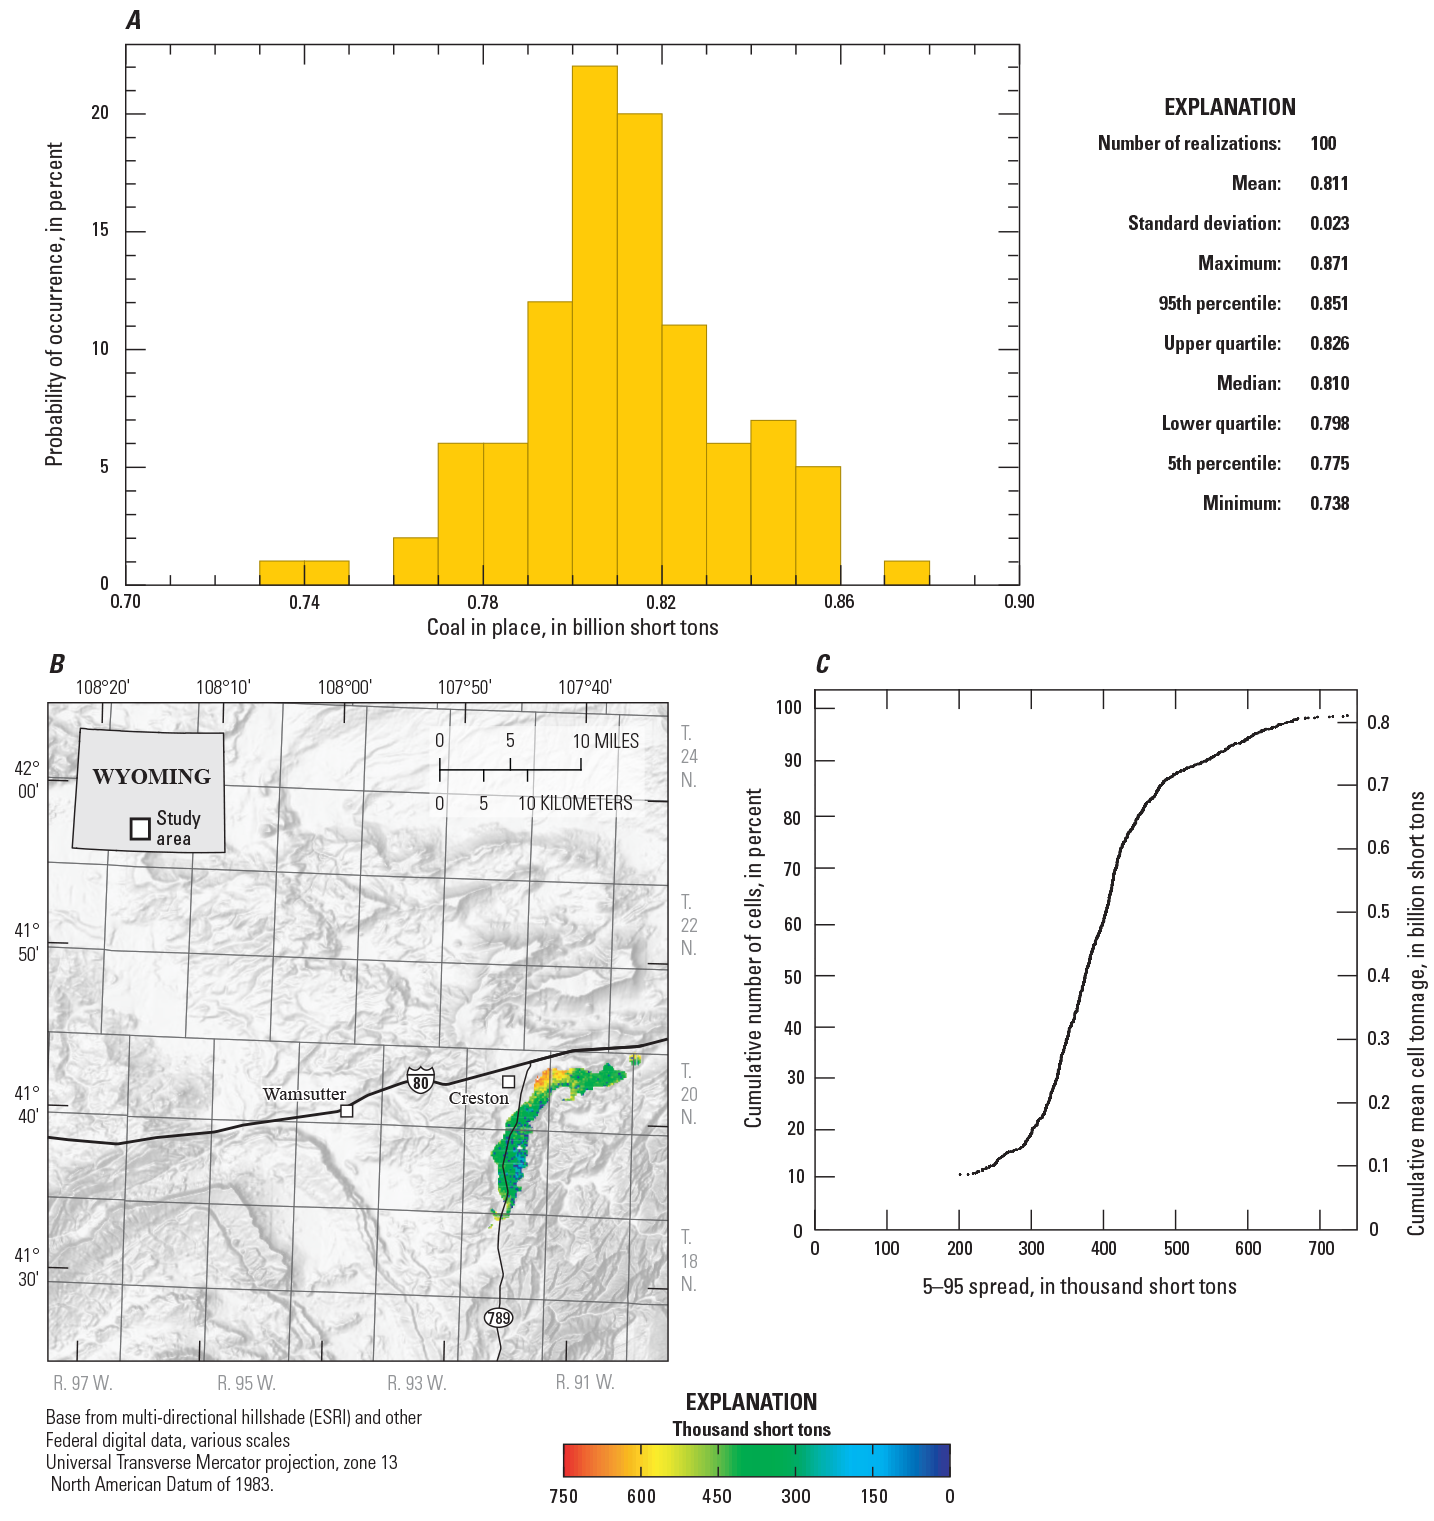
Available coal resources for the Cherokee coal bed that meet the parameters for surface mining methods within the study area were estimated using stochastic geostatistical methods that generated 100 different realizations, as previously discussed. Four different realizations for available Cherokee coal bed resources that meet the parameters for the use of surface mining methods are illustrated in figure 13. The first three maps (fig. 13A–C) shows different realizations, with figure 13A showing the realization with the fifth smallest tonnage calculation, figure 13B showing the realization with the median tonnage, and figure 13C showing the realization with the fifth largest tonnage. The fourth map, figure 13D, shows the average available coal resources tonnage that meet the parameters for surface mining methods at each cell for all 100 realizations (E-type realization). Figure 14A shows the uncertainty in the available resources that meet the parameters for surface mining methods from values generated from the 100 realizations shown in figure 13. The minimum tonnage calculated from those realizations is 0.738 billion short tons (bst). The maximum tonnage calculated is 0.871 bst. The mean or average tonnage calculated from those 100 realizations is 0.811 bst. The available resources that meet the parameters for surface mining methods for the Cherokee coal bed, as calculated from values within the 5–95 spread, or within the 90-percent confidence interval, is 0.813 ± 0.038 bst.
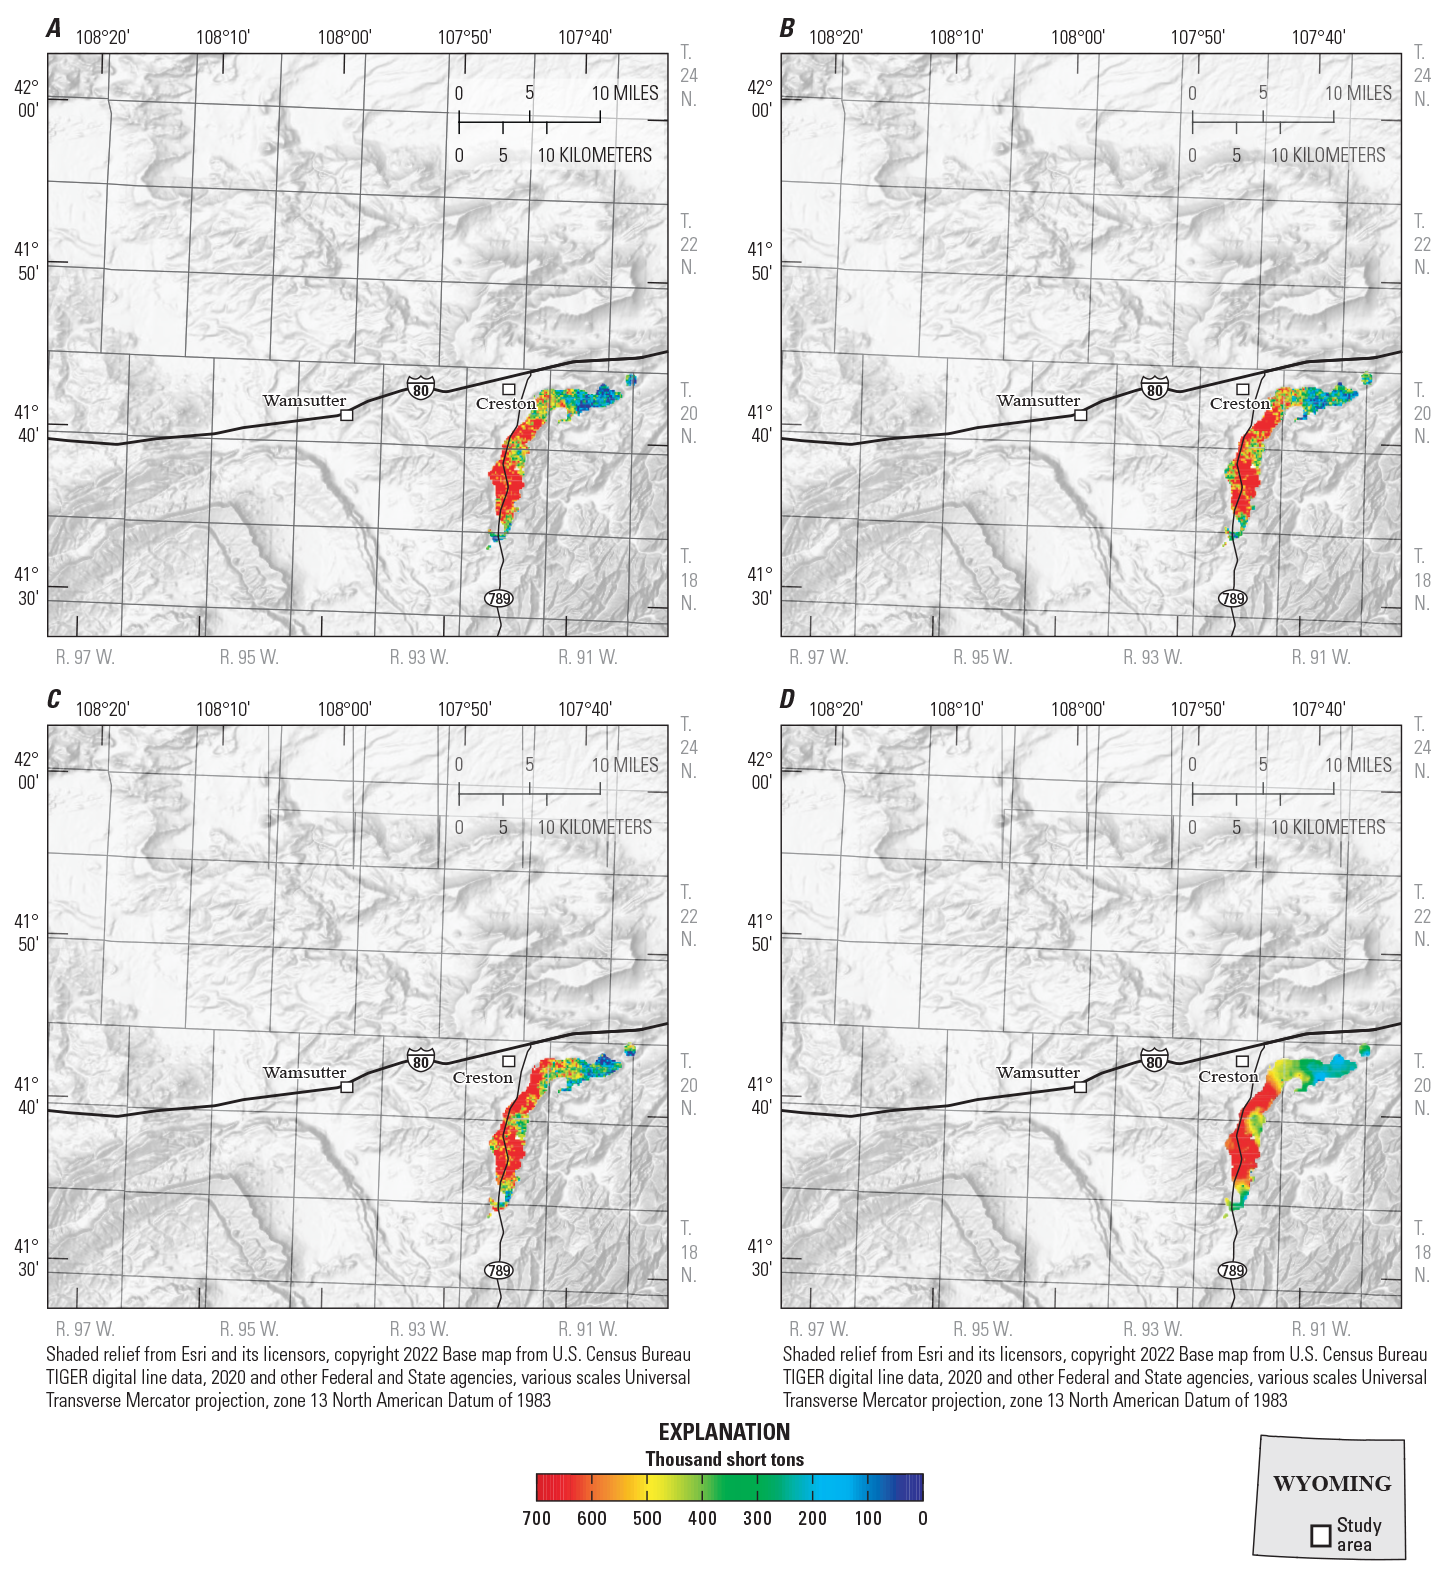
Maps showing realizations for available resources that meet the parameters for surface mining methods using stochastic geostatistical methods. A, Map showing the fifth smallest tonnage calculation; B, Realization with median tonnage; C, Realization with the fifth largest tonnage; D, Average available coal resources for all 100 realizations.
Determination of the uncertainty for available coal resources that meet the parameters for surface mining methods using 100 realizations. A, Graph showing the uncertainty in tons of available coal resources that meet the parameters for surface mining methods from a minimum of 0.738 billion short tons (bst) to a maximum of 0.871 bst. These results are based on the 100 realizations shown in figure 13. B, Map showing the spatial fluctuations in uncertainty according to the 5–95 spread for tons on available coal resources that meet the parameters for surface mining methods at each cell in the 100 realizations in figure 13. C, Graph showing the cumulative frequency distribution fluctuations in uncertainty according to the 5–95 spread for tons of available coal resources that meet the parameters for surface mining methods at each cell in the 100 realizations in figure 13.
Figure 14B shows the spatial fluctuations in uncertainty, according to the 5–95 spread, for the available coal resources that meet the parameters for the use of surface mining methods at each cell in the 100 realizations shown in figure 13. Figure 14C shows the cumulative frequency distribution fluctuations in uncertainty, according to the 5–95 spread, for the available coal resources that meet the parameters for surface mining methods at each cell in the 100 realizations.
Underground Mining Methods
Much of the available coal resources reported are too deep below the surface to possibly be mined by surface mining methods, so underground coal mining methods would need to be utilized. To determine available coal resources that meet the parameters for underground mining methods, parameters for underground mining need to be established. Those parameters can then be applied to the geologic model to determine the aerial extent of the hypothetical underground mining horizon. The available coal resources are calculated from the aerial extent of the hypothetical underground mining horizon, based on the underground mining parameters.
Underground Mining Methods Parameters
The following parameters are used in this assessment study to determine available resources that could be extracted using underground mining methods:
-
• A minimum depth of cover of 300 feet.
-
• A maximum depth of cover of 3,000 feet.
-
• A minimum mining height of 8 feet.
-
• A maximum mining height of 15 feet.
-
• A minimum of 4.0 feet of coal left in the mine roof for ground control.
-
• A maximum of 5.0 feet of partings in the mining horizon.
The minimum and maximum mining heights are based on the projected size and reach of a longwall shearing machine. Using 7.5 ft. shearer drums (the round drums mounted on a longwall shearer that are used to cut the coal) would limit the minimum mining height to 8 feet to insure clearance of the shearer and drums under the protective canopy of the longwall shields. The same size shearer drums would limit the maximum mining height to approximately 15 feet.
The purpose for leaving a minimum of 4.0 feet of coal in the mine roof is to insure the stability of the mine roof in the projected underground mine workings. The strata in the roof of a hypothetical Cherokee coal bed underground mine are projected to be unconsolidated and weak. This is based on an underground mining analog in the Hanna Basin, to the east of the study area, in similarly aged strata, where at least four feet of coal had to be left in the roof to maintain its stability due to the overlying strata being fractured and unconsolidated (Charles N. Thompson, Thompson Geo Service, Inc., oral commun., 2020).
Hypothetical Underground Mining Horizons
A series of geologic cross sections were developed to show hypothetical mining horizons in the benches of the Cherokee coal bed that meet the parameters for underground mining methods (fig. 15). The hypothetical mining horizon within the Cherokee coal bed differs depending on the thickness of the individual benches and the rock partings that separate those benches. The horizons may also vary based on compliance to the underground mining methods parameters described in the “Underground Mining Methods Parameters” section. The correlation datum for all the cross sections described in this section is the base of the Cherokee main bench.
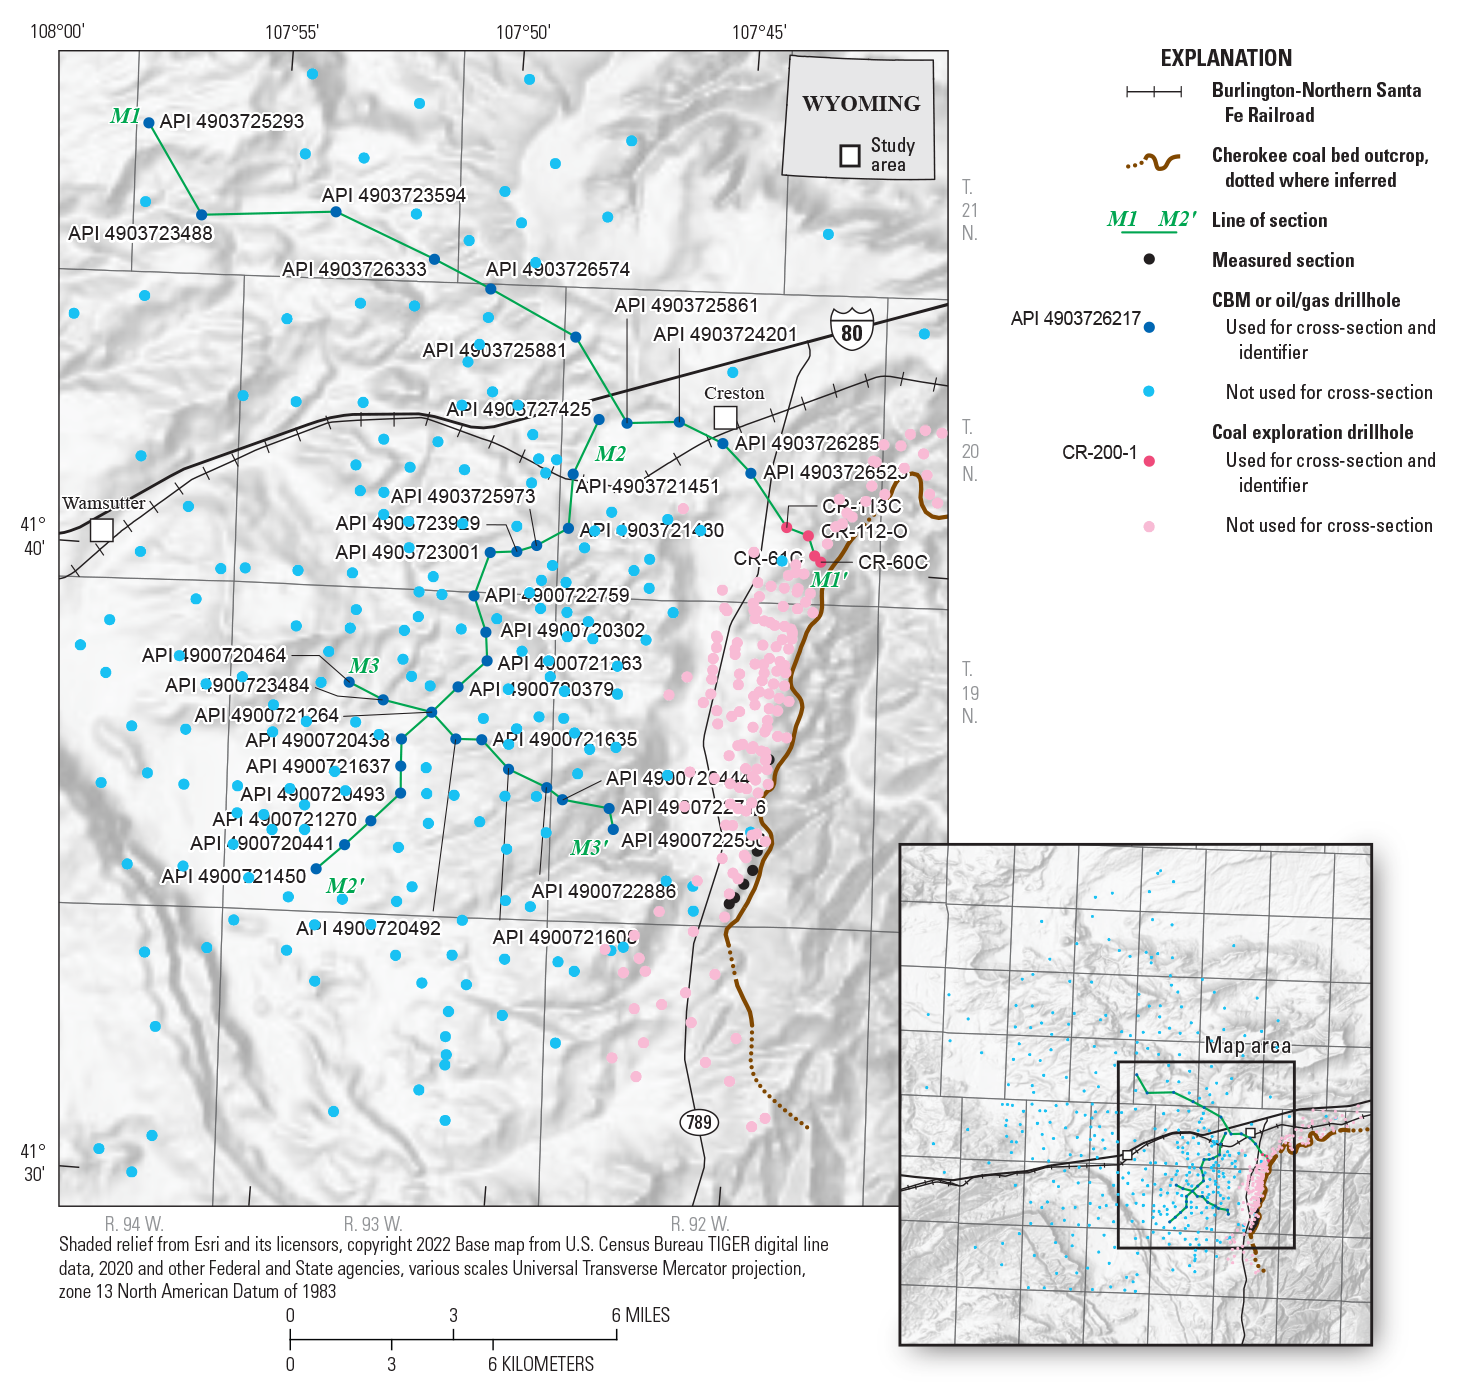
Map showing the locations of the mining cross sections. Identification numbers are shown for drill holes used in the sections.
Cross section M1–M1’ (fig. 16) is a west to east cross section that anticipates where underground mining in the Cherokee coal bed may be initiated – in the eastern part of the section, where depths of cover are the lowest. Underground operations could commence by driving drift entries into the Cherokee coal bed at the base of the highwall after initial surface mining operations. Initial underground mining operations could be conducted in a thick part of the bed, which comprises the main bench, bench #2, and bench #3. Mining operations could continue westward until a parting is encountered that splits the combined main bench and bench #2 away from bench #3. That parting quickly thickens to greater than 5 feet in the vicinity of drill hole API 4903723594, which exceeds the maximum parting thickness parameter.
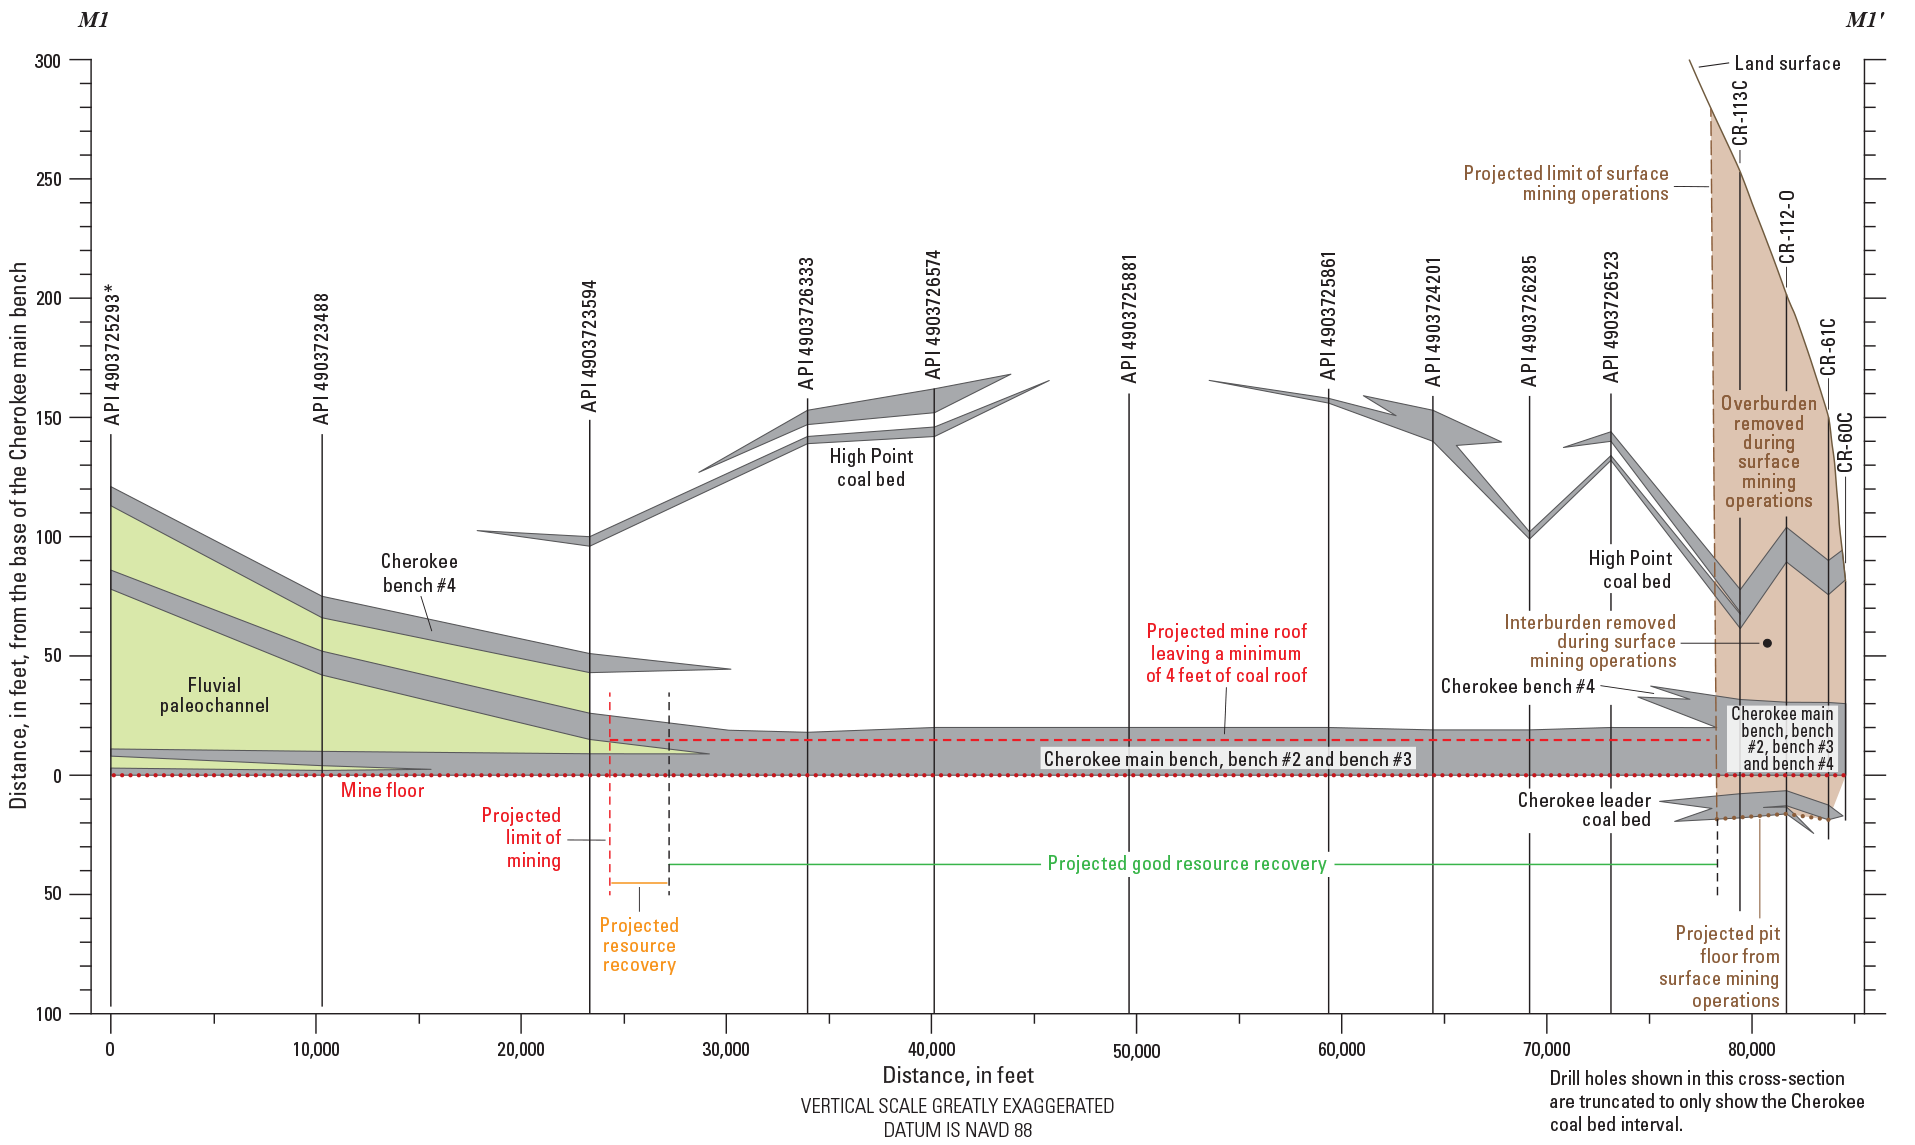
Cross section M1–M1’. Location of the cross section is shown in figure 15. [A full-size version of figure 16 is available at https://doi.org/10.3133/sir20235067.]
Cross section M2–M2’ (fig. 17) is a north-south section that shows the transition of mining operations from bench to bench in the Cherokee coal interval. On the north (left) side of cross section M2–M2’, mining would be projected to occur in a thick part of the Cherokee, as identified in cross section M1–M1’. As mining operations proceed to the south (to the right on cross section M2–M2’), a parting is encountered that splits the main bench and bench #2. As this parting thickens south of drill hole API 4903723001, the mining horizon could migrate upward, ramping up on the parting to mine in bench #2 and bench #3. Another parting is encountered in the vicinity of drill hole API 4903723001 that splits bench #2 and bench #3. Mining operations could then continue to the south in the cross section, extracting bench #2 and bench #3. Near drill hole API 4900720379, the parting splitting bench #2 and bench #3 thickens rapidly, forcing mining operations again to ramp upwards on top of this parting. Projected mining operations could continue to the south, mining in bench #3 and bench #4. Mining operations could continue to the south until the parting separating bench #3 and bench #4 reaches the constraining parameter of a minimum thickness of 5 feet.
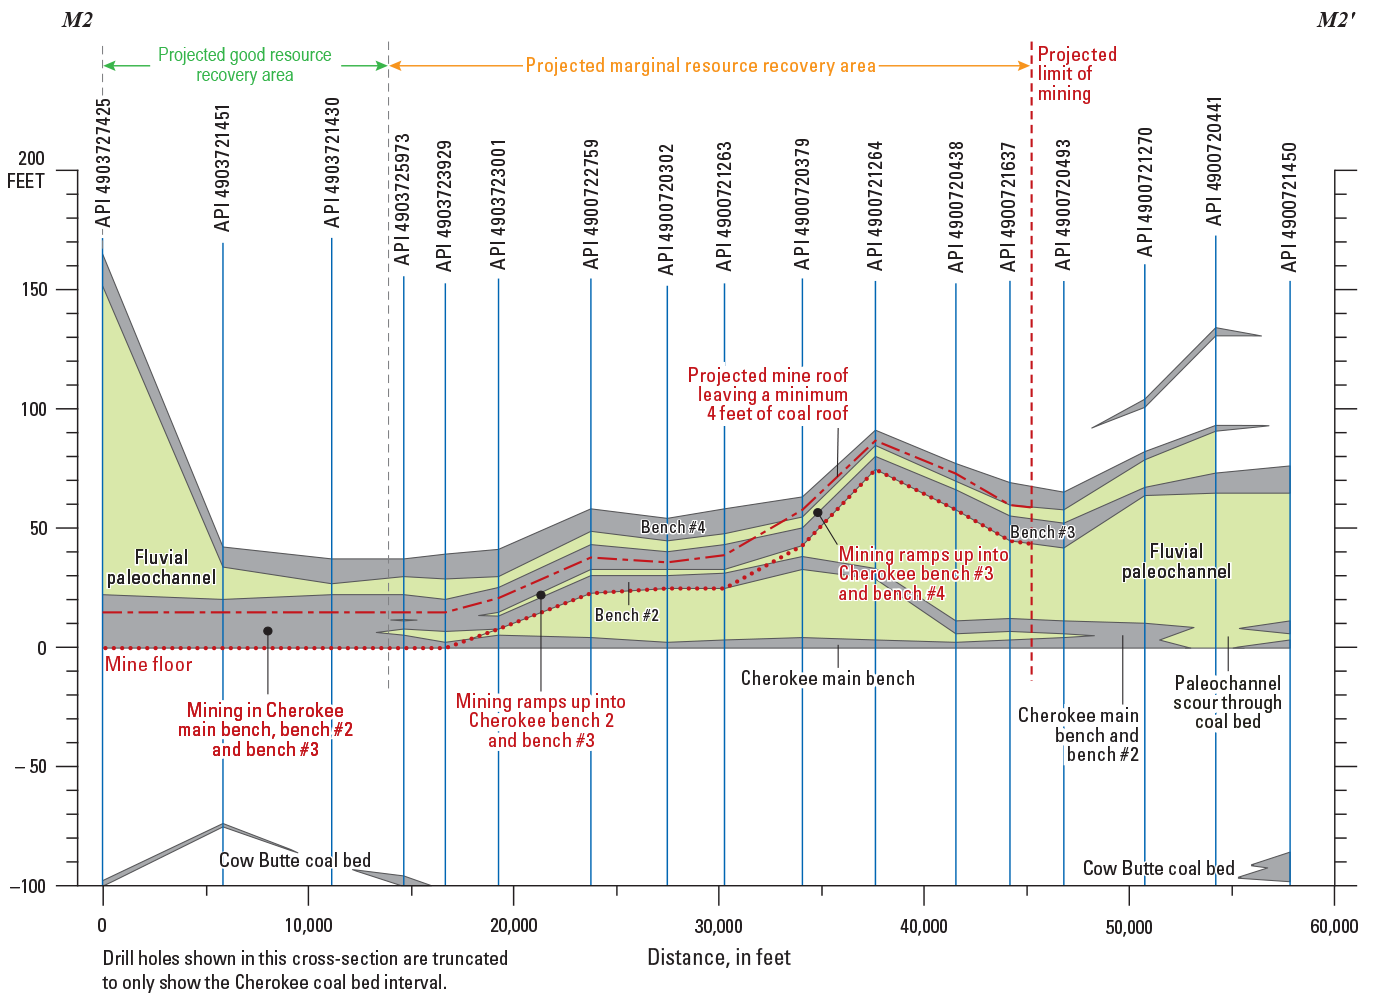
Cross section M2–M2’. Location of the cross section is shown in figure 15. [A full-size version of figure 17 is available at https://doi.org/10.3133/sir20235067.]
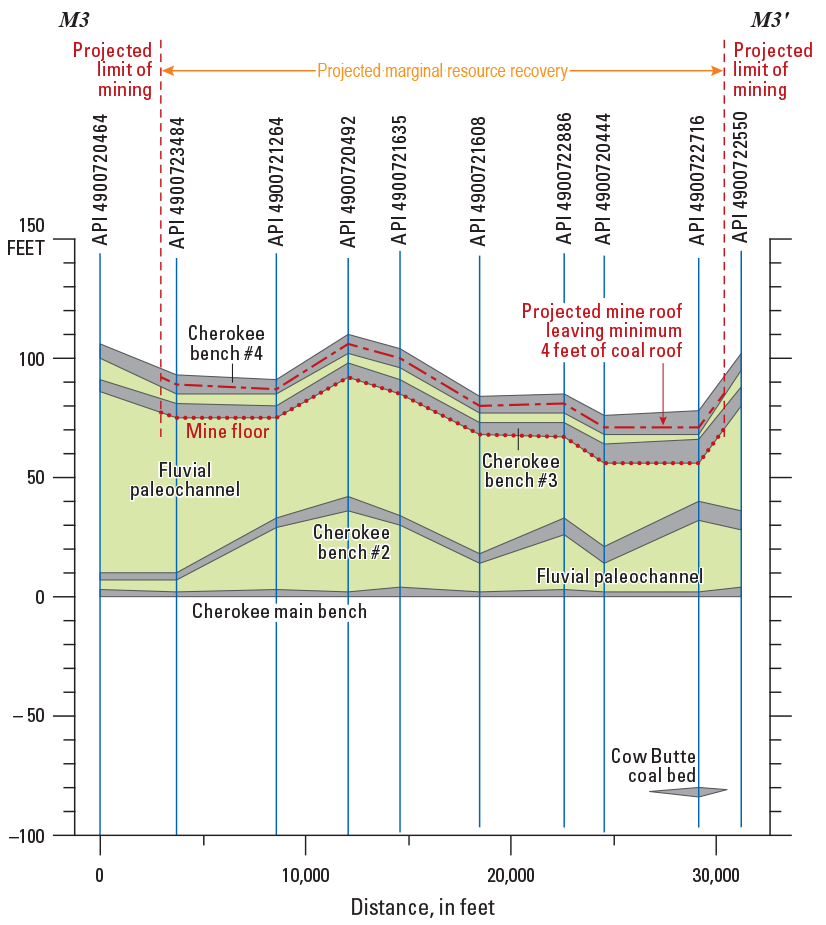
Cross section M3–M3’ (fig. 18) is another west to east section that intersects the southern part of cross section M2–M2’. Cross section M3–M3’ shows continued mining operations in a horizon comprising bench #3, bench #4, and a parting separating those benches. The projected limit of potential mining operations is reached on both edges of the cross section where the thickness of the parting separating bench #3 from bench #4 exceeds 5 feet. Because of the rapid thickening and thinning of the partings in the Cherokee coal interval below bench #3, floor rolls, faults, and other differential compaction features may be encountered during mining operations.
Cross section M3–M3’. Location of the cross section is shown in figure 15. A full-size version of figure 18 is available at https://doi.org/10.3133/sir20235067.]
Available Underground Mining Resources
Available coal resources for the Cherokee coal bed that meet the parameters for underground mining methods within the study area were estimated using stochastic geostatistical methods to generate 100 different realizations, as previously discussed. Four different realizations for available Cherokee coal bed resources that meet the parameters for underground mining methods are illustrated by maps in figure 19. The first three maps (fig. 19A–C) shows three different realizations, with figure 19A showing the realization with the fifth smallest tonnage calculation, figure 19B showing the realization with the median tonnage, and figure 19C showing the realization with the fifth largest tonnage. The fourth map (fig. 19D) shows the average available coal resources that meet the parameters for underground mining methods at each cell for all 100 realizations (E-type realization). Figure 20A shows the uncertainty in the available resources that meet the parameters for underground mining methods generated from the 100 realizations. The minimum tonnage calculated from those realizations is 2.381 billion short tons (bst). The maximum tonnage calculated is 2.469 bst. The mean tonnage calculated from those 100 realizations is 2.418 bst. The available resources that meet the parameters for underground mining methods for the Cherokee coal bed, as calculated from values within the 5–95 spread, or within the 90-percent confidence interval, is 2.393 ± 0.055 bst.
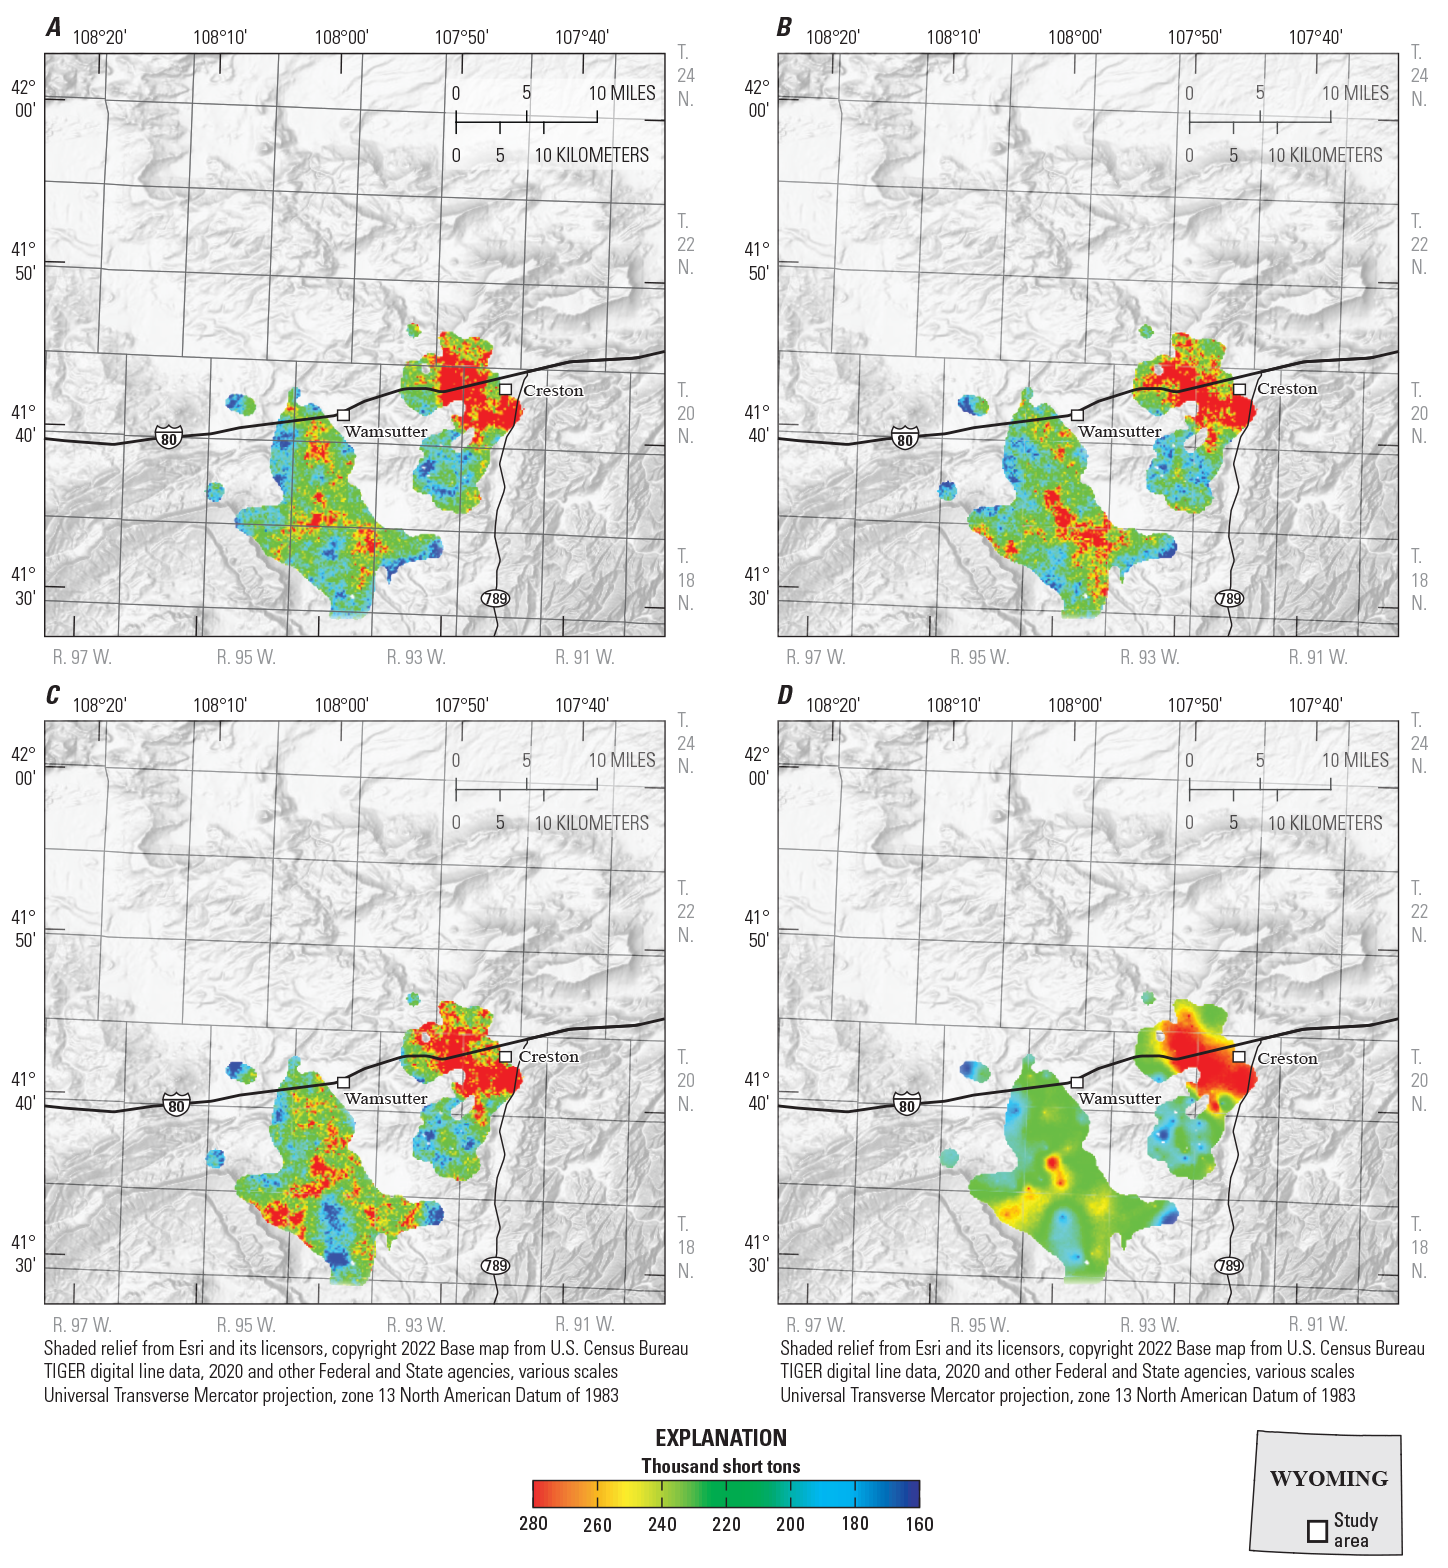
Maps showing realizations for available resources that meet the parameters for underground mining methods using stochastic geostatistical methods. A, Map showing the fifth smallest tonnage calculation; B, Realization with median tonnage; C, Realization with the fifth largest tonnage; D, Average available coal resources for all 100 realizations.
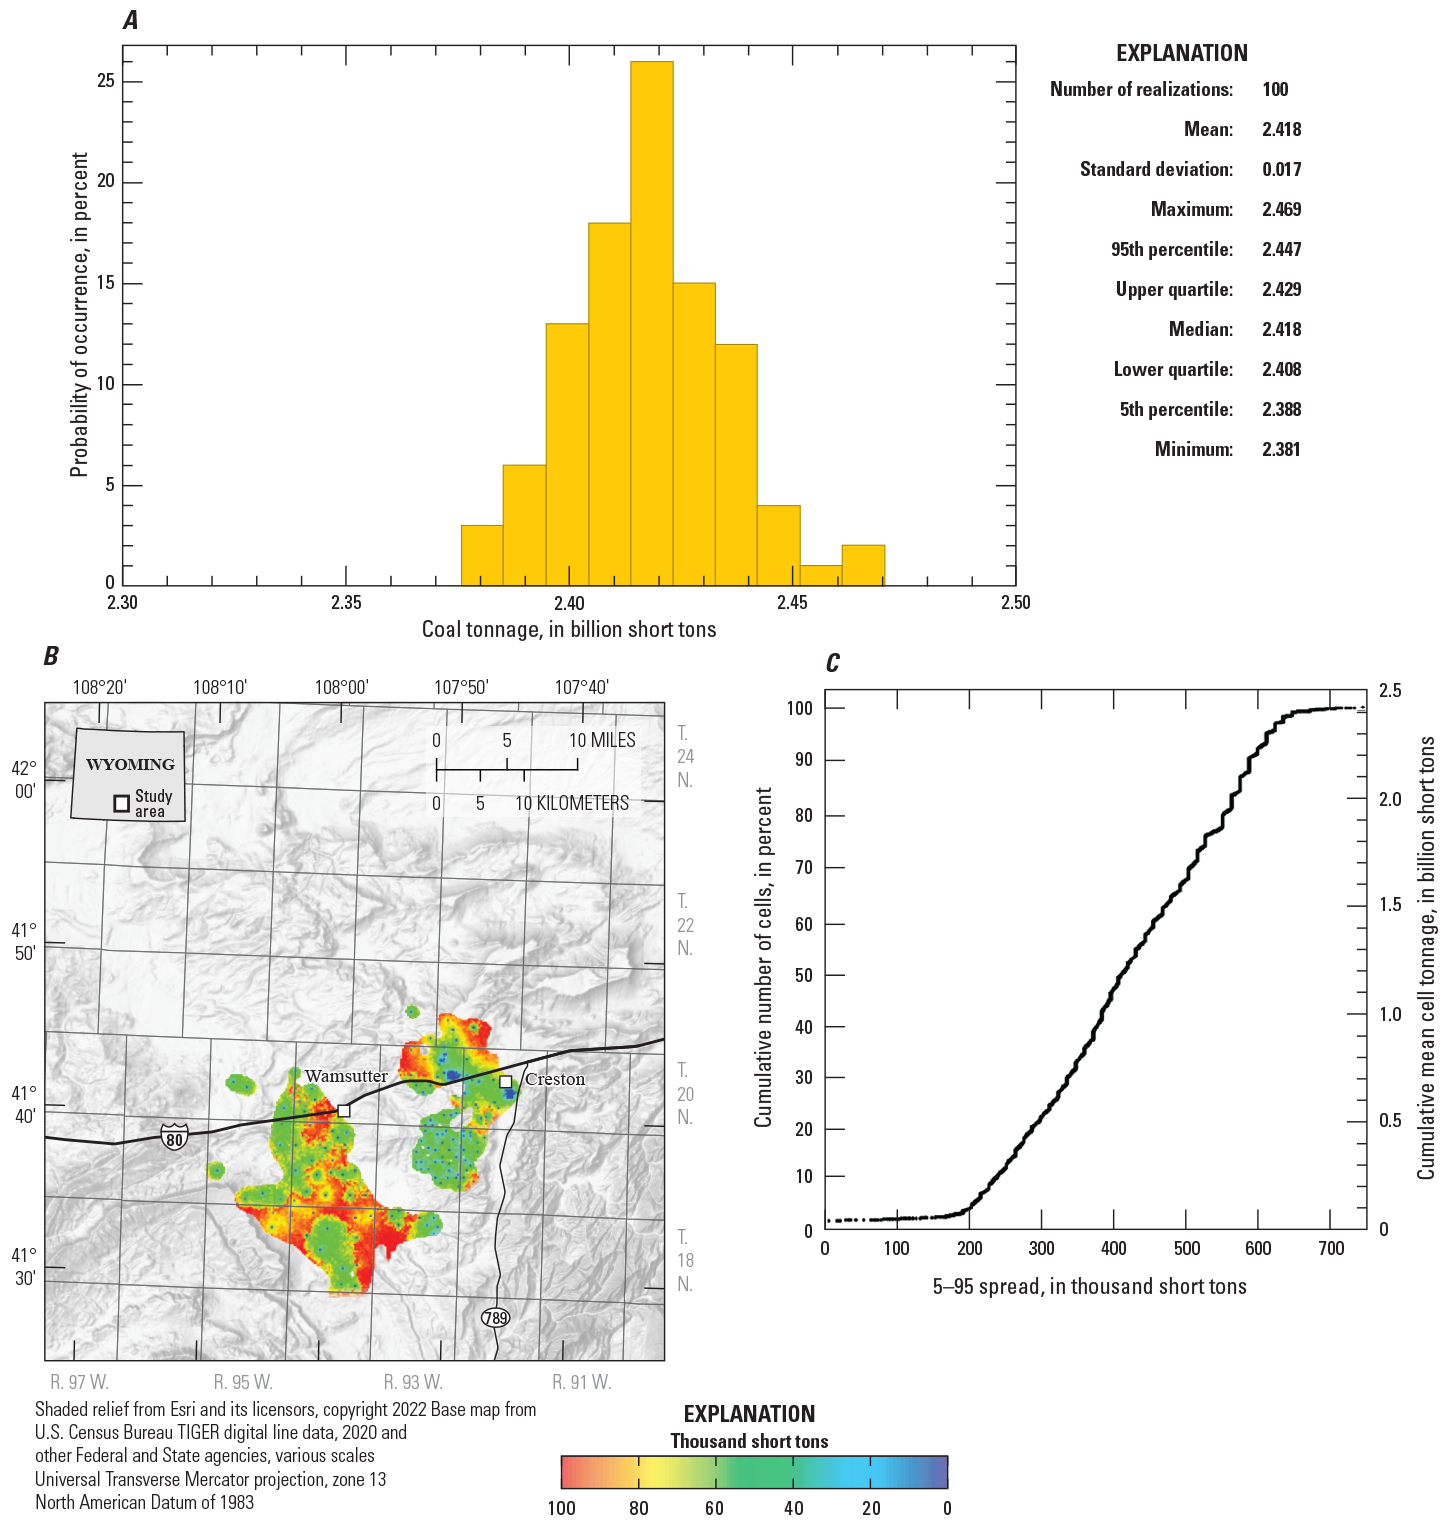
Determination of the uncertainty for available coal resources that meet the parameters for underground mining methods using 100 realizations. A, Graph showing the uncertainty in tons of available coal resources that meet the parameters for underground mining methods from a minimum of 2.381 billion short tons (bst) to a maximum of 2.469 bst. These results are based on the 100 realizations shown in figure 19. B, Map showing the spatial fluctuations in uncertainty according to the 5–95 spread for tons of available coal resources that meet the parameters for underground mining methods at each cell in the 100 realizations in figure 19. C, Graph showing the cumulative frequency distribution fluctuations in uncertainty according to the 5–95 spread for tons of available coal resources that meet the parameters for underground mining methods at each cell in the 100 realizations in figure 19.
Figure 20B shows the spatial fluctuations in uncertainty, according to the 5–95 spread, for the available coal resources that meet the parameters for underground mining methods at each cell in the 100 realizations. Figure 20C shows the cumulative frequency distribution fluctuations in uncertainty, according to the 5–95 spread, for the available coal resources that meet the parameters for underground mining methods at each cell in the 100 realizations shown in figure 19.
Results and Conclusions
This study continues an ongoing process in the U.S. Geological Survey to transition from the traditional methods used to calculate in-place coal resources and available resources to calculating them using stochastic geostatistical methods. The main difference in the methods is that, in the past, the distance to the closest drill hole has been used an indicator of the degree of uncertainty in resource calculations, which is an approach that has proved to be inadequate in quantifying the uncertainty. Another significant improvement relates to the consistency in calculating the uncertainty. In the geostatistical approach, the estimated tonnages and their uncertainty are calculated using the same mathematical model. In past USGS coal assessments, uncertainty classifications were independent of the methods used for calculating the tonnages. Despite these important differences in the methodologies, the authors’ experience is that the mean tonnages calculated using the stochastic geostatistical methods are comparable to those of the different tonnage calculation methods used in the past, when using the same data, geologic assumptions, and mining parameters. The advantage of the stochastic geostatistical methods is that the reliability is now quantifiable and aligns with criteria used in risk assessments in other disciplines.
Stochastic geostatistical methods were used to make a resource assessment of the Cherokee coal bed, a locally thick coal in the eastern part of the Greater Green River Basin in south-central Wyoming. This study also used an analysis of the limiting parameters, based on current practices and available technology for surface and underground mining methods, to logically estimate available coal resources.
In summary, the results of this study show:
-
• 15.261 ± 0.464 billion short tons (bst) of in-place coal resources for the Cherokee coal bed within the study area, with a 90-percent confidence interval.
-
• 0.813 ± 0.038 bst of available coal resources that meet the parameters for surface mining methods, with a 90-percent confidence interval, after subtracting coal resources lost to restrictions, geological factors, and technical limitations.
-
• 2.393 ± 0.055 bst of available coal resources that could meet the parameters for underground mining methods, with a 90-percent confidence interval, after subtracting coal resources lost to restrictions, geological factors, and technical limitations.
References Cited
American Society for Testing and Materials, 2015, D3180-15 Standard Practice for Calculating Coal and Coke Analyses from As-Determined to Different Bases: West Conshohoken, PA, ASTM International, accessed October 1, 2020, at https://compass.astm.org/document/?contentCode=ASTM%7CD3180-15%7Cen-US.
Haacke, J.E., 2018, Coal drill hole database for the Little Snake River coal field and Red Desert area, Wyoming: U.S. Geological Survey data release, accessed July 13, 2020, at https://doi.org/10.5066/F7RN36RG.
Hettinger, R.D., Honey, J.G., Ellis, M.S., Barclay, C.S.V., and East, J.A., 2008, Geologic map of Upper Cretaceous and Tertiary strata and coal stratigraphy of the Paleocene Fort Union Formation, Rawlins-Little Snake River area, south-central Wyoming: U.S. Geological Survey Scientific Investigation Map 3053, 3 sheets, scale 1:100,000, accessed September 14, 2020, at https://doi.org/10.3133/sim3053.
Honey, J.G. and Hettinger, R.D., 2004, Geologic map of the Peach Orchard Flat quadrangle, Carbon County, Wyoming, and descriptions of new stratigraphic units in the Upper Cretaceous Lance Formation and Paleocene Fort Union Formation, eastern Greater Green River Basin, Wyoming-Colorado (version 1.1): U.S. Geological Survey Scientific Investigations Map 2835, 2 sheets, scale 1:24,000, 9-p. pamphlet, accessed September 14, 2020, at https://doi.org/10.3133/sim2835.
Luppens, J.A., Rohrbacher, T.J., Osmonson, L.M., and Carter, M.D., 2009, Coal resource availability, recoverability, and economic evaluations in the United States—A summary, chap. D of Pierce, B.S., and Dennen, K.O., eds., The national coal resource assessment overview: U.S. Geological Survey Professional Paper 1625–F, 17 p.
Olea, R.A., 2018, Advances in sensitivity analysis of uncertainty to changes in sampling density when modeling spatially correlated attributes, inSagar, B.S.D., Cheng, Q., and Agterberg, F., eds., Handbook of mathematical geosciences—Fifty years of IAMG: Cham, Switzerland, Springer, p. 375–393. [Also available at https://doi.org/10.1007/978-3-319-78999-6_19.]
Olea, R.A., Shaffer, B.N., Haacke, J.E., and Luppens, J.A., 2021, Probabilistic methodology for the assessment of original and recoverable coal resources, illustrated with an application to a coal bed in the Fort Union Formation, Wyoming: U.S. Geological Survey Techniques and Methods 6–G1, 55 p., accessed July, 13, 2020, at https://doi.org/10.3133/tm6G1.
Scott, D.C., Shaffer, B.N., Haacke, J.E., Pierce, P.E., and Kinney, S.A., 2019, Coal geology and assessment of resources and reserves in the Little Snake River coal field and Red Desert assessment area, Greater Green River Basin, Wyoming: U.S. Geological Survey Professional Paper 1836, 169 p., accessed on September 14, 2020, at https://doi.org/10.3133/pp1836.
Shaffer, B.N., 2022, Cherokee coal bed drill hole data from the Fort Union Formation in the Little Snake River coal field and Red Desert area, Wyoming: U.S. Geological Survey data release, https://doi.org/10.5066/P92K1UT6.
WoodJr., G.H., Kehn, T.M., Carter, M.D., and Culbertson, W.C., 1983, Coal resource classification system of the U.S. Geological Survey: U.S. Geological Survey Circular891, 65 p. [Also available at https://doi.org/10.3133/cir891.]
Wyoming Oil and Gas Conservation Commission, 2014, Oil and gas wells: Wyoming Oil and Gas Conservation Commission database, accessed September 14, 2020, at http://wogcc.state.wy.us.
Conversion Factors
U.S. customary units to International System of Units
Datum
Vertical coordinate information is referenced to the North American Vertical Datum of 1988 (NAVD 88).
Horizontal coordinate information is referenced to the North American Datum of 1983 (NAD 83).
Horizontal coordinates are Universal Transverse Mercator (UTM) coordinates, Zone 13, in meters.
Elevation, as used in this report, refers to distance above the vertical datum.
Central Energy Resources Science Center
Publishing support provided by the Science Publishing Network,
Denver Publishing Service Center
For more information concerning the research in this report, contact the
Center Director, USGS Central Energy Resources Science Center
Box 25046, Mail Stop 939
Denver, CO 80225
(303) 236-1647
Or visit the Central Energy Resources Science Center website at
https://www.usgs.gov/centers/central-energy-resources-science-center
Disclaimers
Any use of trade, firm, or product names is for descriptive purposes only and does not imply endorsement by the U.S. Government.
Although this information product, for the most part, is in the public domain, it also may contain copyrighted materials as noted in the text. Permission to reproduce copyrighted items must be secured from the copyright owner.
Suggested Citation
Shaffer, B.N., and Olea, R.A., 2023, Geology and assessment of coal resources for the Cherokee coal bed in the Fort Union Formation, south-central Wyoming: U.S. Geological Survey Scientific Investigations Report 2023–5067, 29 p., https://doi.org/10.3133/sir20235067.
ISSN: 2328-0328 (online)
Study Area
| Publication type | Report |
|---|---|
| Publication Subtype | USGS Numbered Series |
| Title | Geology and assessment of coal resources for the Cherokee coal bed in the Fort Union Formation, south-central Wyoming |
| Series title | Scientific Investigations Report |
| Series number | 2023-5067 |
| DOI | 10.3133/sir20235067 |
| Publication Date | August 14, 2023 |
| Year Published | 2023 |
| Language | English |
| Publisher | U.S. Geological Survey |
| Publisher location | Reston VA |
| Contributing office(s) | Central Energy Resources Science Center |
| Description | Report: vii, 30 p.; 6 Figures: 36.00 x 24.00 inches; Data Release |
| Country | United States |
| State | Wyoming |
| Other Geospatial | Cherokee Coal Bed, Fort Union Formation |
| Online Only (Y/N) | Y |