


The purpose of these interpretive discussions is to provide a perspective on regional- and national-scale variations in element and mineral distributions in soils and their likely causes. The significant spatial variations shown by most elements and minerals can commonly be attributed to geologic sources in underlying parent materials, but other spatial variations seem clearly related to additional factors such as climate, the age of soils, transported source material, and anthropogenic influences. We attempt to distinguish the influence of these various factors on a regional and national scale. Numerous more local features might similarly be related to these same factors, but these features also have some probability of being an artifact of a random sampling of variable compositions, so that there is some probability of samples with similar compositions occurring in clusters of two or more adjacent sites by chance. Distinguishing such random occurrences from true variability is beyond the scope of the data from which these maps are constructed. Some caution, therefore, is advisable in interpreting the significance of these more local features unless some unique sources or processes can clearly be related to them.
Tellurium (Te) is a rare metalloid, meaning this element has properties between those of a typical metal and nonmetal. It is used in alloys, mostly with copper (Cu) and stainless steel to improve their machinability. Tellurium is also used in the coloring of glass and ceramics, in thermoelectric devices, and as an ingredient in blasting caps. Tellurium has no known biological function and is considered to be mildly toxic.
The chemistry of Te is similar to that of sulfur (S), and Te frequently occurs as a replacement for S in common sulfide minerals such as pyrite (FeS2), chalcopyrite (CuFeS2), and molybdenite (MoS2). In soils, Te is associated with iron (Fe) and manganese (Mn) oxides and hydroxides.
The average abundance of Te in the Earth's upper continental crust is estimated to be about 0.027 milligrams per kilogram (mg/kg) (Hu and Gao, 2008), although data are somewhat lacking. Data are also sparse for the common rock types, but Te concentration averages about 0.009 mg/kg in shale, about 0.005 mg/kg in granite, and about 0.002 mg/kg in sandstone and limestone.
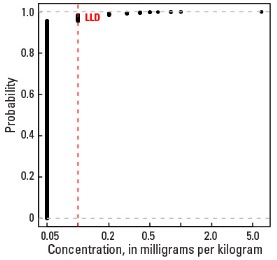
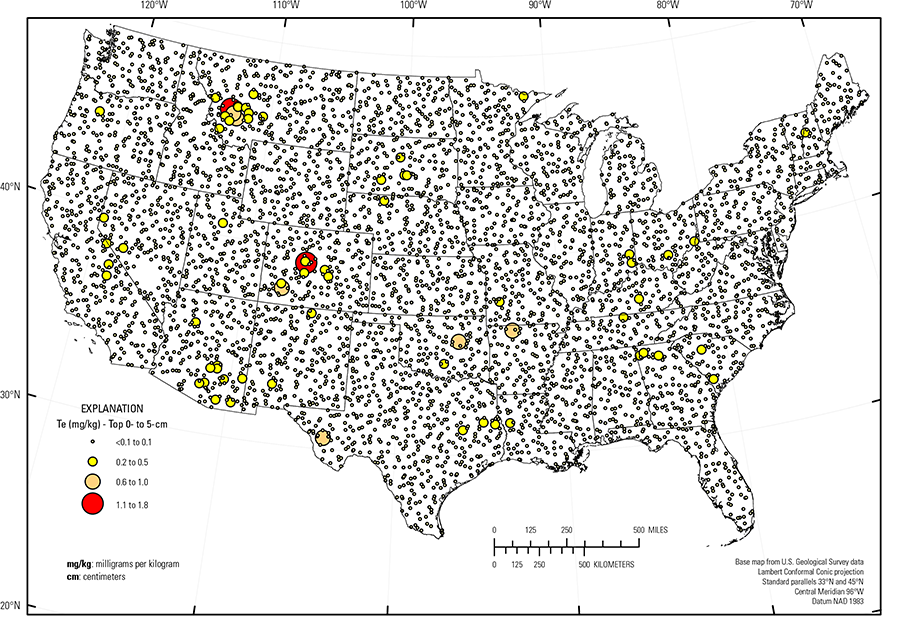
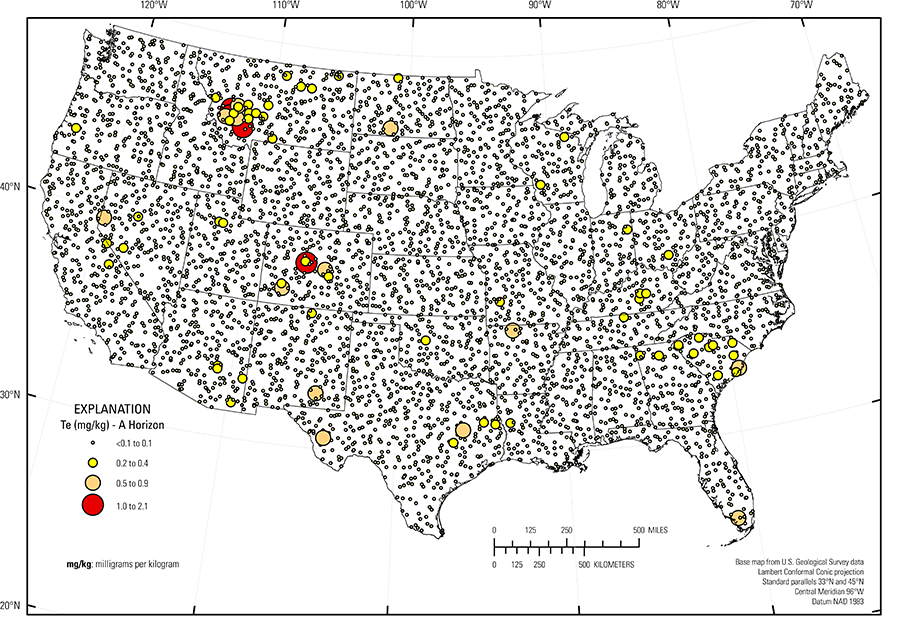
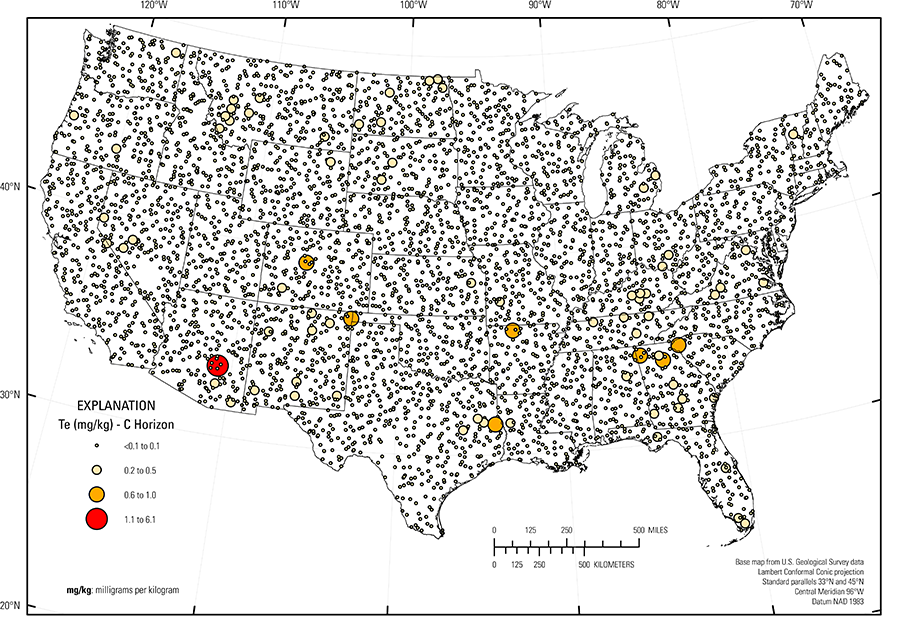
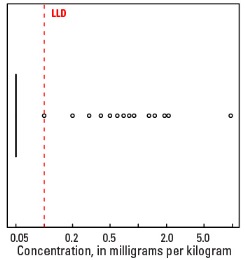
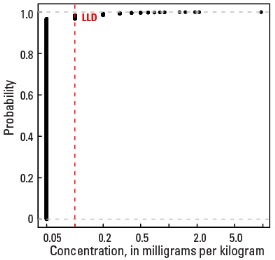
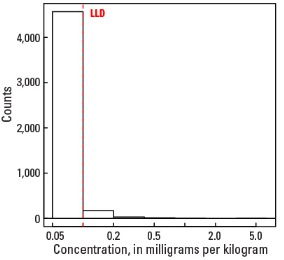
In our study, Te was determined by inductively coupled plasma–mass spectrometry following a near–total four–acid digestion of the <2–mm fraction of the soil samples. The lower limit of determination (LLD) for Te by this method is 0.1 mg/kg, which is high compared to the average crustal abundance of approximately 0.027 mg/kg. Therefore, relatively few of the analytical results for Te are above the LLD. Tellurium concentrations in only 157 of 4,841 samples analyzed (3.2 percent) are above the LLD for the top 0- to 5-cm layer; 158 of 4,813 samples (3.3 percent) for the soil A horizon; and 213 of 4,780 samples (4.5 percent) for the soil C horizon. Obviously, the median concentration for all three sample types collected in this study (top 0- to 5-cm layer, soil A horizon, and soil C horizon) can only be stated as less than 0.1 mg/kg (see the summary statistics [open in new window]). Because so few of the samples have Te concentrations above the LLD, the spatial distribution is shown as proportional symbol maps rather than interpolated and smoothed color surface maps. It is also important to note that even for samples having uncensored concentrations (concentrations above the LLD), most were less than 5 times the LLD. Data this close to the LLD are subject to considerable uncertainty and the map patterns generated from these data must be interpreted with caution.
The distribution of mineral resource deposits with Te as a commodity (major or minor) in the United States, extracted from the U.S. Geological Survey (USGS) Mineral Resource Data System (MRDS) website, can be seen by hovering the mouse here. Statistics and information on the worldwide supply of, demand for, and flow of Te–bearing materials are available through the U.S. Geological Survey (USGS) National Minerals Information Center (NMIC) website.
The distribution of Te in soils of the conterminous United States seems to be primarily controlled by the composition of the underlying soil parent material. Although only a small percentage of data are above the LLD, a few patterns of elevated Te are observed as follows:
- Tellurium is somewhat elevated in areas of known sulfide–bearing mineral deposits and occurrences. This is seen in Colorado, western Montana, southeastern Arizona, northern Georgia, and along the California–Nevada border;
- Elevated concentrations observed in eastern Texas, North Dakota, South Dakota, Ohio, and Kentucky likely indicate shale parent material that contains some sulfide minerals; and
- The cluster of elevated concentrations in South Carolina observed for the map of the soil A horizon may be an artefact of analytical bias. We know of no geologic reason for these elevated values. Most of the elevated values range from 0.2 to 0.4 mg/kg. These concentrations are so close to the LLD (0.1 mg/kg) that analytical uncertainty cannot be ruled out.
Given the nature of the Te data and the resulting maps, it is impossible to observe any geochemical patterns relating to depleted Te concentrations.
Statistics - 0 TO 5 CM
| Number of samples | 4,841 |
| LLD | 0.1 mg/kg |
| Number below LLD | 4,684 |
| Minimum | <0.1 mg/kg |
| 5 percentile | <0.1 mg/kg |
| 25 percentile | <0.1 mg/kg |
| 50 percentile | <0.1 mg/kg |
| 75 percentile | <0.1 mg/kg |
| 95 percentile | <0.1 mg/kg |
| Maximum | 50.5 mg/kg |
| MAD | ND |
| Robust CV | ND |
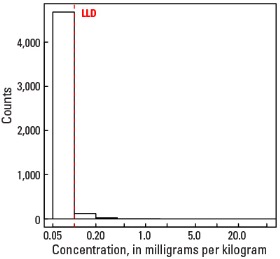
Histogram
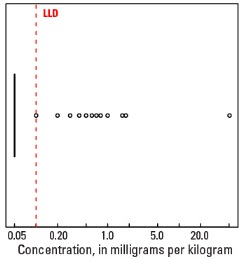
Boxplot
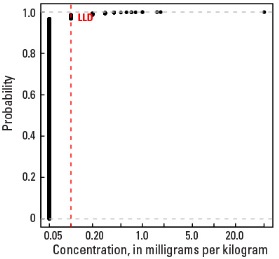
Empirical cumulative distribution function
Statistics - A Horizon
| Number of samples | 4,813 |
| LLD | 0.1 mg/kg |
| Number below LLD | 4,655 |
| Minimum | <0.1 mg/kg |
| 5 percentile | <0.1 mg/kg |
| 25 percentile | <0.1 mg/kg |
| 50 percentile | <0.1 mg/kg |
| 75 percentile | <0.1 mg/kg |
| 95 percentile | <0.1 mg/kg |
| Maximum | 9.6 mg/kg |
| MAD | ND |
| Robust CV | ND |
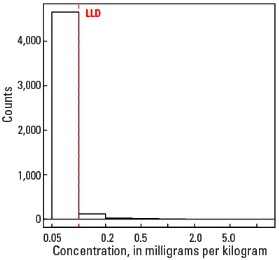
Histogram
Boxplot
Empirical cumulative distribution function
Statistics - C Horizon
| Number of samples | 4,780 |
| LLD | 0.1 mg/kg |
| Number below LLD | 4,567 |
| Minimum | <0.1 mg/kg |
| 5 percentile | <0.1 mg/kg |
| 25 percentile | <0.1 mg/kg |
| 50 percentile | <0.1 mg/kg |
| 75 percentile | <0.1 mg/kg |
| 95 percentile | <0.1 mg/kg |
| Maximum | 6.1 mg/kg |
| MAD | ND |
| Robust CV | ND |
Histogram
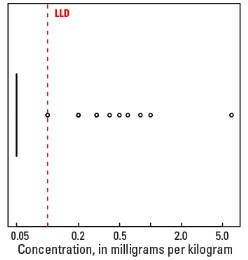
Boxplot