


The purpose of these interpretive discussions is to provide a perspective on regional- and national-scale variations in element and mineral distributions in soils and their likely causes. The significant spatial variations shown by most elements and minerals can commonly be attributed to geologic sources in underlying parent materials, but other spatial variations seem clearly related to additional factors such as climate, the age of soils, transported source material, and anthropogenic influences. We attempt to distinguish the influence of these various factors on a regional and national scale. Numerous more local features might similarly be related to these same factors, but these features also have some probability of being an artifact of a random sampling of variable compositions, so that there is some probability of samples with similar compositions occurring in clusters of two or more adjacent sites by chance. Distinguishing such random occurrences from true variability is beyond the scope of the data from which these maps are constructed. Some caution, therefore, is advisable in interpreting the significance of these more local features unless some unique sources or processes can clearly be related to them.
Cesium (Cs) is a metallic trace element. One of the most important uses of Cs is in atomic clocks. Cesium has no known biological role. More information about the toxicity of Cs (or other elements and substances) and its potential negative human health impacts can be found at the Agency for Toxic Substances and Disease Registry (ATSDR) website, or click to download a fact sheet about Cs.
The distribution of Cs in soils across the conterminous United States is primarily controlled by the composition of underlying soil parent materials. The average abundance of Cs in the Earth's upper continental crust is estimated to be 4.9 milligrams per kilogram (mg/kg) (Hu and Gao, 2008). Felsic igneous rocks, such as granite and rhyolite, have Cs concentrations around 4 mg/kg, whereas shale has an average Cs concentration of about 5 mg/kg. Most other rock types have much lower concentrations. In soils, Cs can be hosted in potassium (K) feldspar, micas, or clay minerals. Cesium also can be present in unusually high concentrations in felsic rocks altered by hydrothermal fluids, such as hot spring deposits in volcanic terranes. The distribution of Cs in soils is similar to the distribution of rubidium (Rb) and lithium (Li) as all three elements are alkali metals with similar physical and chemical properties.
Statistics and information on the worldwide supply of, demand for, and flow of Cs are available through the U.S. Geological Survey (USGS) National Minerals Information Center (NMIC) website.
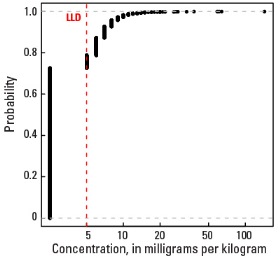
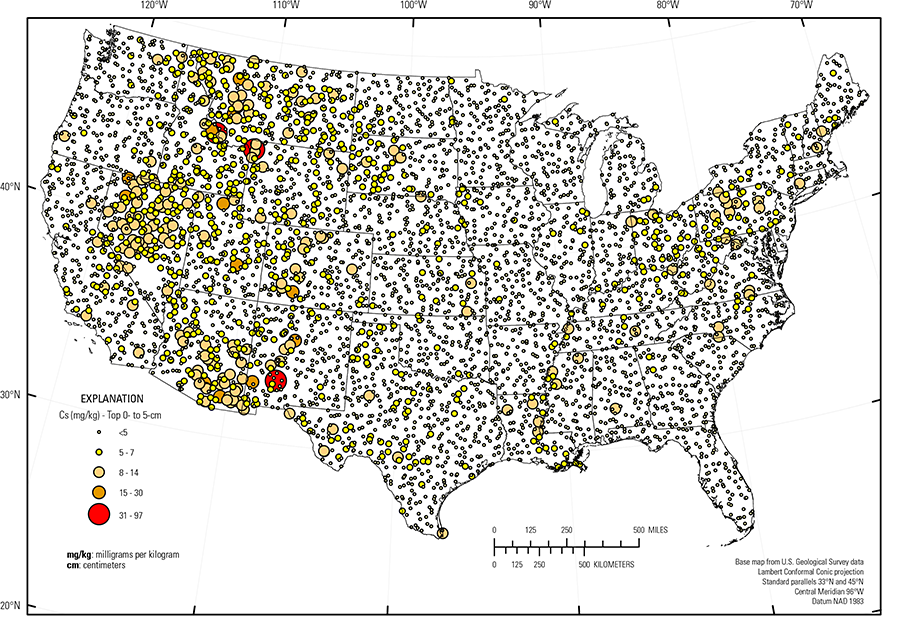
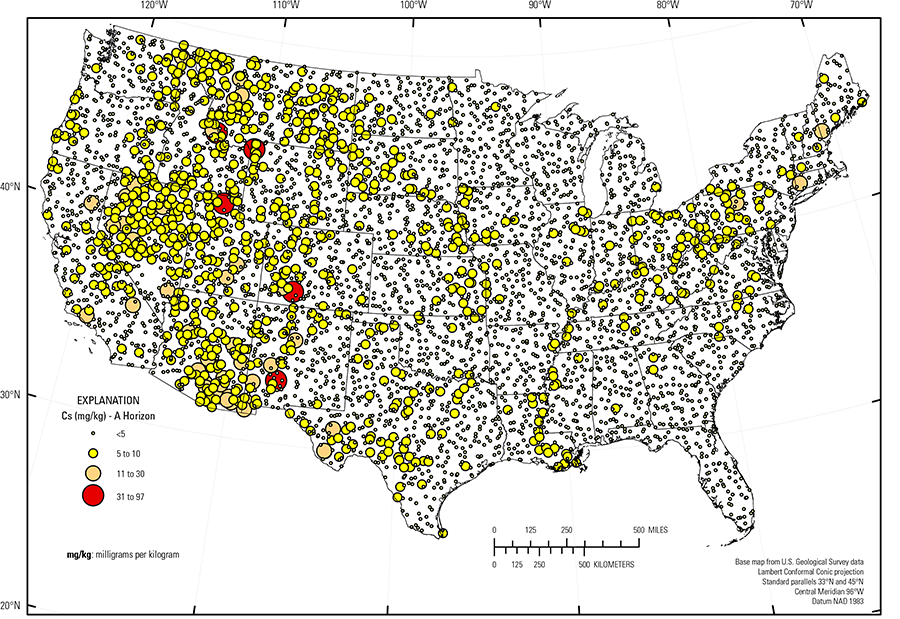
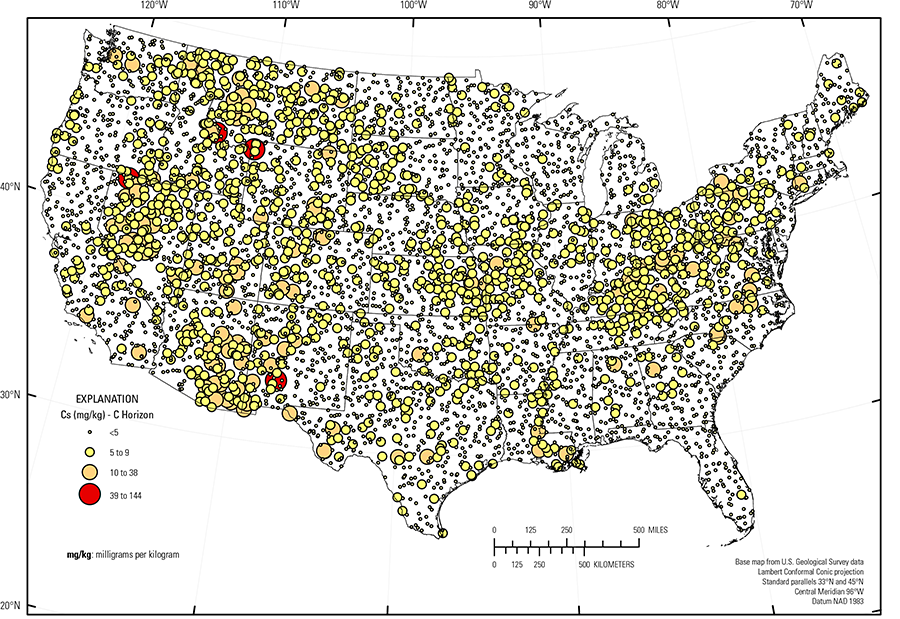
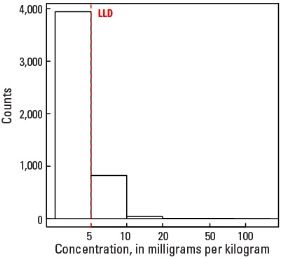
In our data, Cs concentrations in the soil C horizon range from <5 mg/kg (the lower limit of determination (LLD)) to 144 mg/kg, with only 27 percent of the sites containing Cs concentrations above the LLD. In the soil A horizon and the top 0- to 5-cm layer, Cs concentrations range from <5 mg/kg to 97 mg/kg, and Cs is reported at concentrations above the LLD in only about 18 percent of all sites (see the summary statistics [open in new window]). Because so few samples have Cs concentrations above the LLD, the spatial distribution of Cs is shown as a proportional symbol map rather than an interpolated and smoothed color surface map. The spatial distribution of Cs in soils, especially for soils with higher Cs concentrations, is somewhat similar among all three sample types; however, the map patterns for Cs concentrations are somewhat complicated by the many values at or near the rather high LLD.
The highest Cs concentrations in all three soil layers are from a site near Geyser Basin in Yellowstone National Park, an area of noted hot springs activity. Other soil C horizon samples with high Cs (including sites in Idaho, western Montana, Nevada, western New Mexico, the Trans–Pecos volcanics (Schruben and others, 1997), Texas, and a number of sites in the Southeastern Arizona Basin and Range (USDA, 2006) are located in areas where soil parent materials have a felsic rock origin. In many parts of the United States, the distribution of Cs is related to the presence of clay minerals in shale (for example, western South Dakota, eastern Montana, eastern Kansas), in glacial materials derived from shale (for example, northern Ohio, northeast Illinois), or in marine clays (for example, central and eastern Texas). Cesium also is present in soils of the east–central United States, for example in Kentucky, southern Ohio, Pennsylvania and southern New York, where soils developed on cyclic beds of sandstone, siltstone, shale, and clay. In the Piedmont (Fenneman and Johnson, 1946), Cs in highly weathered soils is likely in residual mica or contained within clay minerals.
Areas with no detectable Cs in soils likely lacked Cs in the original soil parent materials. Examples include soils in the Pacific Northwest and northern California, where soils developed on mafic rocks; the Colorado Plateau (USDA, 2006), where soils developed on quartz–rich sandstone and eolian deposits; and the Gulf and Atlantic Coastal Plain (Fenneman and Johnson, 1946), where many soils developed on quartz–rich sedimentary rocks and unconsolidated sediments.
The Gulf and Atlantic Coastal Plain (Fenneman and Johnson, 1946) is bisected by the Southern Mississippi River Alluvium and the Southern Mississippi Valley Loess(USDA, 2006). Alluvial sediments were deposited in the Mississippi River valley as the river flooded in recent geologic time. When these sediments dried, winds picked up the fine material and deposited it in thick loess sheets, mainly along the east side of the river valley. The youngest loess sheets are about 10,000 years old. A pattern of higher Cs concentrations in soils developed on these young sediments reflects long–range transport of Cs–bearing material, likely potassium feldspar and clays, from the upper part of the Mississippi River drainage basin.
Statistics - 0 TO 5 CM
| Number of samples | 4,841 |
| LLD | 5 mg/kg |
| Number below LLD | 3,954 |
| Minimum | <5 mg/kg |
| 5 percentile | <5 mg/kg |
| 25 percentile | <5 mg/kg |
| 50 percentile | <5 mg/kg |
| 75 percentile | <5 mg/kg |
| 95 percentile | 7 mg/kg |
| Maximum | 97 mg/kg |
| MAD | ND |
| Robust CV | ND |
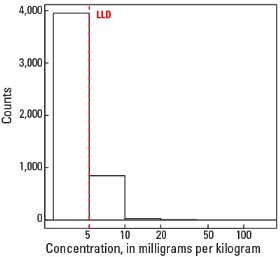
Histogram
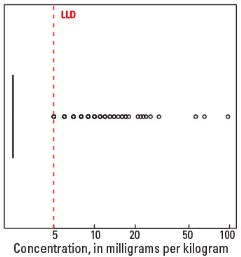
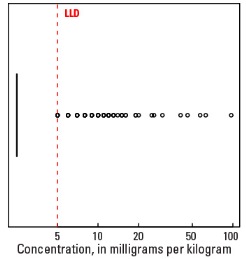
Boxplot
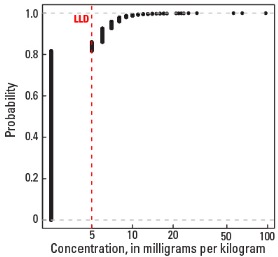
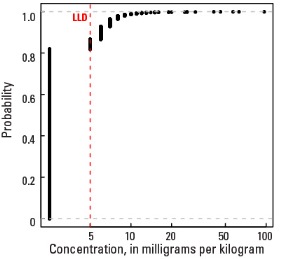
Empirical cumulative distribution function
Statistics - A Horizon
| Number of samples | 4,813 |
| LLD | 5 mg/kg |
| Number below LLD | 3,942 |
| Minimum | <5 mg/kg |
| 5 percentile | <5 mg/kg |
| 25 percentile | <5 mg/kg |
| 50 percentile | <5 mg/kg |
| 75 percentile | <5 mg/kg |
| 95 percentile | 7 mg/kg |
| Maximum | 97 mg/kg |
| MAD | ND |
| Robust CV | ND |
Histogram
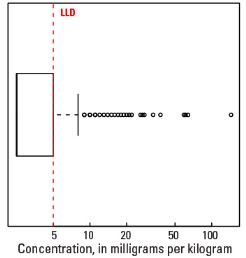
Boxplot
Empirical cumulative distribution function
Statistics - C Horizon
| Number of samples | 4,780 |
| LLD | 5 mg/kg |
| Number below LLD | 3,470 |
| Minimum | <5 mg/kg |
| 5 percentile | <5 mg/kg |
| 25 percentile | <5 mg/kg |
| 50 percentile | <5 mg/kg |
| 75 percentile | 5 mg/kg |
| 95 percentile | 8 mg/kg |
| Maximum | 144 mg/kg |
| MAD | ND |
| Robust CV | ND |
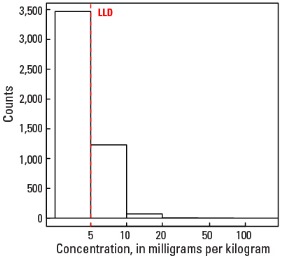
Histogram
Boxplot