


The purpose of these interpretive discussions is to provide a perspective on regional- and national-scale variations in element and mineral distributions in soils and their likely causes. The significant spatial variations shown by most elements and minerals can commonly be attributed to geologic sources in underlying parent materials, but other spatial variations seem clearly related to additional factors such as climate, the age of soils, transported source material, and anthropogenic influences. We attempt to distinguish the influence of these various factors on a regional and national scale. Numerous more local features might similarly be related to these same factors, but these features also have some probability of being an artifact of a random sampling of variable compositions, so that there is some probability of samples with similar compositions occurring in clusters of two or more adjacent sites by chance. Distinguishing such random occurrences from true variability is beyond the scope of the data from which these maps are constructed. Some caution, therefore, is advisable in interpreting the significance of these more local features unless some unique sources or processes can clearly be related to them.
Lithium (Li) is a metallic trace element. The most important use of Li is in rechargeable batteries for mobile phones, laptops, digital cameras, and electric vehicles. It is also used in the manufacture of special glasses and ceramics. Lithium is the lightest metal and is alloyed with aluminum (Al), copper (Cu), and other metals for use in aircraft. Lithium carbonate is used in drugs to treat bipolar disorder. Lithium does not have a known biological use and does not appear to be essential for life. Metallic Li and certain Li compounds are toxic.
Spodumene (LiAlSi2O6) is the major ore of Li. Lithium can substitute for magnesium (Mg) and ferrous iron (Fe) (Fe2+) in minerals such as mica and amphibole. Lithium can sorb to organic matter and to clays, which limits its mobility in soils. In arid climates, Li can move upward in the soil profile and may precipitate with sulfate, borate, and chlorite minerals.
The average abundance of Li in the Earth's upper continental crust is estimated to be approximately 41 milligrams per kilogram (mg/kg) (Hu and Gao, 2008). Lithium is enriched in felsic igneous rocks (such as granite and rhyolite) and can form independent Li–bearing minerals in pegmatite. Granite has an average Li concentration of approximately 30 mg/kg. Lithium also can be incorporated into clay minerals during weathering, resulting in high values in shale, which has Li concentrations averaging about 60 mg/kg. Higher Li concentrations occur in some calcareous soils. Soils developed in arid and semiarid environments in dry, restricted basins (playas) can also contain significant Li, typically deposited with secondary carbonates. Erosion of Li–bearing source rocks can result in high Li concentrations in soils developed on unconsolidated materials such as alluvial, eolian, and glacial deposits.
The distribution of mineral resource deposits with Li as a commodity (major or minor) in the United States, extracted from the U.S. Geological Survey (USGS) Mineral Resource Data System (MRDS) website, can be seen by hovering the mouse here. Statistics and information on the worldwide supply of, demand for, and flow of Li–bearing materials are available through the USGS National Minerals Information Center (NMIC) website.
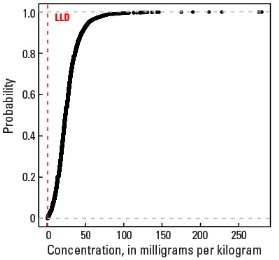
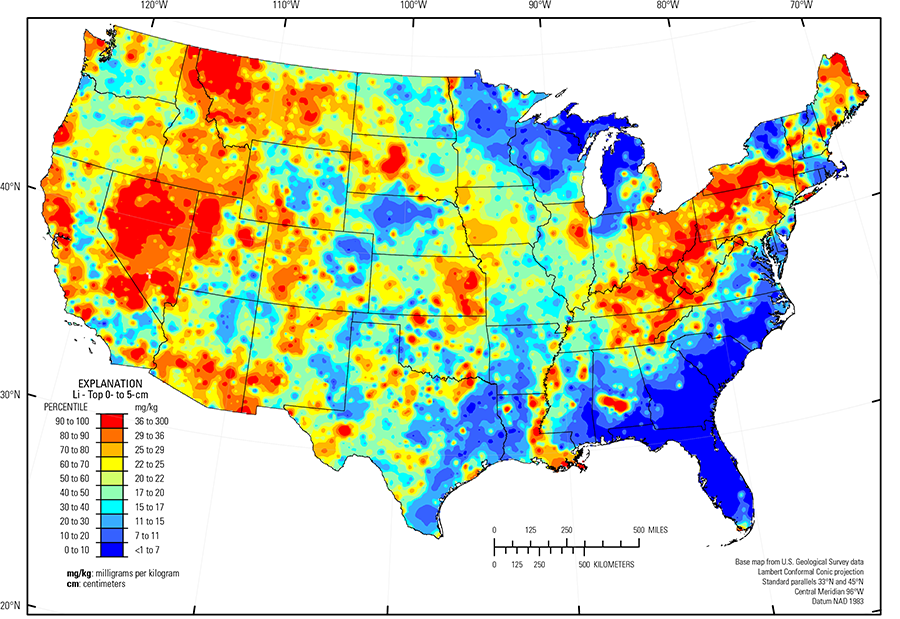
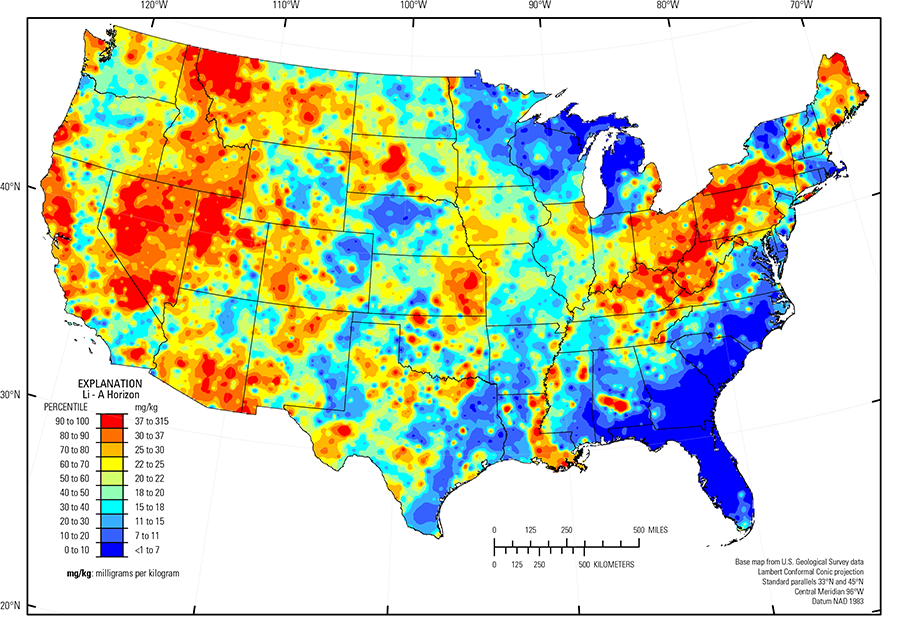
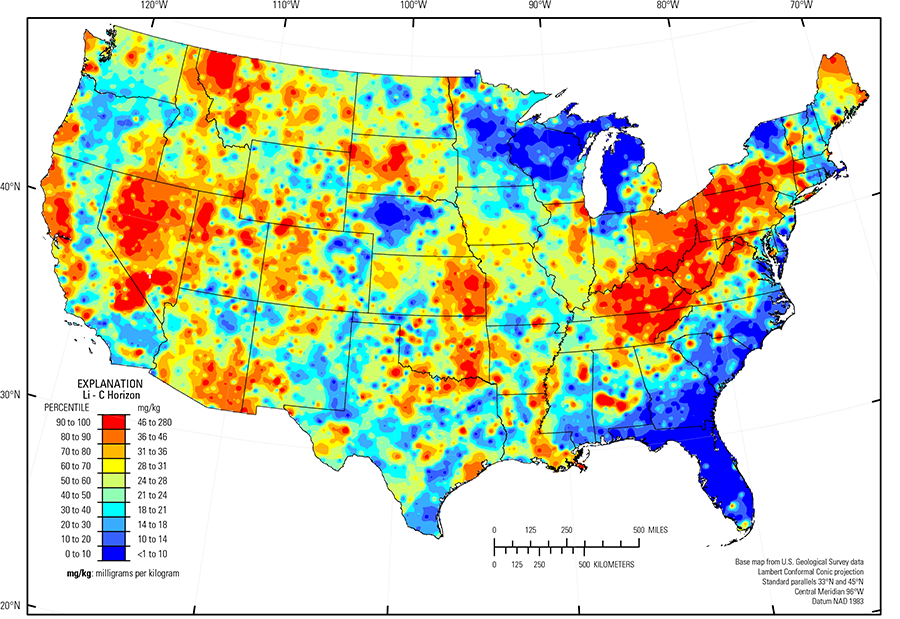
In our data, Li has a median concentration of 24 mg/kg in the soil C horizon, and 20 mg/kg in the soil A horizon and the top 0- to 5-cm layer (see the summary statistics [open in new window]). Most soils have Li concentrations above the 1.0 mg/kg lower limit of determination (LLD). The map patterns for Li are somewhat consistent among the three sample types, especially in the western United States. In the more humid southeastern United States, there is a general pattern of higher Li in the soil C horizon compared to topsoils (the soil A horizon and top 0- to 5-cm layer), following the overall precipitation pattern (PRISM climate group) for the conterminous United States of increasing precipitation from west to east. This is likely related to leaching of Li down the soil profile with resulting Li incorporation into clay.
The distribution of Li in soils of the conterminous United States is controlled, in large part, by the composition of underlying soil parent materials. High Li concentrations occur in soils developed on felsic rocks (granite and rhyolite) and alluvium sourced from similar rocks, for example within the Mojave Desert (USDA, 2006). Other areas with elevated Li occur within arid, restricted basins, such as soils around Fallon–Lovelock (USDA, 2006), Nevada, and soils in the Great Salt Lake Area (USDA, 2006), Utah. In many areas, soils developed on shale or alluvium sourced from shale often have elevated Li concentrations. Examples of these areas include:
- Parts of the Northern Rocky Mountains (USDA, 2006) in western Montana;
- Northern Rolling Pierre Shale Plains (USDA, 2006) in western South Dakota;
- Cherokee Prairies (USDA, 2006) in eastern Kansas, western Missouri, and northern Oklahoma;
- Much of the east–central part of the country, where soils developed on cyclic beds of sandstone, shale, and coal, including Western and Central Allegheny Plateau, Cumberland Plateau, and Southern Appalachian Ridges and Valleys (USDA, 2006); and
- Calcareous 'blackland' soils, for example the northern part of the Texas Blackland Prairie and the Alabama and Mississippi Blackland Prairie (USDA, 2006) (calcareous soils are often dark–colored and richer in organic carbon than non–calcareous soils, thus the name 'blackland' has been applied to landscape units underlain by calcareous soils).
The distribution of Li in soils across the Upper Midwest is influenced by glacial provenance. In this region, melting of glacial ice following late Wisconsinan period advances (16,000 to 12,000 years ago) left the region north of the southern glacial limit (Soller and others, 2012) mantled with a blanket of mixed, immature sediments, from which present–day soils developed. Individual ice lobes (Grimley, 2000) created distinct patterns in soil geochemistry because of varying provenance and ice transport paths. Soils developed on 'gray' (carbonate– and shale–rich) till in the James and Des Moines lobes (Grimley, 2000) have higher Li concentrations than soils developed on 'red' quartz– and feldspar–rich till deposited in northeastern Minnesota, western Wisconsin, and northwestern Michigan that have a Precambrian crystalline rock/red sandstone provenance. Soils developed on glacial lake clays in the Red River Valley of the North (USDA, 2006) are more enriched in Li than soils formed on gray till. Lithium is also enriched in northeastern Illinois, where soils developed on carbonate till and in eastern lower Michigan, and across Ohio, where soils formed on till and other glacial deposits that incorporated black shale.
Other areas with relatively low concentrations of Li in soils (and dominant soil parent materials) include:
- Adirondack highlands (Fenneman and Johnson, 1946), northern New York (residual mafic igneous and metamorphic rocks);
- Nebraska Sand Hills (USDA, 2006) (quartz– and plagioclase–rich unconsolidated sand dunes and sand sheets);
- Parts of the Southern High Plains (USDA, 2006) in eastern New Mexico and western Texas (quartz–rich eolian sands and alluvial sediments); and
- Gulf and Atlantic Coastal Plain (Fenneman and Johnson, 1946) (quartz–rich sedimentary rocks and unconsolidated sediments).
The Gulf and Atlantic Coastal Plain is bisected by the Southern Mississippi River Alluvium and the Southern Mississippi Valley Loess (USDA, 2006). Alluvial sediments have deposited in the Mississippi River valley as the river flooded in recent geologic time. When these sediments dried, winds picked up the fine material and deposited it in thick loess sheets, mainly along the east side of the river valley. The youngest loess sheets are about 10,000 years old. A pattern of higher Li concentrations in soils developed on these young sediments reflects long–range transport of Li–bearing materials from the upper part of the Mississippi River drainage basin.
Statistics - 0 TO 5 CM
| Number of samples | 4,841 |
| LLD | 1 mg/kg |
| Number below LLD | 18 |
| Minimum | <1 mg/kg |
| 5 percentile | 5 mg/kg |
| 25 percentile | 13 mg/kg |
| 50 percentile | 20 mg/kg |
| 75 percentile | 27 mg/kg |
| 95 percentile | 43 mg/kg |
| Maximum | 300 mg/kg |
| MAD | 10.4 mg/kg |
| Robust CV | 51.9 % |
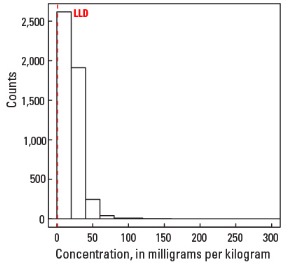
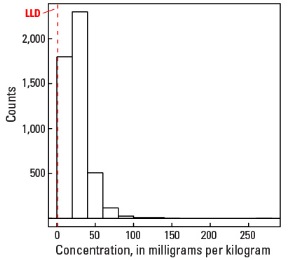
Histogram
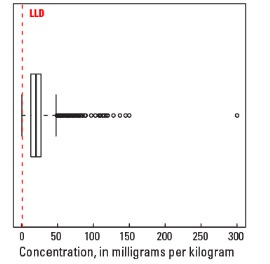
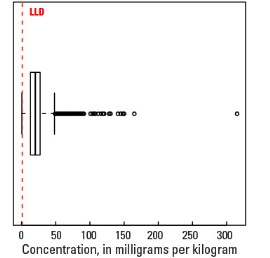
Boxplot
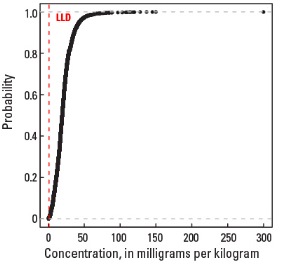
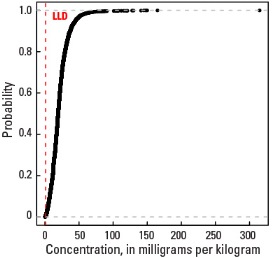
Empirical cumulative distribution function
Statistics - A Horizon
| Number of samples | 4,813 |
| LLD | 1 mg/kg |
| Number below LLD | 13 |
| Minimum | <1 mg/kg |
| 5 percentile | 5 mg/kg |
| 25 percentile | 13 mg/kg |
| 50 percentile | 20 mg/kg |
| 75 percentile | 27 mg/kg |
| 95 percentile | 45 mg/kg |
| Maximum | 315 mg/kg |
| MAD | 10.4 mg/kg |
| Robust CV | 51.9 % |
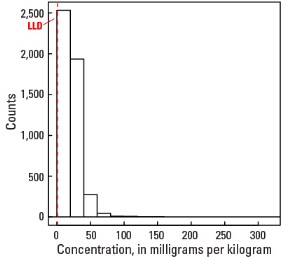
Histogram
Boxplot
Empirical cumulative distribution function
Statistics - C Horizon
| Number of samples | 4,780 |
| LLD | 1 mg/kg |
| Number below LLD | 7 |
| Minimum | <1 mg/kg |
| 5 percentile | 6 mg/kg |
| 25 percentile | 16 mg/kg |
| 50 percentile | 24 mg/kg |
| 75 percentile | 33 mg/kg |
| 95 percentile | 55 mg/kg |
| Maximum | 280 mg/kg |
| MAD | 11.9 mg/kg |
| Robust CV | 49.4 % |
Histogram
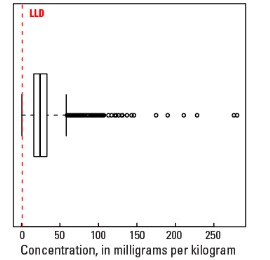
Boxplot