


The purpose of these interpretive discussions is to provide a perspective on regional- and national-scale variations in element and mineral distributions in soils and their likely causes. The significant spatial variations shown by most elements and minerals can commonly be attributed to geologic sources in underlying parent materials, but other spatial variations seem clearly related to additional factors such as climate, the age of soils, transported source material, and anthropogenic influences. We attempt to distinguish the influence of these various factors on a regional and national scale. Numerous more local features might similarly be related to these same factors, but these features also have some probability of being an artifact of a random sampling of variable compositions, so that there is some probability of samples with similar compositions occurring in clusters of two or more adjacent sites by chance. Distinguishing such random occurrences from true variability is beyond the scope of the data from which these maps are constructed. Some caution, therefore, is advisable in interpreting the significance of these more local features unless some unique sources or processes can clearly be related to them.
Rubidium (Rb) is a metallic trace element with limited uses. It is sometimes used as a component of photocells, to remove trace gases from vacuum tubes, and in the manufacture of special types of glass. Rubidium compounds are also used to give a purple color to fireworks. The element has no known biological role and is considered nontoxic.
The distribution of Rb in soil of the conterminous United States is primarily controlled by the composition of underlying soil parent material. The abundance of Rb in the Earth's upper continental crust is estimated to be approximately 94 milligrams per kilogram (mg/kg) (Hu and Gao, 2008). Rubidium forms no minerals of its own, but most often replaces potassium (K) in K feldspar and in sheet silicates such as mica (mainly biotite and less commonly muscovite) and mica–like clay minerals (for example, illite). These structurally–related sheet silicates typically have a common basal spacing of 10 Å (1 Å (angstrom) = 10–10 meters (m)). Potassium feldspar and micas are common minerals in felsic igneous rocks, such as granite and rhyolite. The average concentration of Rb in felsic rocks is approximately 120 mg/kg. Potassium feldspar and 10 Å clay minerals can also be important components in sedimentary rocks, such as shale and mudstone. The average Rb concentration in shale is approximately 140 mg/kg. Other common rock types have lower Rb concentrations with sandstones averaging about 40 mg/kg, mafic rocks about 30 mg/kg, and limestones about 4 mg/kg. Potassium feldspar and 10 Å clay minerals are also present in unconsolidated materials, including alluvial, eolian, and glacial deposits. Rubidium also substitutes for K in potassium chloride minerals, such as sylvite (KCl), which forms by evaporation of sea water or in terrestrial salt lakes.
The distribution of mineral resource deposits with Rb as a commodity (major or minor) in the United States, extracted from the U.S. Geological Survey (USGS) Mineral Resource Data System (MRDS) website, can be seen by hovering the mouse here. Statistics and information on the worldwide supply of, demand for, and flow of Rb are available through the USGS National Minerals Information Center (NMIC) website.
In soil, K feldspar and biotite are susceptible to weathering (biotite more easily than K feldspar). Rubidium released by weathering of these minerals can be leached from the soil profile, incorporated into secondary clays, or removed from the soil by plant uptake. Thus, the distribution of Rb in soil is controlled by the mineralogy of the soil parent material, climate controls on weathering, and biologic activity. The distribution of Rb in soil is generally similar to the distribution of K, cesium (Cs), and lithium (Li) as all four elements are alkali metals with similar physical and chemical properties.
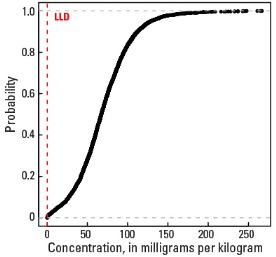
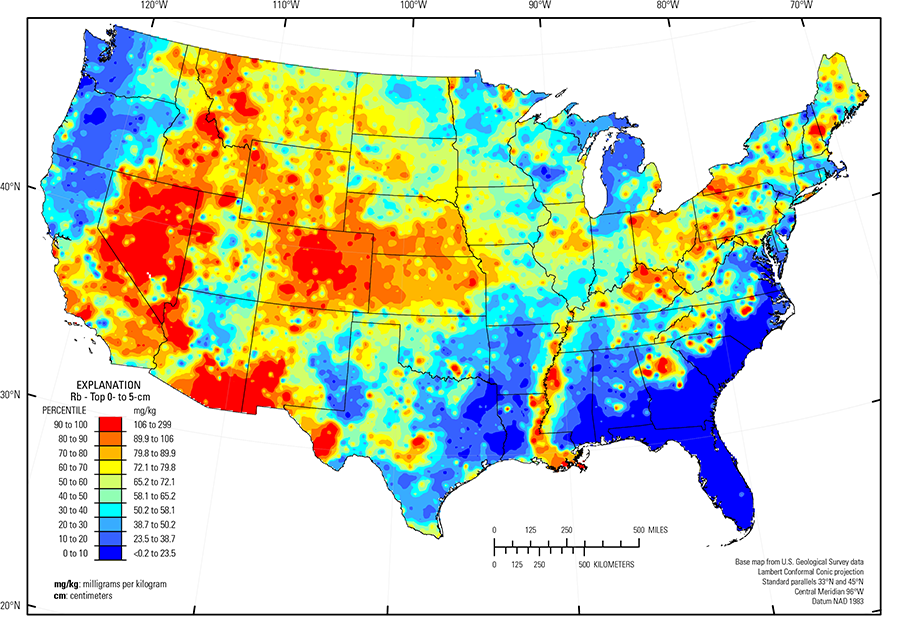
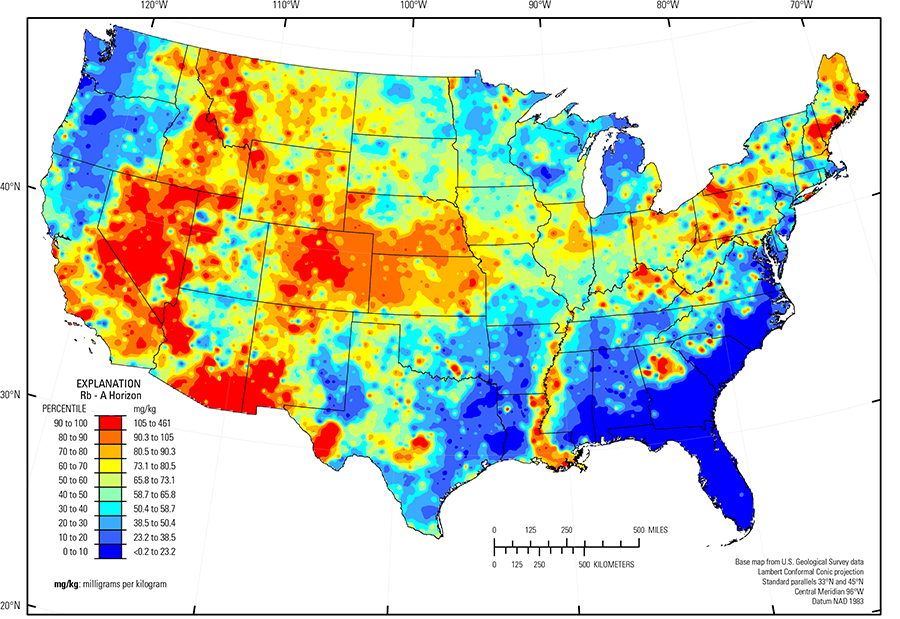
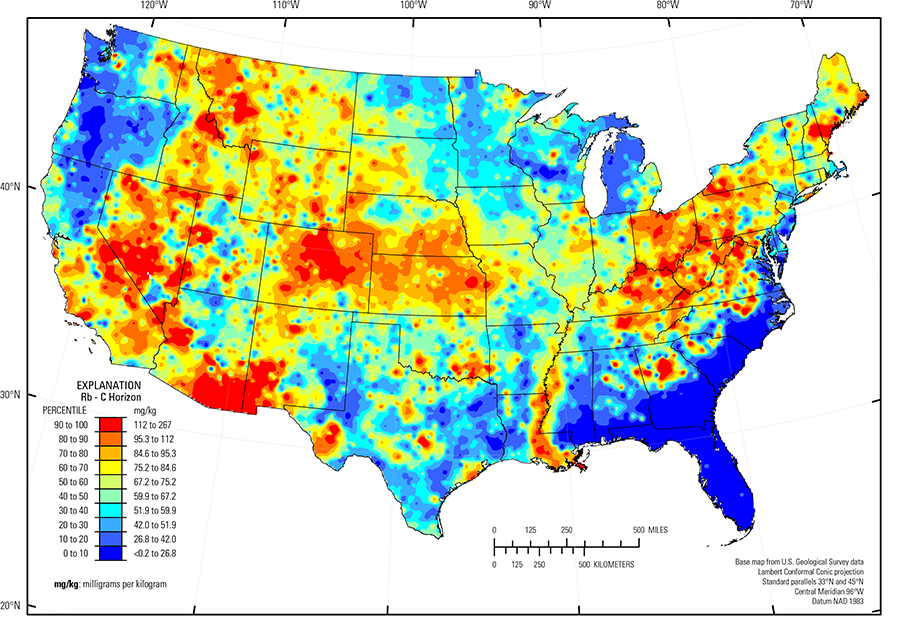
In our data, the median concentration of Rb is 67.2 mg/kg in the soil C horizon, 65.8 mg/kg in the soil A horizon, and 65.2 mg/kg in the top 0- to 5-cm layer (see the summary statistics [open in new window]). Less than 1 percent of all samples have Rb concentrations less than the 0.2-mg/kg lower limit of determination (LLD). The spatial map patterns for Rb in the soil A and C horizons, and the top 0- to 5-cm layer are all generally similar to one another, with only minor differences in Rb concentration among the three sample types.
Relatively high Rb soil concentrations occur where parent materials have an original felsic rock affinity. Examples include:
- Parts of the Central Rocky Mountains and the Southern Rocky Mountains (USDA, 2006), (variety of rock types, including granite);
- Southeastern Arizona Basin and Range (USDA, 2006) (felsic volcanic rocks and related alluvium);
- Southern Sierra Nevada Mountains (USDA, 2006) (variety of rock types, including granite);
- Mojave Desert and Sonoran Basin and Range (USDA, 2006) (granite and felsic volcanics);
- Trans–Pecos volcanics (Schruben and others, 1997), Texas, (rhyolite, alkalic volcanic rocks, and related alluvium); and
- Llano Basin (Precambrian granitic rocks).
In arid and semiarid parts of the western United States, for example in the Great Salt Lake Area (USDA, 2006), high Rb concentrations in soil may be related to precipitation of K salts in playa environments. In other parts of the United States where shale and other fine–grained sedimentary rocks constitute the soil parent materials, Rb concentrations are also somewhat elevated. Examples include areas in eastern Montana, western South Dakota, southern Ohio, northern Kentucky, and through the Appalachian Plateaus (Fenneman and Johnson, 1946). Soils with high Rb concentrations in northern Ohio developed on fine–grained glacial deposits that incorporated shale clasts. The Rb map pattern in eastern Colorado, western Kansas and southern Nebraska matches the potassium map pattern. Throughout this area, the relative proportions of K feldspar and 10 Å clay in soil developed on loess suggest that soil Rb concentration is controlled by the presence of mica or clay, rather than feldspar.
Soil throughout the Piedmont (Fenneman and Johnson, 1946) is old and has undergone long–term, intense weathering in a humid to semi–humid environment; most primary minerals have broken down. However, in some parts of the Piedmont, soil developed on granite or metamorphosed felsic rocks has retained some K feldspar resulting in sporadic occurrence of Rb in soil. In other parts of the Piedmont, it is likely that any original minerals that would have contained Rb have dissolved, with Rb substitution into newly formed clay minerals or leached from the soil profile.
Sites with lower Rb in the soil A horizon and top 0- to 5-cm layer (compared to the soil C horizon) in the Piedmont and other parts of the eastern United States, including Ohio, Kentucky, and West Virginia, often have lower clay and higher quartz concentrations in topsoils (soil A horizon and the top 0- to 5-cm layer) than in deeper soils. This is consistent with the weathering of primary minerals leaching Rb out of topsoils in areas of high precipitation.
Large areas of the conterminous United States with low concentrations of Rb in soil likely had soil parent materials with very low amounts of K feldspar and 10 Å clay minerals. These areas include:
- Pacific Northwest and northern California (mafic rocks);
- Texas carbonate terrane (limestone, chalk, and dolostone, or unconsolidated deposits derived from carbonate bedrock); and
- Gulf and Atlantic Coastal Plain (Fenneman and Johnson, 1946) (quartz–rich sedimentary rocks and unconsolidated sediments).
The Gulf and Atlantic Coastal Plain is bisected by the Southern Mississippi River Alluvium and the Southern Mississippi Valley Loess (USDA, 2006). Alluvial sediments have deposited in the Mississippi River valley as the river flooded in recent geologic time. When these sediments dried, winds picked up the fine material and deposited it in thick loess sheets, mainly along the east side of the river valley. The youngest loess sheets are about 10,000 years old. A pattern of higher Rb in soil developed on these young sediments reflects long–range transport of material from areas containing K feldspar and 10 Å clay minerals, and thus Rb, from the upper part of the Mississippi River drainage basin.
Statistics - 0 TO 5 CM
| Number of samples | 4,841 |
| LLD | 0.2 mg/kg |
| Number below LLD | 14 |
| Minimum | <0.2 mg/kg |
| 5 percentile | 10.3 mg/kg |
| 25 percentile | 45.0 mg/kg |
| 50 percentile | 65.2 mg/kg |
| 75 percentile | 84.4 mg/kg |
| 95 percentile | 123 mg/kg |
| Maximum | 299 mg/kg |
| MAD | 29.2 mg/kg |
| Robust CV | 44.8% |
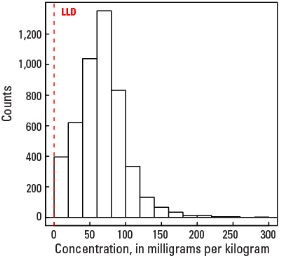
Histogram
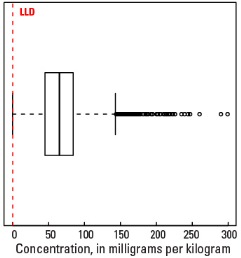
Boxplot
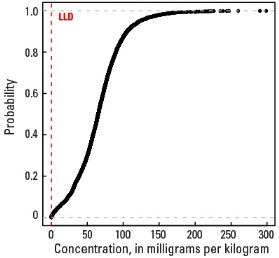
Empirical cumulative distribution function
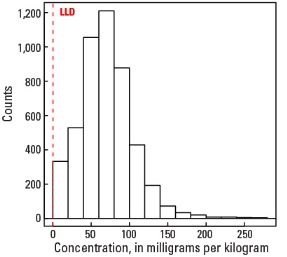
Statistics - A Horizon
| Number of samples | 4,813 |
| LLD | 0.2 mg/kg |
| Number below LLD | 14 |
| Minimum | <0.2 mg/kg |
| 5 percentile | 10.0 mg/kg |
| 25 percentile | 44.7 mg/kg |
| 50 percentile | 65.8 mg/kg |
| 75 percentile | 84.8 mg/kg |
| 95 percentile | 122 mg/kg |
| Maximum | 461 mg/kg |
| MAD | 29.7 mg/kg |
| Robust CV | 45.1 % |
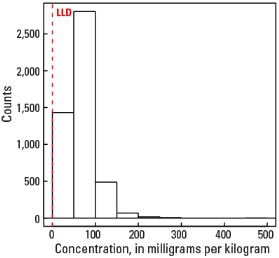
Histogram
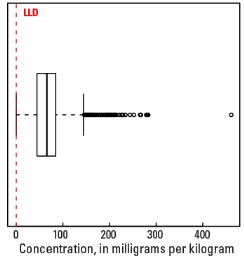
Boxplot
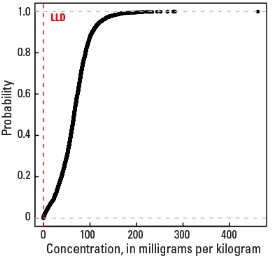
Empirical cumulative distribution function
Statistics - C Horizon
| Number of samples | 4,780 |
| LLD | 0.2 mg/kg |
| Number below LLD | 3 |
| Minimum | <0.2 mg/kg |
| 5 percentile | 13.4 mg/kg |
| 25 percentile | 47.0 mg/kg |
| 50 percentile | 67.2 mg/kg |
| 75 percentile | 89.5 mg/kg |
| 95 percentile | 129 mg/kg |
| Maximum | 267 mg/kg |
| MAD | 31.7 mg/kg |
| Robust CV | 47.2 % |
Histogram
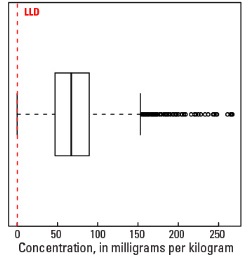
Boxplot