


The purpose of these interpretive discussions is to provide a perspective on regional- and national-scale variations in element and mineral distributions in soils and their likely causes. The significant spatial variations shown by most elements and minerals can commonly be attributed to geologic sources in underlying parent materials, but other spatial variations seem clearly related to additional factors such as climate, the age of soils, transported source material, and anthropogenic influences. We attempt to distinguish the influence of these various factors on a regional and national scale. Numerous more local features might similarly be related to these same factors, but these features also have some probability of being an artifact of a random sampling of variable compositions, so that there is some probability of samples with similar compositions occurring in clusters of two or more adjacent sites by chance. Distinguishing such random occurrences from true variability is beyond the scope of the data from which these maps are constructed. Some caution, therefore, is advisable in interpreting the significance of these more local features unless some unique sources or processes can clearly be related to them.
Barium (Ba) is a metallic trace element used mostly in drilling fluids for oil and gas wells. It is also used in paint and in glassmaking. Barium and its compounds can be toxic when ingested. More information about the toxicity of Ba (or other elements and substances) and its potential negative human health impacts can be found at the Agency for Toxic Substances and Disease Registry (ATSDR) website, or click to download a fact sheet about Ba.
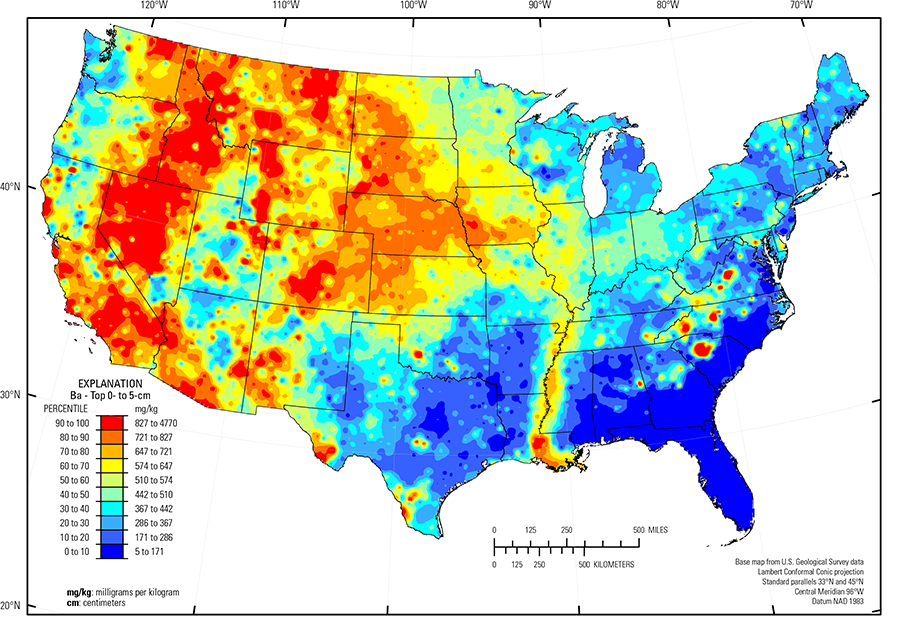
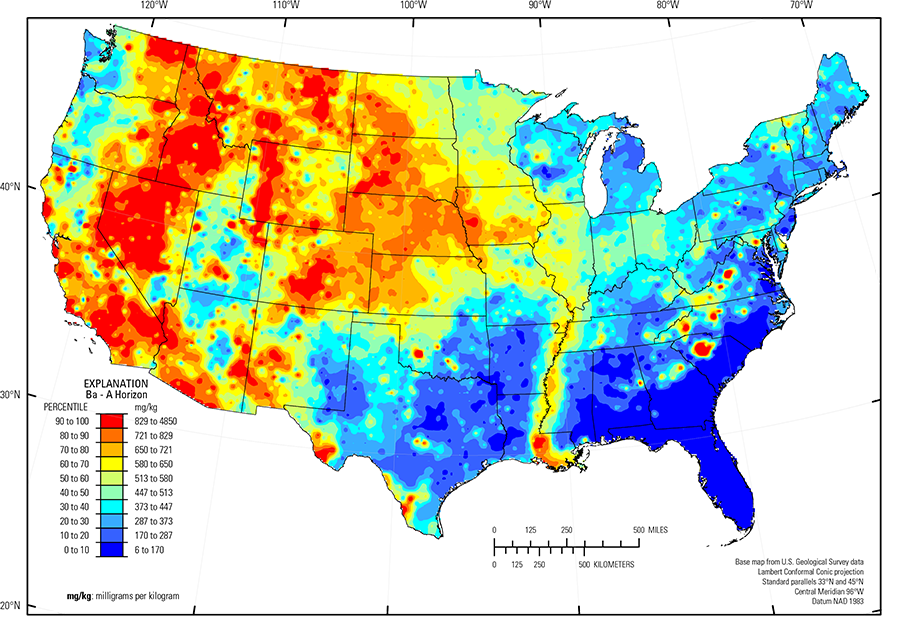
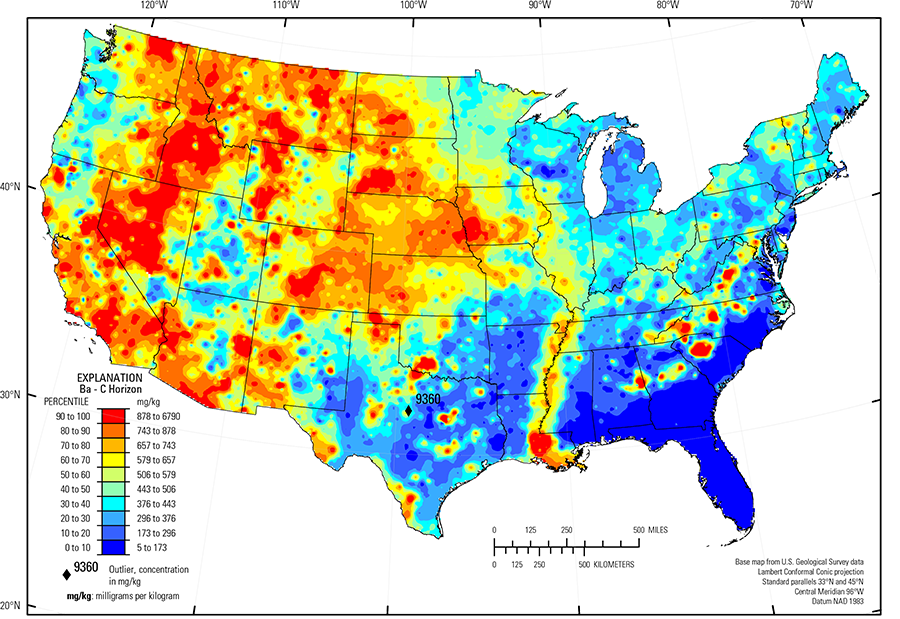
The distribution of Ba in soils across the conterminous United States is primarily controlled by the composition of underlying soil parent materials. Because Ba is geochemically very similar to potassium (K), it can substitute for K in K feldspar and in sheet silicates, such as micas and clay minerals (for example, biotite and illite). The average abundance of Ba in the Earth's upper continental crust is estimated to be 628 milligrams per kilogram (mg/kg) (Rudnick and Gao, 2003). Potassium feldspar and mica are abundant in felsic rocks such as granite and rhyolite, which have an average Ba concentration of about 600 mg/kg. Barium concentrations average about 550 mg/kg in shale but are below the average crustal abundance in most other rock types. The loess deposits of the central United States (Nebraska, Kansas, Iowa, Missouri, Illinois, and Indiana) have an average Ba concentration of about 683 mg/kg. Other unconsolidated sediments, including alluvial, eolian, and glacial deposits, have variable Ba concentrations, depending on source. Potassium feldspar and biotite are susceptible to weathering (biotite more easily than potassium feldspar), but released Ba is relatively immobile in soils as it can precipitate as carbonate or sulfate, if these anions are available, or be absorbed to clays or manganese (Mn) oxides, if available. Other possible important Ba–bearing minerals in soils are witherite (BaCO3) and barite (BaSO4).
The distribution of mineral resource deposits with Ba as a commodity (major or minor) in the United States, extracted from the U.S. Geological Survey (USGS) Mineral Resource Data System (MRDS) website, can be seen by hovering the mouse here. Statistics and information on the worldwide supply of, demand for, and flow of barite are available through the USGS National Minerals Information Center (NMIC) website.
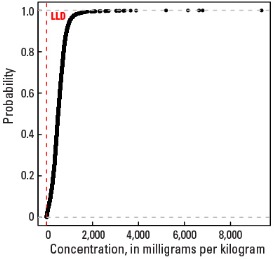
In our data, all analyzed soils have Ba concentrations above the lower limit of determination (5 mg/kg). Barium has a median concentration of 506 mg/kg in the soil C horizon, 513 mg/kg in the soil A horizon, and 510 mg/kg in the top 0- to 5-cm layer (see the summary statistics [open in new window]). An anomalously high value of 9,360 mg/kg Ba in the soil C horizon that was removed prior to constructing the interpolated map is recorded as a diamond symbol. As suggested by similar median concentrations among the three sample types, the Ba spatial map patterns are generally comparable to one another.
The distribution of Ba in soils of the conterminous United States is somewhat complex and difficult to categorize, perhaps because of the variety of sources and sinks for Ba in soils. Much of the distribution of Ba in the soil C horizon matches the pattern for K, as expected because of chemical similarities between Ba and K. High K (or potassium feldspar) concentrations in soils, however, do not ensure high Ba concentrations in soils. Elevated Ba concentrations in many areas do occur in soils developed on potassium feldspar– or mica–bearing granite and rhyolite, or on sedimentary rocks or more recent alluvial and eolian deposits sourced from similar rock types. Examples of such areas (and soil parent materials) include:
- Parts of the Central Rocky Mountains and the Southern Rocky Mountains (USDA, 2006), Colorado, Wyoming, Montana, and Idaho (variety of rock types, including granite and rhyolite);
- Central Nevada Basin and Range and Southern Nevada Basin and Range (USDA, 2006), Nevada and California (felsic volcanic rocks and related alluvium);
- Sierra Nevada Mountains and the Central California Coast Range (USDA, 2006), California (variety of rock types, including granite)
- Mojave Desert and Sonoran Basin and Range (USDA, 2006), California and Arizona (granitic and felsic volcanics); and
- Trans–Pecos volcanics (Schruben and others, 1997), Texas (rhyolite, alkalic volcanic rocks, and related alluvium).
Barium also occurs in some soils that have a shale component, including soils in the Rolling Soft Shale Plain USDA, 2006), in western North Dakota and South Dakota. In eastern Nebraska and western and southern Iowa, relatively high Ba concentrations have been observed in soils that developed on calcareous loess. This high Ba correlates with the occurrence of clay minerals, and is most obvious for 14 Å clays (1 Å (angstrom) = 10-10 meters (m)) in the soil C horizon.
In the Piedmont (Fenneman and Johnson, 1946), Ba is enriched in soils where feldspar or mica occurs in felsic parent materials. Long–term, intense weathering of Piedmont soils has converted many primary silicate minerals, such as feldspar and mica, to clays that may have high Ba concentrations. In contrast, soils in the Atlantic and Gulf of Mexico Coastal Plains (Fenneman and Johnson, 1946) have little Ba, likely because of a lack of original Ba sources in the quartz–rich sedimentary rocks and unconsolidated sediments that underlie much of the region.
Other large areas of the conterminous United States with low Ba concentration in soils are generally underlain by soil parent materials consisting of bedrock or unconsolidated sediments that had low concentrations of Ba. These areas (and dominant soil parent materials) include:
- Colorado Plateau (USDA, 2006) (quartz–rich sandstone and eolian deposits);
- Part of the Southern High Plains (USDA, 2006) (quartz–rich eolian sands and alluvial sediments);
- Texas carbonate terrane (limestone, dolostone, chalk, and marl); and
- Appalachian Plateaus (Fenneman and Johnson, 1946) (cyclic layers of sedimentary rocks, including siltstone and shale).
Occurrences of Ba in soils along the trace of the Missouri and Mississippi Rivers through the midcontinent are well marked. Through north-central Missouri, the Missouri River carries Ba–rich sediment from the shale plains of western North Dakota and South Dakota and loess sheets of eastern Nebraska and western Iowa to the Mississippi River. South of the Missouri River confluence with the Mississippi River, the Atlantic and Gulf of Mexico Coastal Plains (Fenneman and Johnson, 1946) are bisected by the Southern Mississippi River Alluvium (USDA, 2006). Alluvial sediments have deposited in the Mississippi River valley as the river flooded in recent geologic time. A pattern of higher Ba in soils developed on these young alluvial sediments reflects long–range transport of Ba–bearing material from the upper part of the Mississippi River drainage basin.
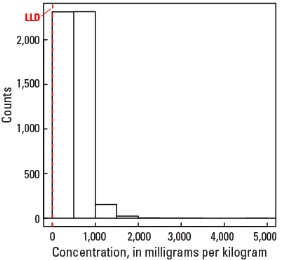
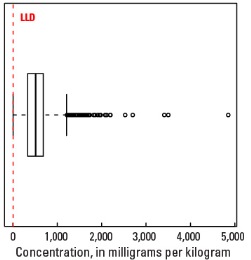
Statistics - 0 TO 5 CM
| Number of samples | 4,841 |
| LLD | 5 mg/kg |
| Number below LLD | 0 |
| Minimum | 5 mg/kg |
| 5 percentile | 86 mg/kg |
| 25 percentile | 329 mg/kg |
| 50 percentile | 510 mg/kg |
| 75 percentile | 683 mg/kg |
| 95 percentile | 956 mg/kg |
| Maximum | 4,770 mg/kg |
| MAD | 262 mg/kg |
| Robust CV | 51.5% |
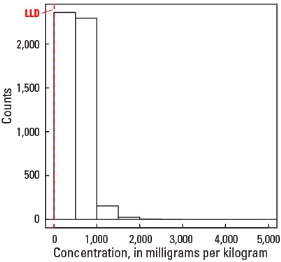
Histogram
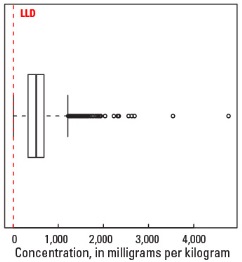
Boxplot
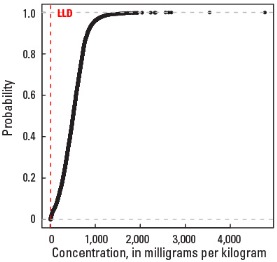
Empirical cumulative distribution function
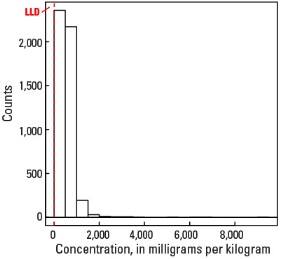
Statistics - A Horizon
| Number of samples | 4,813 |
| LLD | 5 mg/kg |
| Number below LLD | 0 |
| Minimum | 6 mg/kg |
| 5 percentile | 83 mg/kg |
| 25 percentile | 331 mg/kg |
| 50 percentile | 513 mg/kg |
| 75 percentile | 686 mg/kg |
| 95 percentile | 959 mg/kg |
| Maximum | 4,850 mg/kg |
| MAD | 261 mg/kg |
| Robust CV | 50.9 % |
Histogram
Boxplot

Empirical cumulative distribution function
Statistics - C Horizon
| Number of samples | 4,780 |
| LLD | 5 mg/kg |
| Number below LLD | 0 |
| Minimum | 5 mg/kg |
| 5 percentile | 81 mg/kg |
| 25 percentile | 343 mg/kg |
| 50 percentile | 506 mg/kg |
| 75 percentile | 701 mg/kg |
| 95 percentile | 1,020 mg/kg |
| Maximum | 9,360 mg/kg |
| MAD | 265 mg/kg |
| Robust CV | 52.4 % |
Histogram
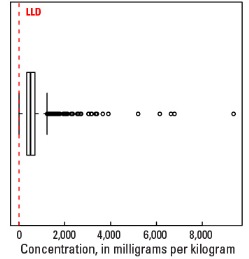
Boxplot