Table of contents | Glossary | Geology | Depositional model | Heterogeneity | Diagenetic history | Petroleum geology | 1) East-West porosity slices | 2) North-South porosity slices | Onion views of 3-D images | 4) Horizontal slices of porosity | 5) Horizontal and East-West permeability and porosity slices
Image files are stored in the esid_gif (east side view of the field) directory. GIF images are named and numbered such that external viewers can correctly sequence files in the folders. Images can be displayed as slide shows using an external viewer, such as JPEGView or LView, or can be accessed as the volporf.MOV (volumetrics of porosity, single fork file format) stand-alone movie in the movies folder.
Before the movies can be opened, you may need to copy to your hard drive a movie-viewing program; information on how to acquire this freeware and software is listed in the readme for movies file. Due to differences in processing speeds we recommend accessing the standalone movie from the movies folder; however, it can generally be started by clicking 3-D distribution and volumes of porosity in 1 to 2 percent increments.

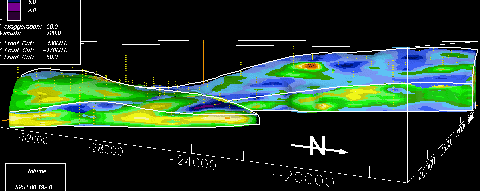
Stripping of layers of porosity in the below images reveals areal distribution, interbedding, and compartmentalization of individual sandstone beds within the Sussex "B" sandstone. Core and borehole porosity data are not smoothed by the gridding process; the wide-spaced X and Y grid spacing results in separate treatment of individual wells. The close-spaced Z grid of about 1-ft intervals displays variation in porosity over short vertical distances; this is particularly apparent in the northern half of the field area. Core porosity values change rapidly over short XYZ intervals when compared to well-log porosity data. This results from interbedding of thin porous sandstones with mudstones and calcite-cemented sandstones, and from smoothing of well-log porosity data due to logging procedures and equipment.
Explanations are included on images; color bars represent porosity distribution in increments of 1 percent. Yellow dots are core and borehole sample location in 3-D space. Vertical exaggeration of the 3-D porosity model is 80 times.

Small-scale 3-D view toward the eastern field boundary shows volume and layers of porosity . Minimum reservoir, and average Sussex "B" sandstone porosity is 8.5 percent (green); average porosity of reservoir intervals is about 13 percent (yellow).
1) 1 to 21 percent porosity - 525.5 million cubic meters. This is the total volume of the reservoir area.
2) 3 to 21 percent porosity - 524.6 million cubic meters
3) 5 to 21 percent porosity - 502.5 million cubic meters
4) 6 to 21 percent porosity - 465.4 million cubic meters
5) 7 to 21 percent porosity - 415.6 million cubic meters
6) 8 to 21 percent porosity - 358.6 million cubic meters. Minimum reservoir porosity is about 8.5 percent. Eight percent porosity and greater comprises approximately 70 percent of the volume of the Sussex "B" sandstone.
7) 9 to 21 percent porosity - 303.9 million cubic meters
8) 10 to 21 percent porosity - 241.3 million cubic meters
9) 11 to 21 percent porosity - 180.5 million cubic meters; or about 35 percent of the field area.
10) 12 to 21 percent porosity - 115.9 million cubic meters; reservoir average porosity is about 12.5 percent. Less than 25 percent of the field volume is 12 percent porosity and greater.
11) 13 to 21 percent porosity - 62.2 million cubic meters; 13 percent and greater is less than 15 percent of the field volume.
12) 14 to 21 percent porosity - 25.9 million cubic meters
13) 15 to 21 percent porosity - 6.6 million cubic meters