Holocene Evolution, OFR 01-076
Home | Intro | Geology | Methods | Animation | Data | GIS | Acknowledgements | References | Appendix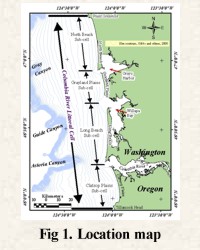 The Columbia River
littoral cell
(CRLC) is found on the
active continental margin of the Pacific Northwest (Komar,
1997). It is bounded
to the south by Tillamook Head, OR and to the north by Point
Grenville, WA. The
cell is characterized by a series of barriers that separate the Columbia River,
Willapa Bay, and Grays Harbor from the open ocean (Fig. 1). These barriers and
the beach plains that abut headlands are all less than 5,000 years old; Clatsop
and Long Beach are the oldest and occur in the southern part of the littoral
cell (Woxell, 1998; Peterson and others,
1999; Herb, 2000). Grayland Plains
and North Beach are younger. A series of shore-parallel dune
ridges are found on each of the barriers and beach plains (Peterson and others,
1999; Reckendorf and others, 2001). The oldest of these dune ridges occur on the
landward sides of the barriers. The accretion history of this coast is recorded
by the progressively younger age of the ridges towards the modern shoreline.
The Columbia River
littoral cell
(CRLC) is found on the
active continental margin of the Pacific Northwest (Komar,
1997). It is bounded
to the south by Tillamook Head, OR and to the north by Point
Grenville, WA. The
cell is characterized by a series of barriers that separate the Columbia River,
Willapa Bay, and Grays Harbor from the open ocean (Fig. 1). These barriers and
the beach plains that abut headlands are all less than 5,000 years old; Clatsop
and Long Beach are the oldest and occur in the southern part of the littoral
cell (Woxell, 1998; Peterson and others,
1999; Herb, 2000). Grayland Plains
and North Beach are younger. A series of shore-parallel dune
ridges are found on each of the barriers and beach plains (Peterson and others,
1999; Reckendorf and others, 2001). The oldest of these dune ridges occur on the
landward sides of the barriers. The accretion history of this coast is recorded
by the progressively younger age of the ridges towards the modern shoreline.
Mineralogy studies indicate that the beaches (Ballard, 1964) and barriers (Herb, 2000) consist primarily of sediment derived from the Columbia River. Seaward of the barriers is a narrow continental shelf that reaches approximately 45 km in width with the shelf edge occurring at approximately 200 m. The shelf surface is smooth and reconnaissance seismic data from the middle and outer shelf show that it is partially mantled by Holocene aged sediment derived from the Columbia River (Nittrouer, 1978; Wolf and others, 1997). The bays that lie landward of the barriers include the Columbia River estuary, Willapa Bay, and Grays Harbor. Presently, these bays are shallow and seismic and borehole data show that Holocene sediment that fills these bays can reach as much as 110 m in thickness (Peterson and Phipps, 1992; Gates, 1994; Cross and others, 1999; Wolf and others, 1998; Herb, 2000). Sediment filling these bays is also primarily derived from the Columbia River (Peterson and Phipps, 1992; Gates, 1994).
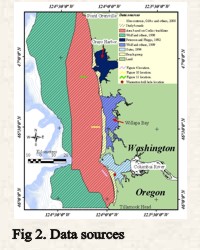 The primary data used to map the Holocene
sedimentary record of the CRLC included
seismic-reflection profiles and borehole information (Fig.
2). The shelf was
mapped exclusively with seismic-reflection profiles. The inner and middle shelf
was mapped using single-channel boomer and sparker profiles collected along
lines spaced approximately 5 km apart (Cross and others,
1998; 1999). Processing techniques applied to these digitally acquired data are
summarized in the Methods section of this report.
Wolf and others (1997) using widely spaced analog seismic
data mapped the outer shelf. Holocene
sediment thickness for the parts of the shelf that were not surveyed by Cross
and others (1998; 1999) were digitized and merged with the more detailed middle
and inner shelf seismic data set. The Holocene section of the barriers and
beaches was derived from boreholes and water well results that were studied by a
large group of researchers referred to as the "Beach Group" in Figure
2. Much of the preliminary results of this group's efforts are
summarized by Woxell (1998), Peterson
and others (1999), and Herb (2000). In Grays Harbor, Peterson and Phipps (1992) studied the Holocene
deposits using both seismic-reflection profiles and borehole results. Wolf and
others (1998) mapped Willapa Bay using seismic-reflection profiles, and the
Columbia River estuary west of approximately the Astoria Bridge used borehole
information (Gates, 1994), seismic-reflection profiles
(Cross and others, 1999),
and a deep borehole at Warrenton, OR (Herb, 2000). A detailed description of the
procedures used to merge these different data sets is given in the Methods
section of this report.
The primary data used to map the Holocene
sedimentary record of the CRLC included
seismic-reflection profiles and borehole information (Fig.
2). The shelf was
mapped exclusively with seismic-reflection profiles. The inner and middle shelf
was mapped using single-channel boomer and sparker profiles collected along
lines spaced approximately 5 km apart (Cross and others,
1998; 1999). Processing techniques applied to these digitally acquired data are
summarized in the Methods section of this report.
Wolf and others (1997) using widely spaced analog seismic
data mapped the outer shelf. Holocene
sediment thickness for the parts of the shelf that were not surveyed by Cross
and others (1998; 1999) were digitized and merged with the more detailed middle
and inner shelf seismic data set. The Holocene section of the barriers and
beaches was derived from boreholes and water well results that were studied by a
large group of researchers referred to as the "Beach Group" in Figure
2. Much of the preliminary results of this group's efforts are
summarized by Woxell (1998), Peterson
and others (1999), and Herb (2000). In Grays Harbor, Peterson and Phipps (1992) studied the Holocene
deposits using both seismic-reflection profiles and borehole results. Wolf and
others (1998) mapped Willapa Bay using seismic-reflection profiles, and the
Columbia River estuary west of approximately the Astoria Bridge used borehole
information (Gates, 1994), seismic-reflection profiles
(Cross and others, 1999),
and a deep borehole at Warrenton, OR (Herb, 2000). A detailed description of the
procedures used to merge these different data sets is given in the Methods
section of this report.
Radiocarbon dates from wells on the barrier beaches, and in the bays, were used to provide age control for the Holocene section. Several boreholes in Grays Harbor and the Columbia River estuary penetrated the Holocene section, and samples immediately above the unconformity at the base of the Holocene were dated to determine when sediment started accumulating. Dates within the Holocene were used to determine sedimentation rates (Peterson and Phipps, 1992; Baker, personal communication). No age control is available for Willapa Bay. Age control for barrier and beach formation came from two sources: boreholes and dune ridges. Many of the boreholes penetrated the entire Holocene section under the barriers. The age of the ravinement surface and rates of sediment accumulation were derived from these holes. Parallel dune ridges characterize the barrier spits and beaches of the CRLC. These ridges can be traced throughout large parts of the littoral cell, and radiocarbon dates show that the individual ridges are isochronous. Ridges along the back edges of barriers and beach plains are the oldest and the dune ridges become progressively younger towards the modern beach (Reckendorf and others, 2001; Peterson, personal communication). Deep cores have not been collected on the shelf. Here, ages are inferred from the adjacent coastal wells.
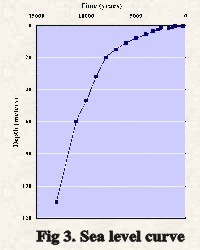
A sea level curve for the Pacific Northwest first was published by Peterson and Phipps (1992), and recently has been modified by Peterson (personal communication). This modified sea level curve incorporated additional information from Shennan and others, (1996) and Atwater and Hemphill-Haley, (1997) that was not available when the initial curve was created. This sea level curve is shown in Figure 3.
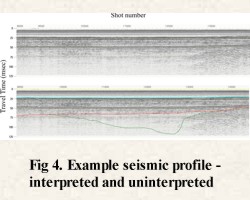
Three surfaces were identified in the seismic profiles and boreholes, and could be traced throughout the CRLC. These three surfaces; lowstand, ravinement, and present are defined below.
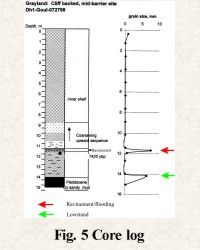
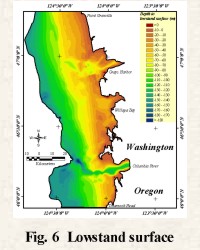
The lowstand surface is an erosional surface that was cut during glacial times when sea level was as much as 150 m lower than present. This surface shows on seismic profiles as an irregular surface cut by river valleys (Fig.4). In cores this unconformity is usually marked by a dramatic facies change (Fig.5). The Holocene sediment is mostly fine to very-fine sand while the underlying strata are mostly coarse-grained Quaternary glacial deposits or Tertiary rocks (McCrory, 1997). The mapped lowstand surface is shown in Figure 6.
 Ravinement
surface
Ravinement
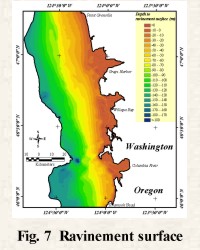
surfaceThe ravinement surface is the erosional component of the surface formed by coastal processes as sea level rose during post-glacial times and the coast moved landward across the continental shelf. The ravinement surface is left in the wake of those parts of the coast exposed to oceanographic processes, while a flooding surface is a time equivalent surface that formed in the sheltered bays and estuaries. Under much of the shelf of the CRLC, the ravinement and lowstand surfaces coincide. They only diverge where they cross the offshore extensions of river valleys. In the paleo-river valleys, the ravinement surface is nearly flat and extends from one rim of the valley to the other (Fig. 4). The implication of this geometry is that the river valleys were nearly filled with sediment prior to the coastline transgressing across them (Fig. 7). The present Columbia River, Willapa Bay, and Grays Harbor are shallow and nearly filled with sediment. Their mouths, except where dredged, are also shallow. As with the paleo-river valleys, the flat-lying nature of the offshore ravinement surface indicates that these paleo-bays were completely filled with sediment prior to transgression.
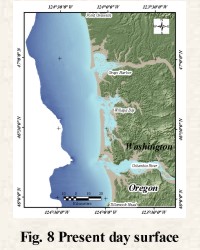
The present surface is a combination of the present day seafloor and land surface. This surface is the top of the Holocene section. The present surface was generated by integrating the offshore bathymetry based on seismic data and NOS point data (NOAA-NGDC, 1998) with the on-land digital elevation model (DEM) that was compiled by the Washington Department of Ecology for this project (R. Daniels, personal communication) (Fig. 8). A discussion of the data used and how they were combined is given in the Methods section of this report.
Several assumptions had to be made as this data set was compiled in order to compute sediment volumes and to predict shoreline locations during the last 11,000 years. This section describes these assumptions.
The velocity of sound in sediment is needed to convert travel times on the seismic profiles to depths. There are no published measurements of the velocity of sound on this shelf although there have been measurements made on the beaches (Peterson, personal communication) and in Grays Harbor (Peterson and Phipps (1992) and in the Columbia River (Gates, 1994). On the shelf, assumed velocities of 1,500-1,640 m/s have been used to convert seismic travel time to depth (Nittrouer, 1978; Wolf and others, 1997, Cross and others, 1999). Here a velocity of sound in sediment of 1,600 m/s is used. This is the velocity used by Peterson and Phipps (1992) based on calibrating seismic profiles at the mouth of Grays Harbor with nearby boreholes. The velocity of sound in water of 1,500 m/s was used.
Sediment accumulation rates are needed for the shelf, barrier, and bay provinces of the CRLC in order to determine how sediment supply to the system has changed during the Holocene. Actual measurements of sedimentation rates are scarce, and below are summarized the assumptions about sedimentation rates used in this study.
In the bays, it was assumed that sediment completely filled the available space and that sedimentation rate is tied to sea level. This assumption is based on the nature of the ravinement surface where it crosses paleo-valleys. On sesmic profiles that cross paleo-valleys, the ravinement surface is flat and at the level of the rim of the valley (Fig. 4). This geometry indicates that these valleys were completely filled with sediment prior to formation of the ravinement surface. Well information from both Grays Harbor (Peterson and Phipps, 1992) and the Columbia River (Gates, 1994) show that Holocene sediment accumulation rates were higher 6,000-10,000 yr BP than they were 6,000 yr BP to the present. Generally, accumulation rates in the bays are tied to the rate of sea level rise.
On the barriers, sediment accumulation rates have been shown to be sporadic and tied to earthquake events (Atwater and Hemphill-Haley, 1997, Meyers and others, 1996). However, long-term sedimentation rates appear to be fairly constant. Herb (2000) found an average sedimentation rate of 1.3 x 10⁶ m3/yr based on results from the boreholes. Woxell (1998) found that prehistoric beach accretion rates derived from the ages of dune ridges and earthquake scarps were fairly constant (0.5-0.7 m/yr), but increased dramatically during historic times. Unfortunately, sediment accumulation rates are not available for the shelf environment. We have assumed a constant sedimentation rate for the shelf deposit.
 The location of the boundaries between the
different depositional environments was derived in two different ways for different
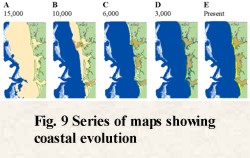
times during the Holocene. From 11,000-5,000 yr BP the ravinement surface was
used to separate shelf from bay deposits. The elevation of sea level for a given
time was identified on the sea level curve (Fig. 3), and this contour was then picked off
the ravinement surface and used as the boundary (Figs. 7,
9). Deposits landward
of this line are bay deposits that mostly occur in the paleo-river valleys, and
those seaward of this line are shelf deposits. Prior to 5,000 yr BP, it appears
that beaches were a minor part of the deposit as they cannot be resolved on
seismic profiles.
The location of the boundaries between the
different depositional environments was derived in two different ways for different
times during the Holocene. From 11,000-5,000 yr BP the ravinement surface was
used to separate shelf from bay deposits. The elevation of sea level for a given
time was identified on the sea level curve (Fig. 3), and this contour was then picked off
the ravinement surface and used as the boundary (Figs. 7,
9). Deposits landward
of this line are bay deposits that mostly occur in the paleo-river valleys, and
those seaward of this line are shelf deposits. Prior to 5,000 yr BP, it appears
that beaches were a minor part of the deposit as they cannot be resolved on
seismic profiles.
After 5,000 yr BP, the barrier beaches started to form, and the CRLC had three rather than two depositional environments associated with it. Beach ridge information along with the sea level curve and ravinement surface information was used to generate the boundaries between shelf, bay, and beach environments. The 1,000 yr BP shoreline locations were interpolated between the known dates on the barriers, and shoreline locations at these time intervals were drawn parallel to the nearest dune ridge (Fig. 9). Further details on how these boundaries were derived are given in the Methods section.
Today's CRLC is the cumulative result of geologic and oceanographic processes acting on this area since the retreat of the last glacier approximately 15,000 years ago. At the onset of the Holocene, sea level was about 150 m lower than the present (Fairbanks, 1989); it initially rose rapidly and slowed later in the Holocene (Fig. 3). Coincident with the melting of the glaciers, a huge amount of sediment was transported through rivers to the ocean. The amount of sediment transported by the Columbia River varied through time, and much of it was deposited in the CRLC. Here we describe the long-term interplay between coastal oceanographic processes and the huge volume of sediment brought to this coastal environment by the Columbia River.
15,000 yr BP, the shoreline was near the shelf edge, and rivers had eroded deep valleys across the shelf (Fig. 9A). The Columbia River extended to the head of Astoria Canyon, the Chehalis River probably extended to Grays or Guide Canyon, but no river valley is preserved offshore of Willapa Bay. Presently the rivers entering Willapa Bay are small, and the shelf valley created by these rivers may have been so small the erosional processes associated with the transgression erased it. At this time, most of the sediment brought down the Columbia River was discharged into the head of Astoria Canyon and transported down the canyon to the deep sea. It appears that virtually no sediment accumulated in this river valley or presumably on the shelf at this time as a deep well in the paleo-Columbia River valley shows that sediment did not start to accumulate here until approximately 13,000 yr BP (Baker, personal communication).
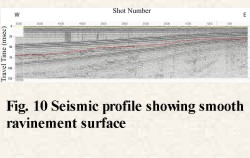 While
sea level rose, the shoreline
retreated across the continental shelf leaving the well-defined ravinement
surface. The seismic data also show that no clearly defined beach deposits were
left abandoned on the shelf in the wake of the rising sea (Fig.
10). By 12,000 yr BP, sea level had risen to –100 m, and in the next 2,000 years
sea level
rose from –100 m to –47 m (Fig. 3). The shoreline and associated facies boundary
between shelf and bay deposits swept rapidly across the shelf during this early
part of the Holocene. By 10,000 yr BP the facies boundary and inferred shoreline
was 5-15 km west of its present location (Fig. 9B). At this time, the Chehalis
River valley was submerged approximately to where it intersects the present shoreline.
It was filled with
bay and fluvial deposits (Peterson and Phipps
(1992). Sediment also accumulated
in the Columbia River estuary and on the shelf at this time (Fig. 9B). Willapa Bay was still
isolated from the coast, and did not become a sediment sink for another 2,000
years. Drill results from the Columbia River as well as from the Grays Harbor
area show that these two valleys were filled nearly to the level of the sea at
that time (i.e. –47 m). Offshore, seismic profiles also show that the valleys
were completely filled prior to shoreline crossing that part of the valley
because the ravinement surface cut by the landward migration of the coast cuts
the valley fill deposits (Fig. 4). The sediments deposited in both valleys were
primarily sands although estuarine mud was deposited at the head of Grays Harbor
at this time (Peterson and Phipps, 1992). Much of the sediment near the present
mouth of Grays Harbor was sand, and the mineralogy suggests a Columbia River
source (Peterson and Phipps (1992). It appears that sand escaped the mouth of
the Columbia River, and transported northward either on the shelf or along a
subsequently erased coastline. Then the sand was carried into the drowned
Chehalis River valley. The landward dipping reflectors in the sediment filling the paleo-Chehalis
valley document this onshore transport of sediment into this bay (Fig.
11).
While
sea level rose, the shoreline
retreated across the continental shelf leaving the well-defined ravinement
surface. The seismic data also show that no clearly defined beach deposits were
left abandoned on the shelf in the wake of the rising sea (Fig.
10). By 12,000 yr BP, sea level had risen to –100 m, and in the next 2,000 years
sea level
rose from –100 m to –47 m (Fig. 3). The shoreline and associated facies boundary
between shelf and bay deposits swept rapidly across the shelf during this early
part of the Holocene. By 10,000 yr BP the facies boundary and inferred shoreline
was 5-15 km west of its present location (Fig. 9B). At this time, the Chehalis
River valley was submerged approximately to where it intersects the present shoreline.
It was filled with
bay and fluvial deposits (Peterson and Phipps
(1992). Sediment also accumulated
in the Columbia River estuary and on the shelf at this time (Fig. 9B). Willapa Bay was still
isolated from the coast, and did not become a sediment sink for another 2,000
years. Drill results from the Columbia River as well as from the Grays Harbor
area show that these two valleys were filled nearly to the level of the sea at
that time (i.e. –47 m). Offshore, seismic profiles also show that the valleys
were completely filled prior to shoreline crossing that part of the valley
because the ravinement surface cut by the landward migration of the coast cuts
the valley fill deposits (Fig. 4). The sediments deposited in both valleys were
primarily sands although estuarine mud was deposited at the head of Grays Harbor
at this time (Peterson and Phipps, 1992). Much of the sediment near the present
mouth of Grays Harbor was sand, and the mineralogy suggests a Columbia River
source (Peterson and Phipps (1992). It appears that sand escaped the mouth of
the Columbia River, and transported northward either on the shelf or along a
subsequently erased coastline. Then the sand was carried into the drowned
Chehalis River valley. The landward dipping reflectors in the sediment filling the paleo-Chehalis
valley document this onshore transport of sediment into this bay (Fig.
11).
The continued rapid rise of sea level forced the shoreline to retreat across the shelf to nearly its present location by 6,000 yr BP. At this time sea level was 11 m lower than present. Willapa Bay finally had been flooded, and because the barriers had not yet formed, the shoreline had a more irregular shape than it does today (Fig. 9C). Cores from both bays and the Columbia River show that all three were essentially filled to sea level with sediment. Drill holes along Long Beach suggest that shelf sands underlie at least the seaward part of this barrier, while estuarine deposits are found in some of the cores from the Willapa Bay side of the barrier (Herb, 2000). It is unknown how open Willapa Bay and Grays Harbor were to the ocean, but the presence of estuarine deposits in Willapa Bay suggests the existence of shoals that sheltered this bay from the open ocean. The deposit on the shelf continued to thicken as well as to expand northward. The landward limit of the shelf deposit is uncertain, but many of the drill holes through the Clatsop, Long Beach, and Grayland barriers found them to be built on shelf sands. At this time, the shelf deposit appears to have extended somewhat landward of the present shoreline.
Between 6,000 and 3,000 yr BP, the rate of sea level rise slowed and the coastal environment changed dramatically. Whereas sea level rose 53 m between 12,000 and 10,000 yr BP, it rose only 5.5 m between 6,000 and 4,000 yr BP (Fig. 3). During this time, the barrier beaches started to form and the shoreline changed from a retreating to an accreting coast. By 3,000 yr BP barriers had started to form in the Clatsop and Long Beach subcells (Fig. 9D), but the Grayland and North Beach barriers did not form until later (Woxell, 1998; Herb, 2000). At this time the barriers were narrow and did not extend as far north as they do now (Fig. 9E). Presently, the barriers and beaches are the largest they ever have been, and the river and bay mouths are narrower than they were 6,000 yr BP (Fig. 9C) or 3,000 yr BP (Fig. 9D).
 During the Holocene, approximately 130 km3
of sediment derived from the Columbia River accumulated within the study
area. This estimate comes from subtracting the lowstand surface (Fig.
6) from the present day surface (Fig. 8).
Sediment, however, has not been spread evenly throughout the littoral cell. The
sediment sinks can be divided into three general depositional environments:
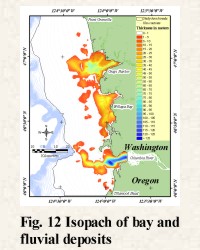
bay/fluvial, shelf, and barriers/beaches. The bay/fluvial environment consists
of sediment bounded by the lowstand surface (Fig. 6)
and the ravinement surface (Fig. 7). The bulk of
the sediment in this depositional environment occupies the Holocene extent of Grays Harbor, Willapa Bay, and Columbia River estuary west of approximately
Astoria, OR (Fig. 12).
A smaller amount is found in isolated depressions that are separated from these
three large depocenters. We combine the bay and fluvial environments because there
are not enough cores to adequately differentiate them (Peterson and Phipps,
1992; Herb, 2000), and because both fill valleys and were deposited prior to the
time of ravinement (Fig. 4). Nearly 43 km3 of sediment has
accumulated in the bay/fluvial environment, which accounts for 33% of the total
volume within the CRLC. Grays Harbor and the offshore
extension of the paleo-Chehalis River contain 15 km3. Willapa Bay,
which has no offshore river valley, contains 8 km3. The Columbia
River estuary and its offshore extension contain 17 km3 (Table
1). Isolated basins on the shelf account for the remaining 3 km3.
Gates (1994) found that approximately 75 km3 of sediment deposited
during the Holocene in the Columbia River basin west of Portland, OR, and our
study only covers the westernmost part of his study area. Thus the Columbia
River basin is the largest bay/fluvial depocenter. If the entire
Columbia River basin is included, bay/fluvial environments are the largest sink
of Columbia River sediment within the littoral cell.
During the Holocene, approximately 130 km3
of sediment derived from the Columbia River accumulated within the study
area. This estimate comes from subtracting the lowstand surface (Fig.
6) from the present day surface (Fig. 8).
Sediment, however, has not been spread evenly throughout the littoral cell. The
sediment sinks can be divided into three general depositional environments:
bay/fluvial, shelf, and barriers/beaches. The bay/fluvial environment consists
of sediment bounded by the lowstand surface (Fig. 6)
and the ravinement surface (Fig. 7). The bulk of
the sediment in this depositional environment occupies the Holocene extent of Grays Harbor, Willapa Bay, and Columbia River estuary west of approximately
Astoria, OR (Fig. 12).
A smaller amount is found in isolated depressions that are separated from these
three large depocenters. We combine the bay and fluvial environments because there
are not enough cores to adequately differentiate them (Peterson and Phipps,
1992; Herb, 2000), and because both fill valleys and were deposited prior to the
time of ravinement (Fig. 4). Nearly 43 km3 of sediment has
accumulated in the bay/fluvial environment, which accounts for 33% of the total
volume within the CRLC. Grays Harbor and the offshore
extension of the paleo-Chehalis River contain 15 km3. Willapa Bay,
which has no offshore river valley, contains 8 km3. The Columbia
River estuary and its offshore extension contain 17 km3 (Table
1). Isolated basins on the shelf account for the remaining 3 km3.
Gates (1994) found that approximately 75 km3 of sediment deposited
during the Holocene in the Columbia River basin west of Portland, OR, and our
study only covers the westernmost part of his study area. Thus the Columbia
River basin is the largest bay/fluvial depocenter. If the entire
Columbia River basin is included, bay/fluvial environments are the largest sink
of Columbia River sediment within the littoral cell.
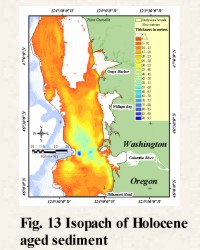 The
volume of sediment that has accumulated above the ravinement surface is 87.910
km3, and it is divided between the shelf and barrier/beach
environments. The shelf component of the deposit is divided into two
parts: that which accumulated before 11,000 yr BP (9.053 km3)
and that which accumulated after 11,000 yr BP (77.311 km3)
(Table 1). Within the study area, the shelf
deposit accounts for approximately 66% of the total sediment volume. The shelf deposit
overlies the ravinement surface. It extends from Tillamook Head, OR north past
Point Grenville, WA (Fig. 13). This deposit is as much as 50 m thick under the
middle shelf off the mouth of the Columbia River, it thins westward and pinches
out before the shelf edge, and it thins away from the Columbia River mouth both
to the north and south (Fig. 13). Along its
landward side the shelf deposit is
15-30 m thick off Clatsop and Long Beach, and appears to underlie at least the
seaward parts of these beaches. Off Grayland, the inner shelf has only a thin
sediment cover, and north of Grays Harbor there is at most a discontinuous thin
(less than 1 m) blanket of Holocene sediment on the inner shelf (Fig.
13).
The
volume of sediment that has accumulated above the ravinement surface is 87.910
km3, and it is divided between the shelf and barrier/beach
environments. The shelf component of the deposit is divided into two
parts: that which accumulated before 11,000 yr BP (9.053 km3)
and that which accumulated after 11,000 yr BP (77.311 km3)
(Table 1). Within the study area, the shelf
deposit accounts for approximately 66% of the total sediment volume. The shelf deposit
overlies the ravinement surface. It extends from Tillamook Head, OR north past
Point Grenville, WA (Fig. 13). This deposit is as much as 50 m thick under the
middle shelf off the mouth of the Columbia River, it thins westward and pinches
out before the shelf edge, and it thins away from the Columbia River mouth both
to the north and south (Fig. 13). Along its
landward side the shelf deposit is
15-30 m thick off Clatsop and Long Beach, and appears to underlie at least the
seaward parts of these beaches. Off Grayland, the inner shelf has only a thin
sediment cover, and north of Grays Harbor there is at most a discontinuous thin
(less than 1 m) blanket of Holocene sediment on the inner shelf (Fig.
13).
The barriers and beaches, based on the computations summarized in Table 1, account for 1.5 km3 of the total volume of sediment derived from the Columbia River. This volume is approximately 1% of the total. The actual volume of beach sediment is difficult to estimate because it is indistinguishable from the shelf sediment that it rests on in most places, and other researchers have suggested slightly larger volumes than come from these computations. Herb (2000) interpreted some of the sediment under the barriers to be shelf deposits, and she estimates that the barrier beaches contain 2-3 km3. Meyers and others (1996) interpreted all the sediment under the barriers that is above the ravinement surface to be beach deposits. If everything above the ravinement surface is interpreted to be beach deposits then the volume increases to approximately 4 km3, and the shelf volume would descrease by approximately 2.5 km3. Even using the largest volume estimate for the barriers, the barrier environment accounts for less than 3% of the total volume of sediment within the CRLC.
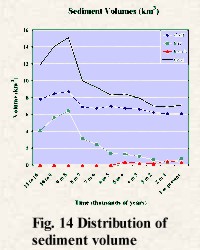 The timing of when sediment accumulation was
initiated and the rates of sediment deposition varied for the three
environments. The submerging river valleys were the first areas in the CRLC to receive sediment. Sediment started accumulating in the
Columbia River valley around 13,000 yr BP and has continued to the present
(Baker, personal communication). The rate of accumulation in the bays is
primarily controlled by sea level (Peterson and Phipps,
1992). As the rate of sea level rise slowed, the amount of sediment deposited in the bays decreased
because the accommodation space decreased (Fig. 14). The initiation of sediment
accumulation on the shelf is uncertain because no cores are available but the shelf
probably was not a major sediment sink prior to 12,000 yr BP. At this
time the shelf was narrow and the Holocene sediment cover thin. Also, prior to
the Columbia River valley filling with sediment, most of the sediment derived
from this river is thought to have been transported directly to the deep sea (Sternberg,
1986). As sea level rose, the shelf area increased. Radiocarbon dates from the
part of the shelf deposit underlying the barrier beaches suggest that it
accumulated at a constant rate. The volume per 1,000-year time interval increased
until about 8,000 yr BP. The volume then started to decrease (Fig.
14). The
volume of sediment deposited on the shelf initially was low because of the small
shelf area, and it increased rapidly as the size of the shelf increased with the
rising sea level. It also started to decrease about 8,000 yr BP. The beaches and
barriers were the last environment to form. Rates for this environment
are low, but have increased slightly through time.
The timing of when sediment accumulation was
initiated and the rates of sediment deposition varied for the three
environments. The submerging river valleys were the first areas in the CRLC to receive sediment. Sediment started accumulating in the
Columbia River valley around 13,000 yr BP and has continued to the present
(Baker, personal communication). The rate of accumulation in the bays is
primarily controlled by sea level (Peterson and Phipps,
1992). As the rate of sea level rise slowed, the amount of sediment deposited in the bays decreased
because the accommodation space decreased (Fig. 14). The initiation of sediment
accumulation on the shelf is uncertain because no cores are available but the shelf
probably was not a major sediment sink prior to 12,000 yr BP. At this
time the shelf was narrow and the Holocene sediment cover thin. Also, prior to
the Columbia River valley filling with sediment, most of the sediment derived
from this river is thought to have been transported directly to the deep sea (Sternberg,
1986). As sea level rose, the shelf area increased. Radiocarbon dates from the
part of the shelf deposit underlying the barrier beaches suggest that it
accumulated at a constant rate. The volume per 1,000-year time interval increased
until about 8,000 yr BP. The volume then started to decrease (Fig.
14). The
volume of sediment deposited on the shelf initially was low because of the small
shelf area, and it increased rapidly as the size of the shelf increased with the
rising sea level. It also started to decrease about 8,000 yr BP. The beaches and
barriers were the last environment to form. Rates for this environment
are low, but have increased slightly through time.
In summary, the integration of these varied data types allowed studying the entire CRLC rather than only individual parts within the system. Although we did not study the bay/fluvial environment in its entirety, our findings in concert with the work by Gates (1994) shows that this environment has been the largest sink of Columbia River sediment during the last 11,000 years. The shelf is the next largest sink while the beaches, although perhaps the most important, comprise less than 3% of the total volume. The evolution of this coast, which has been derived from this integrated study, shows that the barrier-beach system is the most recent addition to this littoral cell. This volumetric and chronologic overview of this littoral cell provides a unique framework for more detailed or site-specific studies. It also provides a new way to compare this coastal system to other coastal systems.
We acknowledge the assistance of several people in the collection, processing, and compilation of this data set. Dan O´Hagan and George Maddox of the Washington State Department of Fish and Wildlife are acknowledged for their skilled operation of the RV CORLISS. George Kaminsky of the Washington State Department of Ecology is acknowledged for his assistance in arranging for the use of the RV CORLISS. Ken Parolski provided technical support for the field operation during both field seasons, and Scott Harrison assisted in collection of the data in 1997. Dave Foster provided valuable advice on techniques to process the data. We also acknowledge valuable discussions during workshops that were organized by the USGS and Washington State Department of Ecology for this cooperative study. Data exchange and valuable discussions with Curt Peterson, Guy Gelfenbaum, Sandy Vanderburgh, Jim Phipps, Peter Cowell, and David Percy have greatly improved the content of the GIS presented in this report. The report benefited from the reviews of Becky Deusser, Dave Foster, and Guy Gelfenbaum.
[an error occurred while processing this directive]