|
 |
 |
Primary Products - Overview Maps & Evolution Overview:
|
|
|
|
|
|
|
|
|
|
|
|
|
|
|
|
|
|
|
|
 |
|
|
|
|
|
|
|
|
|
|
|
|
|
|
|
Tile 6
Looe Key Reef: Looe Key Reef is the easternmost of several named Holocene shelf-edge reefs in the Tile 6 sector (Figs. 86C, 87A, 87B). The former Looe Key National Marine Sanctuary (Fig. 86C) contains what has been informally known as a 'core' area (Fig. 88, dotted lines mark approximate boundary) in the center of the Looe Key Sanctuary (e.g., Lidz et al., 1985; Bohnsack et al., 2003). The core area includes the shallow reef, its backreef flat, and part of the sand and sea grass that lie within the coral rubble 'horns.' The FKNMS has designated the core area as a Sanctuary Preservation Area. A small area in the northeast corner of the Looe Key Sanctuary is a Research Only Area. The rest of the area within the Looe Key Sanctuary is now an Existing Management Area (see Marine Sanctuaries).
In 1983, NOAA funded a concentrated, quantitative resource inventory in the Looe Key NMS, conducted in cooperation with the University of Miami, the USGS, and the Florida Department of Natural Resources (Bohnsack et al., 2003). Studies included descriptions of general habitat types, coral abundance and distribution, growth history of Montastrea annularis, reef fish abundance and distribution, and status of selected resources.
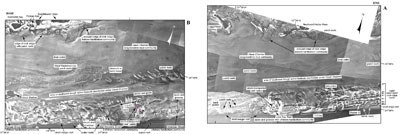 |
| Figure 87. Contiguous aerial photos (1975) show seabed features and habitats seaward of (A) the Newfound Harbor Keys (middle Keys, Tile 5) and (B) the Saddlebunch Keys (lower Keys, Tile 6; from Lidz et al., 2006). Shelf-edge reefs include Looe Key Reef and reefs at American, Maryland, and Pelican Shoals, and at Eastern Sambo. Eastern Sambo lies just out of the photo in (B) at the left edge. Classification of marine habitats and ecosystems follows those of Marszalek (1977) and Lidz et al. (1997b). The parts of the keys visible in these photos are mangrove habitats (see Benthic Ecosystems for Tile 6, and benthic organisms in Table 2). Note that head corals form patch reefs on the nearshore rock ledge (outlined by black dotted lines in A and B). The ledge ranges in water depth from 0 to ~4 m. The seagrass/lime-mud community in Hawk Channel, including the two bedrock troughs, is the largest ecosystem along the entire shelf off the keys (see pie chart). Note than many patch reefs aligned along the landward edge of the trough in both photos. The seagrass/sand community, usually confined to areas of the outer shelf, is the second largest ecosystem. Also note eight linear old reef-line trends on the outer shelf (arrows at right edge of photo in A). They are believed to be narrow coral reefs separated by sediment-filled swales, such as have been cored near Marker G (Shinn et al., 1977a; Fig. 79A). The reef lines are readily visible behind Marker G, can be traced just west of Looe Key Reef (small black arrows on photo A), then become less visible westward until they are again observed more clearly between Maryland and Pelican Shoals (small black arrows on photo B). Offshore hardbottom communities occupy the rock ridges and senile coral reefs at the shelf edge. Senile reefs are those that are not actively accreting reef framework. Also note presence of outlier reefs and storm-transported rubble between American and Maryland Shoals (red dotted line in B). Outlier reefs formed on a 30- to 40-m-deep upper-slope terrace seaward of the shelf-edge reef (Lidz et al., 1991). [larger version] |
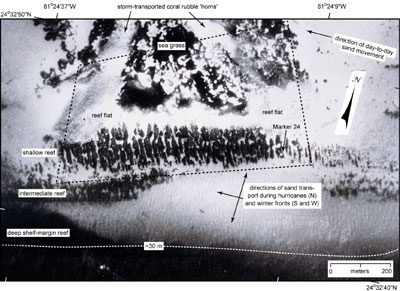
Figure 88. Closeup aerial view of Looe Key Reef 'core' area (black dotted lines) shows its various reef zones in 1975. Each zone consists of spurs and grooves that are being buried by sand. The intermediate reef is actually two reef trends, easily discernible in distal photos (Fig. 87A). The deep reef is a section of the shelf-margin reef at the south edge of the Looe Key Sanctuary. The deep reef is continuous in this area, extending east and west several hundred meters within the Sanctuary, and is being buried by a prominent sand lobe (Lidz et al., 1985). Sand coverage extends seaward and westward, indicating southward and westward directions of transport. The rubble 'horns' landward of the reef zones consist of storm-transported pebble- to boulder-size coral debris (4 to 256 mm). Area of reef flat at right near U.S. Coast Guard Marker 24 is awash at low tide. [larger version] |
The USGS contribution to the inventory was geologically oriented. Core transects and seismic surveys were used to map subsurface geology and Holocene sediment thickness and distribution (Shinn et al., 1989a). Sedimentary petrology was used to determine primary constituent grains (Lidz et al., 1985). Analyses of the 1983 sediments showed that a definitive correlation existed between high percentages of coral grains in the sand and high percentages of dead corals observed in the field. Coral grains thus became established as bioindicators of general health or malaise of a reef system (Lidz et al., 1985). This petrologic finding was subsequently confirmed elsewhere. Similar results were found in Belize (Aronson and Precht, 1997, 2001), in Jamaica (Precht and Aronson, 1997), and throughout the Florida Keys (Figs. 59, 61, 62, 63, 66; Lidz and Hallock, 2000).
Several geologically distinctive features either not present or currently not recognized elsewhere along the reef tract are found at Looe Key Reef (e.g., Lidz et al., 1985).
- Two elongate areas of storm-transported reef rubble form "horns" that surround a seagrass-flat zone of patchy sand and Thalassia testudinum landward of the reef (Figs. 87A, 88; see Benthic Ecosystems for Tile 6). The horns join at the top, giving the area behind the reef a triangular shape. Storm-derived debris fields of coral rubble behind most other reefs are elongate in shape (Figs. 33A, 33B, 48B, 75, 87B).
- At least eight coral-rock ridges or old reef lines are clearly visible in aerial photomosaics of the outer-shelf sea floor east of Looe Key Reef (Fig. 87A). The ridges are likely present immediately beyond the western side of the reef but are less obvious until they again become more prominent (i.e., less buried) between Maryland and Pelican Shoals (Fig. 87B). Though evident in aerial photographs, the ridges are below seismic resolution (<1 m) and thus are not observed in seismic data unless the seismic line crosses a ridge capped by comparatively high-relief patch reefs (for example, Fig. 39B, line 19 in Fig. 89, and line 26 in Fig. 90; seismic tracklines shown in Fig. 91A, 91B).
- The seaward reef zone consists of three spur-and-groove reefs at depths of ~3 m, 7-8 m, and 15-20 m (Fig. 88; Lidz et al., 1985). The deep reef drops precipitously to a depth of 30 m and is fronted by a sand flat on the upper-slope terrace.
- A sand lobe composed principally of clean white sands is presently burying the intermediate and deep reefs and has covered the dropoff seaward of the center of the intermediate reef (Fig. 88). The sand lobe indicates large-scale westward and southwestward sand transport that occurs during winter storms.
- A core behind Looe Key Reef recovered the deepest (~15 m) mangrove peat found so far on the reef tract (Fig. 92A).
Figure 89. Interpreted seismic reflections representing Pleistocene and Holocene surfaces traced from profiles across shelf margin off the lower Keys (from Lidz et al., 1997a). Note the subdued nature of the reef-and-trough system at the margin (less discernible backreef trough than off the upper Keys, Fig. 90) and expansive system of outlier reefs and unfilled troughs on the upper-slope terrace. Profiles are aligned on what this study uses as the modern margin (vertical line at the 30-m-contour depth) in consecutive order from east to west (see Fig. 91B for locations). Lower Keys are at left. Straits of Florida are at right. Note deep pass between outliers off Key West (scale change from 50 to 100 milliseconds on trackline 14). Corals from four cores recovered from the primary outlier off Sand Key Reef (line 16a) yielded important radiometric ages (Table 5, Table 6, Table 7). Essentially empty troughs behind the outlier reefs indicate that parts of the margin fronted by outlier reefs are progradational, that is, those parts will have expanded seaward rapidly over several kilometers at the point when the troughs become filled (Shinn et al., 1991; Lidz, 2004). Elevations of shelf-edge and outlier reefs are on average at or below the shelf bedrock surface, indicating lack of protective offbank rock-island barriers during shelf flooding. Distance along margin between end profiles is ~65 km. Diamonds indicate profiles used in block diagrams (Tile 7/8). Line 16c was not used in the lower Keys block diagrams due to oblique orientation of the trackline (see Fig. 91B), which distorted width of features in seismic imagery. [larger version] |
Figure 90. Interpreted seismic reflections representing Pleistocene and Holocene surfaces traced from profiles across shelf margin (vertical line) off the upper Keys (from Lidz et al., 1997a). Note obvious reef-and-trough system at the margin (versus that off the lower Keys, Fig. 89) and absence of such a system on the terrace. However, also note linear, buried low-relief features on the terrace believed to correspond to the lower Keys outlier-reef tracts. Profiles are in consecutive order from northeast to southwest (see Fig. 91A for locations). Island of Key Largo is at left. Straits of Florida are at right. Infilled shelf-edge trough and lack of seaward outlier reefs indicate that the parts of the margin illustrated are aggradational, that is, those parts can only expand seaward slowly by coral growth. Poor seismic resolution of internal structure of trough facies is consistent with reef-rubble infill. A double trough behind The Elbow indicates that part of The Elbow may have been an outlier reef. A shelf-edge reef higher than platform bedrock would have provided a protective rock-island barrier during shelf flooding. Distance along margin between end profiles is ~10 km. Diamonds indicate profiles used in block diagrams (Tile 7/8). [larger version] |
Figure 91. (A) Upper Keys study area of Lidz et al. (1997b) showing numbered August 1991 seismic tracklines (red) and boundaries of John Pennekamp Coral Reef State Park (black dotted lines). Bold black parts of lines 13, 9, 28, and 32 indicate areas of seismic profiles A-A', B-B', C-C', and D-D', respectively, in Lidz et al. (1997a, their figs. 7 and 8). Diamonds indicate lines along which profile sections at the margin were used to construct block diagrams showing Holocene flooding of the upper Keys margin (Tile 7/8). Note reentrant (pass) through the shelf-edge reef south of The Elbow, discussed in Lidz et al. (1997a). (B) Lower Keys study area of Lidz et al. (1991) showing numbered July 1989 seismic lines (red) and areas of highly developed, multiple, outlier reefs detected in the seismic data (dark shading, well developed; light shading, less well developed; Fig. 18). Subsequent to the 1991 study, four tracts of outlier reefs were documented photographically in Lidz et al. (2003). Bold black parts of tracklines indicate seismic-profile sections illustrated in Lidz et al. (1991). Diamonds indicate lines along which profile sections were used to construct block diagrams depicting flooding of the lower Keys margin (Tile 7/8). Blue line marks 30-m-depth contour of shelf margin. [larger version] |
Figure 92. Cross sections of Looe Key Reef (lower Keys) and Grecian Rocks (upper Keys) show reef components and uncorrected radiocarbon ages of corals recovered in cores at those sites. (A) Holocene coral growth at Looe Key Reef began on a bedrock-limestone ridge, possibly an outlier reef, and backstepped over a bedrock depression filled with carbonate sand and rubble (modified from Lidz et al., 1985). Note natural gaps or divides between coral reef sections. Looe Key cores are designated LK with a number. (B) Holocene coral zonation at Grecian Rocks in the 1960s showed five distinct zones (Shinn, 1963; modified from Shinn, 1980a), indicated by the circled numbers. Field observations in 2002 revealed that most of the corals including hydrocorals were dead. Conventional radiocarbon ages of 6580±90 yr B.P. at base of Looe Key core LK5 and 5950±100 yr B.P. in Grecian Rocks core 4 indicate coral growth began sooner in the lower than upper Keys. The ages shown are uncorrected for variations in 14C production. Two-sigma calibration ranges are given in Table 4. Note depths and locations of mangrove peat in both figures. Peat forms at very low-wave-energy shorelines. The deepest peat found so far on the reef tract was recovered in core LK1. [larger version] |
On Florida reefs, coral spurs vary in width from ~7.6 to 61 m and extend several hundred meters into prevailing seas and swells and to depths of ~30 m (Shinn, 1963). Coring at Looe Key Reef indicated that:
- Spurs and intervening grooves developed on carbonate sand and reef rubble at least 5 m thick, similar to reefs of Grecian Rocks in the upper Keys (Shinn, 1980a; Fig. 92A, 92B).
- The underlying bedrock surface is essentially flat and therefore did not control or influence spacing of spurs and grooves (Lidz et al., 1985).
- Only the thin seaward ends of the spurs are rooted on underlying bedrock.
- The interior of Millepora-encrusted spurs is composed primarily of Acropora palmata, a species sparse in the 1983 study and now almost non-existent as live specimens on the reef. Coring at Looe Key Reef and elsewhere in the keys led to the conclusion that most shallow spurs and grooves in the Florida-Caribbean region are constructional in origin and are not controlled by bedrock topography (Shinn et al., 1981).
Bathymetry and bedrock topography show that the bulk of the Looe Key NMS occupies a shallow (0-7 m), broad (1-2 km wide) ridge between a landward trough (Hawk Channel depression, <15 m deep) and the outer-margin dropoff (to >30 m) south of Looe Key Reef (Lidz et al., 1985). Average sediment thickness in the Sanctuary is 5.7 m, whereas directly behind the reef it is 12 to 15 m. Prevailing direction of sediment transport is from east to west, parallel to the margin (Fig. 88); however, coral rubble has accumulated immediately behind the reef, and coral-rich sands have collected both landward and seaward of the reef. Based on seismic and radiocarbon-age data, the rate of sediment accumulation in the Looe Key Sanctuary is estimated to have been 1 to 2 m
/1 ka during the past 7 ka.
Quantitative sedimentary petrology revealed the dominant type of sand grain in the Sanctuary in 1983 was coral, followed by fragmented molluscs and Halimeda (Fig. 12; Lidz et al., 1985). In 1983, coral grains constituted 30 to 50% of the sediment. A lower percentage of Halimeda grains conformed to a trend of decreasing Halimeda sand content from north to southwest along the reef tract (Fig. 64). Because this trend was accompanied by a gradual increase in the proportion of dead and dying (relative to healthy) reefs in the same direction (Fig. 61), the trend was interpreted to reflect greater production of coral sand resulting from a marked acceleration of bioerosion of abundant dead reefs in the area (Lidz et al., 1985).
continue to: Geologic Highlights
|