Data Series 835
A comparison of the DEM versus the sounding (x,y,z point data) was performed to evaluate how well the DEM represented the original sounding data quantitatively and spatially. This was done using the DEM surface and the original x,y,z point data shapefile and values were extracted using ESRI ArcGIS version 10.0.2 Spatial Analyst “extract values to points” tool. This produced a set of elevation values from which the root mean square error (RMS) was calculated using the following equation:

For each area, the difference between the DEM and the original sounding values were plotted, color coded, and placed against the backdrop of the DEM. This provided a visual aspect of the spatial representation of error (figs. 8 - 11). Approximately 98 percent of the data points are represented by the DEM for Port Channel South, Weeks Bayou, and Shark Island Bayou. The Port Channel North area is ~96 percent, yet still considered successful.
Table 8 lists simple statistics including the percentages of points represented and not represented by the DEM, the overall RMS, and the RMS values within a specific numeric interval. The average RMS error for all four areas is 0.412 m with a range from 0.225 to 0.732 m. The RMS error is high because the gridding algorithm has difficulty with representation of steep gradients and rapid depth transitions typical of river channel environments. This was true of the physical characteristics of these areas in which the channels were narrow and the channel sides extremely steep. It was common to encounter rapid transitions in bathymetry just within a few meters of horizontal distance. Additionally the gridding algorithm was constrained to a 10-m grid node spacing, and in most cases the single beam trackline spacing was wider than 10 m (fig. 4).
The Port Channel North area reports the highest overall RMS value of 0.732 m with the higher values concentrated in the north-eastern canal (table 8 and fig. 8). The processed DGPS navigation data in this area was very poor, which most likely was attributed to the very narrow channel and tall tree coverage on both banks encountered during the survey. Both factors could reduce the GPS antenna's view of the sky inhibiting satellite tracking and contributing to the higher RMS error in this area.
| Table 8. Final DEM representation percentages (%) and root mean square (RMS) error statistics for Port Channel North, Port Channel South, Weeks Bayou, and Shark Island Bayou, Louisiana. | ||||
Digital Elevation Model (DEM) Representation and Root Mean Square (RMS) Error |
||||
Port Channel North |
Port Channel South |
Weeks Bayou |
Shark Island Bayou |
|
Total x,y,z points |
66,409 |
119,344 |
216,324 |
68,631 |
Total x,y,z points represented by DEM |
63,980 |
118,505 |
214,716 |
66,997 |
Points represented by DEM |
96.34% |
99.30% |
99.26% |
97.62% |
Points not represented by DEM |
3.66% |
0.70% |
0.74% |
2.38% |
RMS overall |
0.732 |
0.309 |
0.383 |
0.225 |
RMS value from +1.00 to -1.00 meters |
0.410 |
0.258 |
0.319 |
0.203 |
Percentage of points from +1.00 to -1.00 meters |
86.48% |
98.21% |
97.56% |
99.36% |
RMS value from +0.50 to -0.50 meters |
0.252 |
0.162 |
0.221 |
0.154 |
Percentage of points from +0.50 to -0.50 meters |
65.42% |
89.32% |
85.31% |
95.41% |
RMS value from +0.25 to -0.25 meters |
0.142 |
0.116 |
0.129 |
0.121 |
Percentage of points from +0.25 to -0.25 meters |
41.23% |
76.37% |
61.15% |
83.61% |
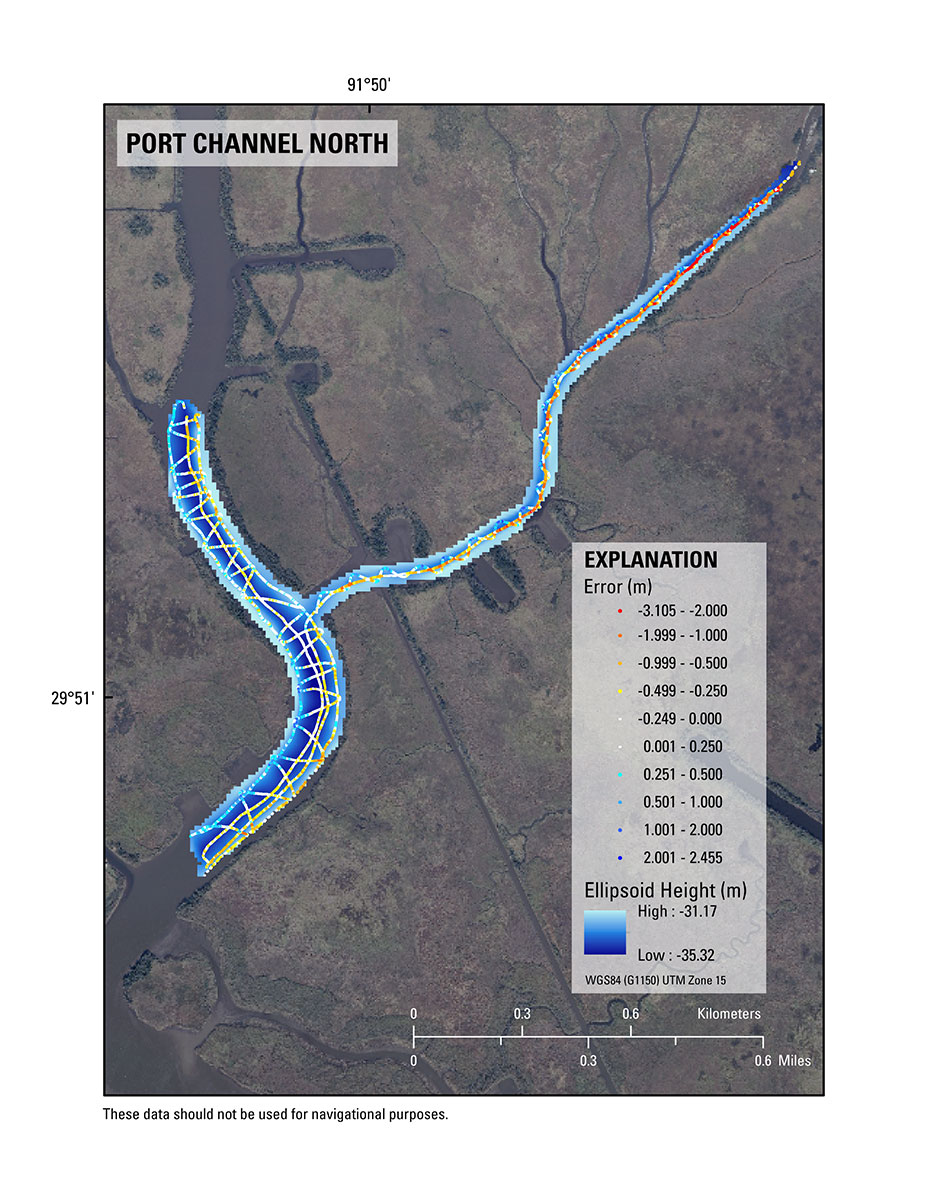
Figure 8. The Port Channel North, Louisiana, survey area image map of error values draped upon the DEM bathymetry grid referenced to UTM Zone 15N, WGS84 (G1150) and ellipsoid height. The error values represent the difference between the DEM and each sounding point. White symbols represent values from +/-0.000 to 0.250 meters and colored symbols represent values from +/- 0.250 to +/- 3.105 meters. Background map is a Digital Orthophoto Quarter-Quadrangle image created from 2012 data and provided by the USGS National Geospatial Program (NGP). [Click to enlarge]
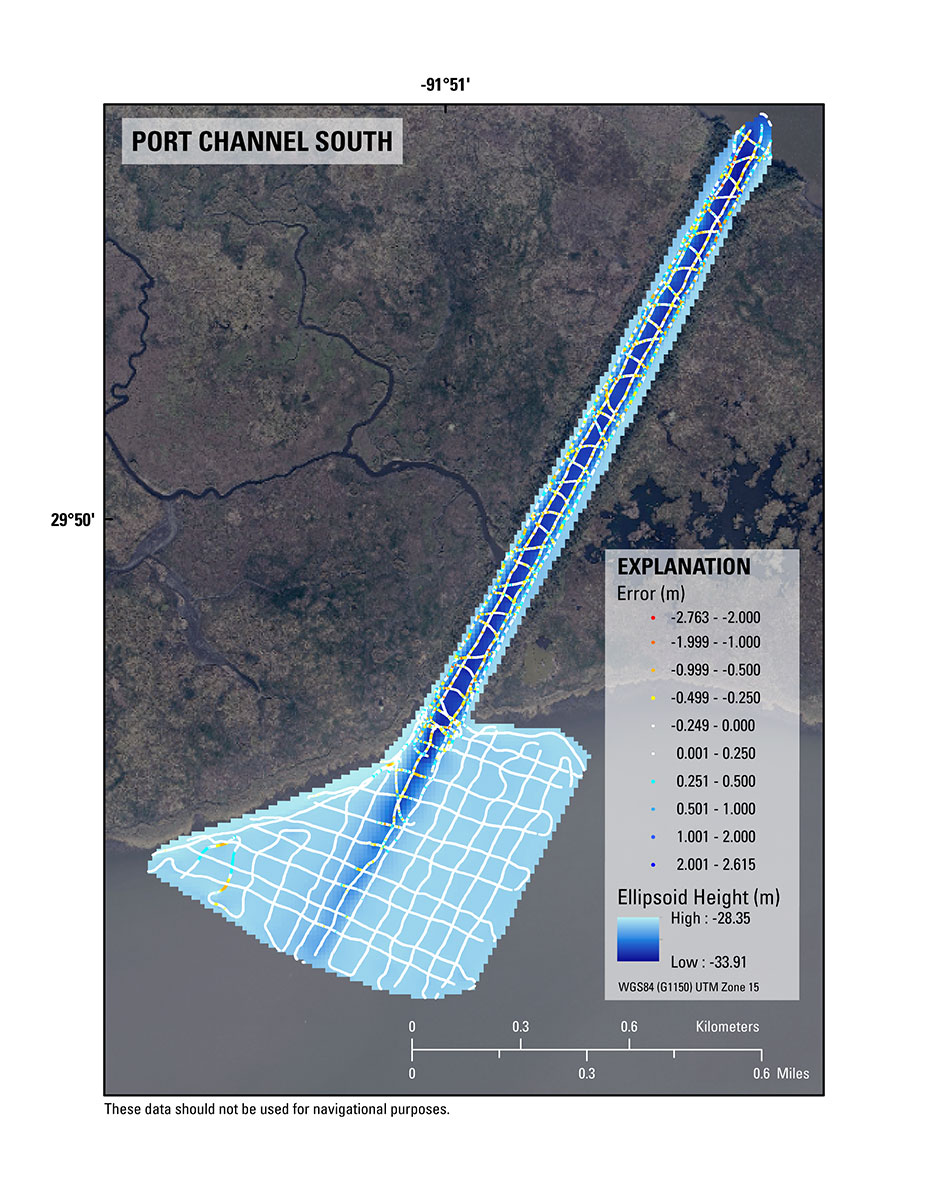
Figure 9. The Port Channel South, Louisiana, survey area image map of error values draped upon the DEM bathymetry grid referenced to UTM Zone 15N, WGS84 (G1150) and ellipsoid height. The error values represent the difference between the DEM and each sounding point. White symbols represent values from +/-0.000 to 0.250 meters and colored symbols represent values from +/- 0.250 to +/- 2.763 meters. Background map is a Digital Orthophoto Quarter-Quadrangle image created from 2012 data and provided by the USGS National Geospatial Program (NGP). [Click to enlarge.]

Figure 10. The Weeks Bayou, Louisiana, survey area image map of error values draped upon the DEM bathymetry grid referenced to UTM Zone 15N, WGS84 (G1150) and ellipsoid height. The error values represent the difference between the DEM and each sounding point. White symbols represent values from +/-0.000 to 0.250 meters and colored symbols represent values from +/- 0.250 to +/-3.222 meters. Background map is a Digital Orthophoto Quarter-Quadrangle image created from 2012 data and provided by the USGS National Geospatial Program (NGP). [Click to enlarge.]
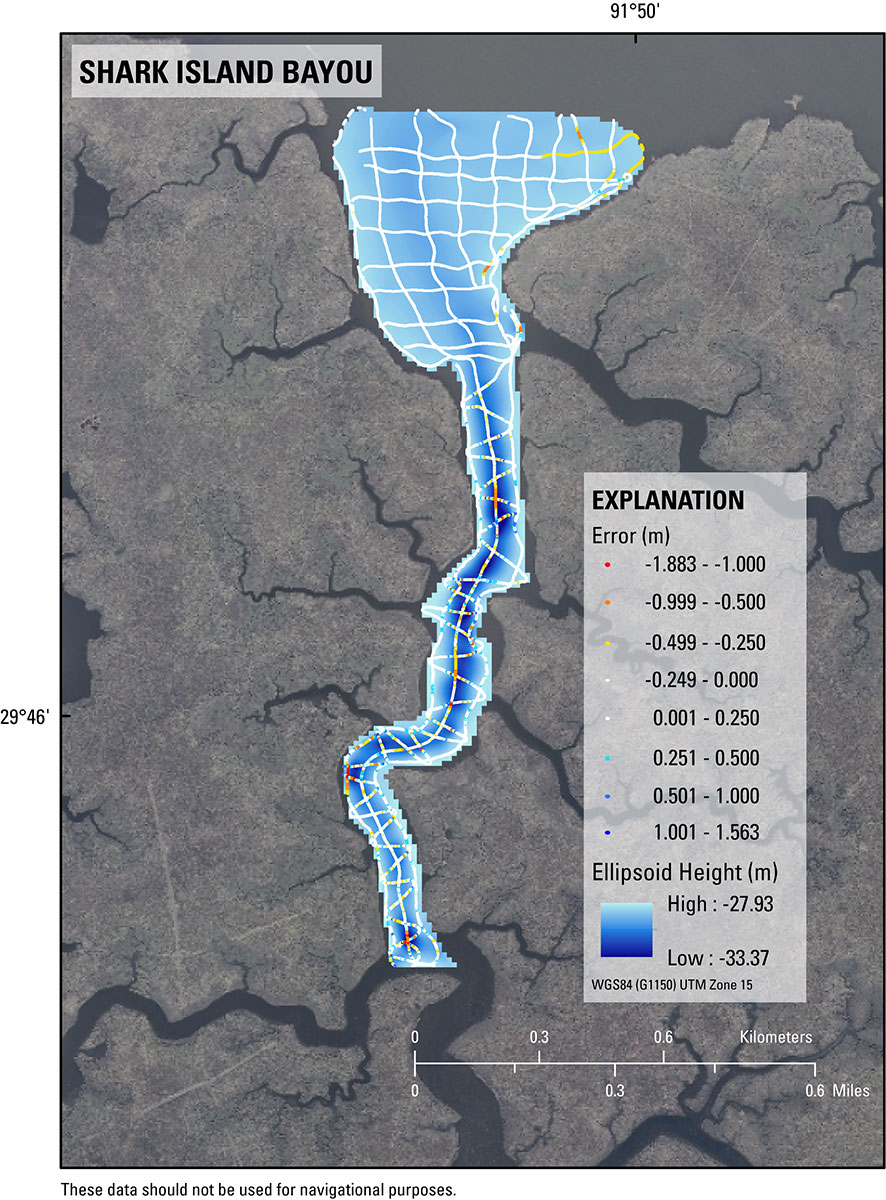
Figure 11. The Shark Island Bayou, Louisiana, survey area image map of error values draped upon the DEM bathymetry grid referenced to UTM Zone 15N, WGS84 (G1150) and ellipsoid height. The error values represent the difference between the DEM and each sounding point. White symbols represent values from +/-0.000 to 0.250 meters and colored symbols represent values from +/- 0.250 to +/-1.883 meters. Background map is a Digital Orthophoto Quarter-Quadrangle image created from 2012 data and provided by the USGS National Geospatial Program (NGP). [Click to enlarge.]

![]() U.S. Department of the Interior |
U.S. Geological Survey
U.S. Department of the Interior |
U.S. Geological Survey
URL: http://pubsdata.usgs.gov/pubs/ds/0835/ds835_Error.html
Page Contact Information: GS Pubs Web Contact
Page Last Modified: Monday, 28-Nov-2016 19:35:22 EST
