Data Series 917
|
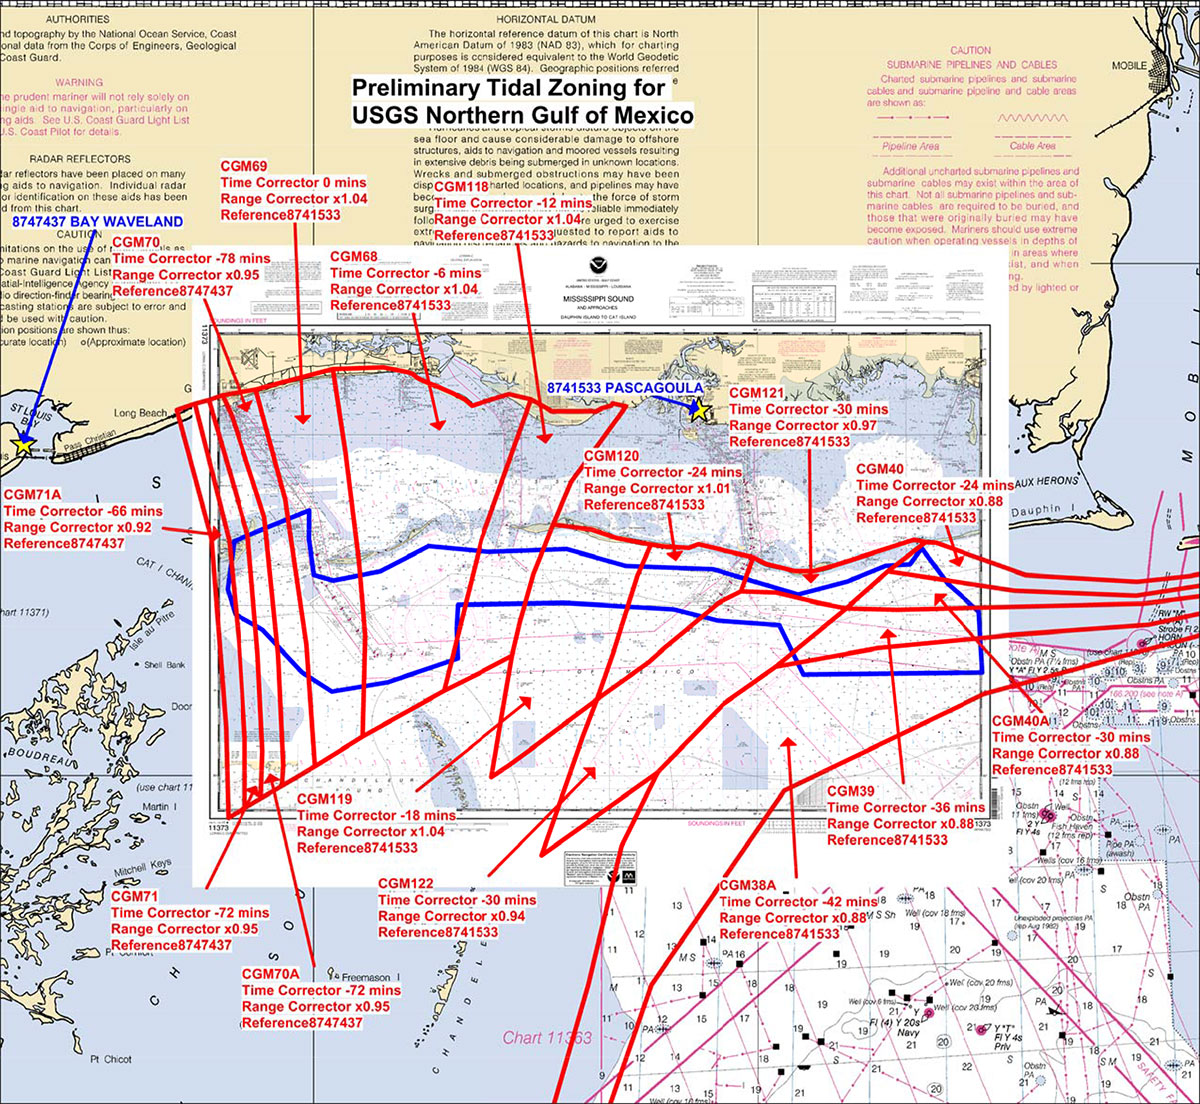
Data ProcessingINTERFEROMETRIC SWATH BATHYMETRY and BackscatterNavigation and MotionPosition data recorded by the Coda-Octopus F190R IMU system were corrected in real-time with the OmniSTAR HP differential navigation service. The IMU also applied real-time motion corrections for heave, roll, and pitch to the vertical component of each position fix. The corrected positions were integrated with the observed bathymetric values to calculate a final position and ellipsoid height representing the elevation of the seafloor with respect to the geodetic reference frame ITRF2005 (ITRF05) across the swath range. At various times during the cruise, difficulty in acquiring and maintaining satellite signal lock was encountered; therefore compromising the Differential Global Positioning System (DGPS) signal. This problem has since been deduced as poor antenna location causing multipathing and possibly a reduced view to the sky. The quality of the vertical accuracy of the ellipsoid was questioned and the first round of data processing results proved to be poor. To resolve the questionable DGPS accuracy for the vertical component a NOAA Tide Zone model was requested for the area (fig. 4). Using this zone model and the downloaded six minute verified tide data from the Pascagoula NOAA Lab tide station (#8741533) and the Bay Waveland Yacht Club tide station (#8747437), the vertical (z) component was referenced to the Mean Low Lower Water (MLLW) datum instead of ellipsoid height.
Soundings and BackscatterThe Systems Engineering and Assessment Ltd., program SWATHplus serves as acquisition software and initial processing software. Preliminary roll calibration data were collected and processed using SWATHplus and Grid Processor software versions 3.07.17. Instrument offset and calibration values were then input into the session file (.sxs). The raw data files (.sxr) were processed using the updated system configuration file that contained the roll calibration values, measured equipment offsets, acquisition parameters, navigation parameters, SOS at sonar head, and the SVP cast data. Any acoustic filtering applied in SWATHplus was also written to the processed data file (.sxp). The initial datum for the swath and backscatter data was ITRF05, which is the real-time acquisition datum of OmniSTAR HP position and navigation data. All processed data files (.sxp) were imported into CARIS HIPS and SIPS version 8.1 and finalized in version 8.1.7. The tide zone model and associated verified six minute tide data were applied using the CARIS Load Tide tool. The total propagated uncertainty was calculated for each data file. The original sounding data were edited for outliers using the CARIS Swath Editor tool and associated depth filters. Remaining outliers were then deleted manually. A CARIS BASE (Bathymetry with Associated Statistical Error) surface with the associated CUBE (Combined Uncertainty and Bathymetry Estimator) sample surface was created from the edited soundings dataset. A BASE hypothesis is the estimated value of a grid node representing all the soundings within a chosen resolution or grid-cell size (for example, 2 m) weighted by uncertainty and proximity, giving the final value as a "sample" of the data within the specific grid cell. This algorithm allows multiple grid-node hypotheses to be verified or overridden by the user while maximizing processing efficiency. A 2-m resolution CUBE surface was created to perform initial CUBE hypothesis editing followed by a higher 1-m resolution BASE surface cleaning using the CARIS Subset Editor tool. The 2-m resolution BASE surface sample x, y, z data were exported as ASCII in ITRF05 for the horizontal datum and MLLW for the vertical datum. The data were then transformed horizontally into WGS84 (G1150) and NAD83 referenced to GEOID12A with NOAA's VDatum software conversion tool version 3.2. The interferometric backscatter (IFB) was processed using SXPTools (build 175). SXPTools is US Geological Survey software that uses command line programs to enhance the quality of the backscatter from SEA SWATHplus processed data files using an empirical gain normalization scheme. The processed (.sxp) files were gridded using MBSystem (Version 5.3) and exported in ESRI ASCII Grid format. The grid was imported into ESRI's ArcGIS Version 10.2, converted to a raster file with the ASCII to Raster Tool. The final mosaic was exported in GeoTIFF format referenced to ITRF05 (fig. 5).
Sidescan SonarThe sidescan sonar acoustic backscatter data from the Klein 3900 was imported into SonarWiz5 version 5.06, and bottom tracking was applied creating a slant range corrected record to define the seafloor directly below the swath transducers. Once the seafloor was defined, slant range was applied to remove the water column from the data and minimize target shadows. A backscatter mosaic was created from the individual SSS lines and adjusted for contrast and brightness. The final mosaic was exported in GeoTIFF format and imported into Esri's ArcGIS version 10.2, where the histogram was adjusted to enhance the display of seafloor surface material. Missing tracklines from the mosaic grid are a direct result of equipment issues with the Klein 3900 during the cruise. Data were corrupt, noisy, or not collected in these areas (fig. 6).
DIGITAL ELEVATION MODEL
Note: Any use of trade names is for descriptive purposes only and does not imply endorsement by the U.S. Government. |

![]() U.S. Department of the Interior |
U.S. Geological Survey
U.S. Department of the Interior |
U.S. Geological Survey
URL: http://pubsdata.usgs.gov/pubs/ds/0917/ds917_data_processing.html
Page Contact Information: GS Pubs Web Contact
Page Last Modified: Monday, 28-Nov-2016 20:36:14 EST


