|
| |
Survey Products
The images here are representations of the survey tracklines (figs. 2), DEM map product (fig. 5), and the interferometric backscatter map (fig. 6 and 7), and DEM grid error (fig. 8). The data files are available for download from the Data Downloads page.
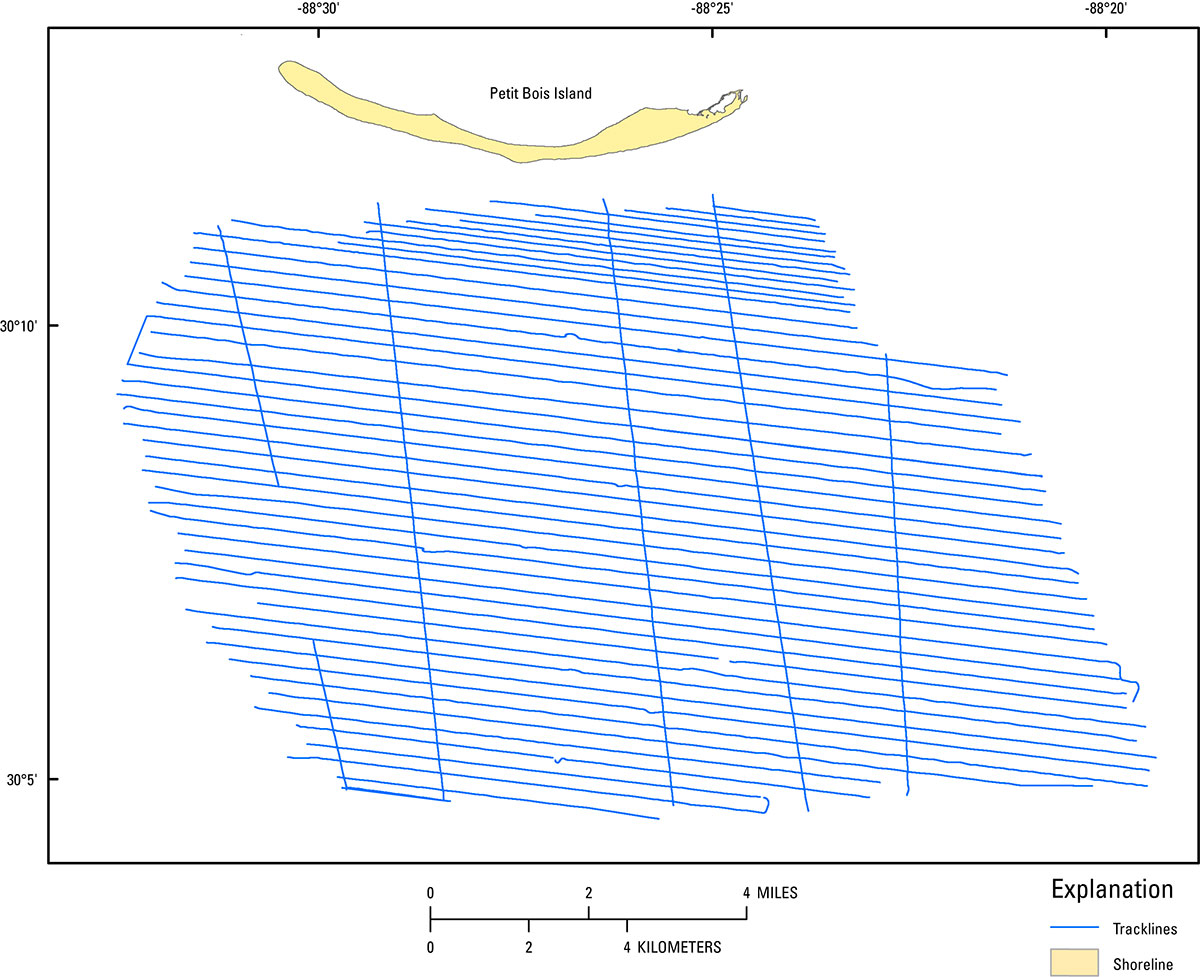
| TRACKLINES
|
|
BATHYMETRY
|
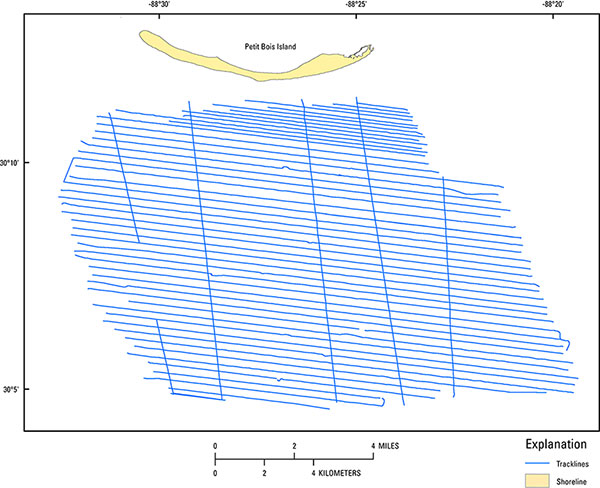
Figure 2. Swath bathymetry and sidescan sonar tracklines for the 2013 geophysical survey offshore of Petit Bois Island, Gulf Islands National Seashore, Mississippi. [Click to enlarge]. |
|
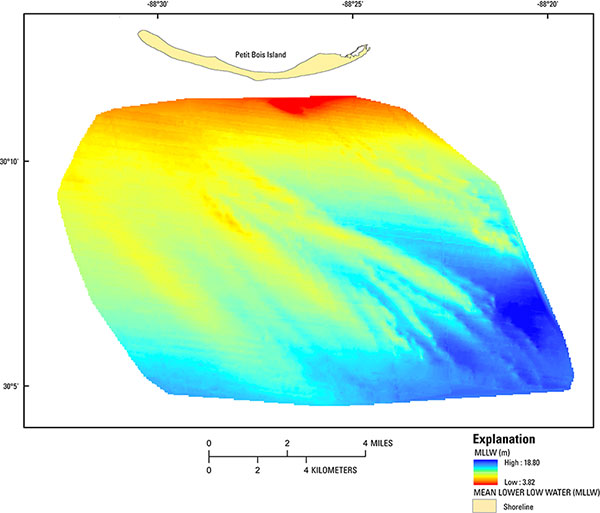
Figure 7. 50-meter digital elevation model for the 2013 geophysical survey offshore of Petit Bois Island, Gulf Islands National Seashore, Mississippi. [Click to enlarge.] |
| |
|
|
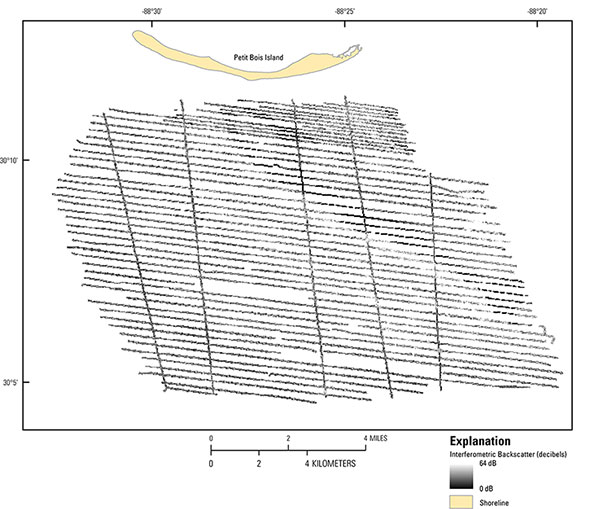
Figure 5. Interferometric backscatter from the swath system for the 2013 geophysical survey offshore of Petit Bois Island, Gulf Islands National Seashore, Mississippi. [Click to enlarge] |
|
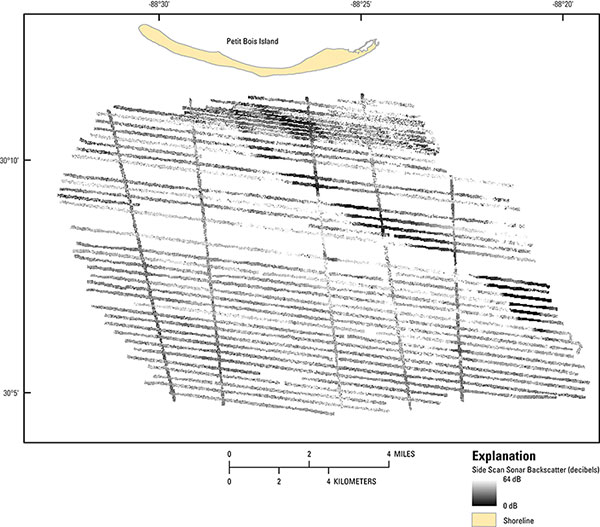
Figure 6. Sidescan sonar acoustic backscatter from the Klein 3900 for the 2013 geophysical survey offshore of Petit Bois Island, Gulf Islands National Seashore, Mississippi. [Click to enlarge] |
|
|
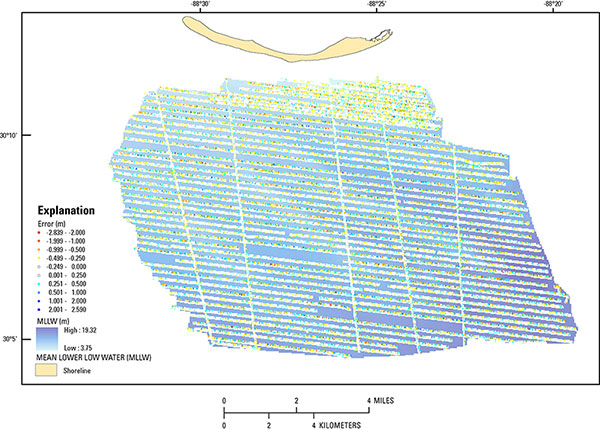 Figure 8. Error values representing the difference between the digital elevation model and the value at each sample point. White symbols represent acceptable system error of +/-0.250 meters. [Click to enlarge.] Figure 8. Error values representing the difference between the digital elevation model and the value at each sample point. White symbols represent acceptable system error of +/-0.250 meters. [Click to enlarge.] |
(back to top)
|